


Abstract
Time-resolved particle image velocimetry recently has been demonstrated in high-speed flows using a pulse-burst laser at repetition rates reaching 50 kHz. Turbulent behavior can be measured at still higher frequencies if the field of view is greatly reduced and lower laser pulse energy is accepted. Current technology allows image acquisition at 400 kHz for sequences exceeding 4000 frames but for an array of only 128 × 120 pixels, giving the moniker of 'postage-stamp PIV'. The technique has been tested far downstream of a supersonic jet exhausting into a transonic crossflow. Two-component measurements appear valid until 120 kHz, at which point a noise floor emerges whose magnitude is dependent on the reduction of peak locking. Stereoscopic measurement offers three-component data for turbulent kinetic energy spectra, but exhibits a reduced signal bandwidth and higher noise in the out-of-plane component due to the oblique camera images. The resulting spectra reveal two regions exhibiting power-law dependence describing the turbulent decay. The frequency response of the present measurement configuration exceeds nearly all previous velocimetry measurements in high speed flow.
Export citation and abstract BibTeX RIS
1. Introduction
The measurement of turbulent velocity spectra in high-speed flows has been an instrumentation challenge for decades. In large part, this is because of the very high frequencies that must be reached at small spatial scales to capture the transfer of turbulent energy from the larger production scales towards dissipation scales. If detection of the onset of the inertial subrange is a goal for such measurements, Pope predicts this to occur at frequencies of about 40–100 kHz in transonic flows of practical aerodynamic application [1].
Traditionally, the most common means of measuring velocity spectra is hot-wire anemometry. The electrical frequency response of a hot-wire probe can easily exceed 100 kHz and this is the value most frequently specified to characterize the sensor. However, recent studies based on comparative measurements of turbulent fluctuations indicate that limitations in spatial resolution restrict the frequency response to much lower values, apparently in the 5–20 kHz range [2, 3]. Even where the wire was held sufficiently short to provide adequate time response, spatial scales inhibited the overall frequency response of the instrument. The clear exception is the nano-scale thermal anemometry probe, which in fact can achieve a frequency response exceeding 150 kHz [4, 5]. Laser Doppler velocimetry has been widely used for high-speed turbulence measurements as well, but fast acquisition rates lie only in the 10–20 kHz range. Moreover, the non-uniform particle arrival rate requires correction schemes not only to remove the particle arrival bias but to extract spectral content, and these approaches may have inaccuracies at frequencies approaching the maximum particle arrival rate [6, 7]. Both techniques also may have difficulties collecting all three velocity components simultaneously without interference between them or differing spatial sampling parameters. For these reasons, established velocimetry techniques are insufficient for measuring turbulent energy spectra in high-speed flows. Emerging techniques based upon the Doppler shift of the laser light itself show promise for reaching much faster sampling rates, but have not yet achieved more than limited application [8, 9].
In contrast, time-resolved particle image velocimetry (TR-PIV) has rapidly found widespread use in low-speed flows and recently has been demonstrated in a high-speed wind tunnel using a pulse-burst laser [10], which is the only light source capable of producing sufficient energy at the necessarily rapid pulse rates. Following the pioneering work of Wernet [11] and subsequent development by Brock et al [12] and Miller et al [13, 14], Beresh et al have used pulse-burst PIV in their trisonic wind tunnel (TWT) to investigate a supersonic jet exhausting into a transonic crossflow [15] and for transonic flow over a rectangular cavity [16, 17]. In addition, pulse-burst PIV data have been acquired in the Multiphase Shock Tube to study the transient onset of a von Kármán vortex street shed from a cylinder [18] and particle drag in a shocked dense gas-solid flow [19]. Pulse-burst PIV has seen an extension to longer acquisition periods by Miller et al [20] and supersonic application by Vanstone et al [21] and Beresh et al [22]. In all these cases, temporal phenomena were measured by the high repetition rates of pulse-burst PIV and are key to understanding the dominant physics describing the behavior of each of these flows. However, the turbulent behavior at all but the largest scales occurs at still higher frequencies.
Scarano and Moore [23] demonstrated an effective means of extracting considerably higher frequencies of information from TR-PIV than would be indicated merely by the framing rate of vector fields. In the time between successive velocity fields in a typical TR-PIV system, the flow convects by multiple vector spacings. The intervening vectors all contain valid information that may be introduced to the temporal signals. For flows dominated by convection, Taylor's hypothesis of frozen turbulence may be assumed locally valid over this short distance and time [24] and the local instantaneous convection velocity may be used to convert these additional vectors to smaller time steps to fill the temporal gaps between actual data acquisition intervals. Scarano and Moore [23] describe such a supersampling algorithm and portray it as 'pouring space into time'.
Still, the supersampling technique of Scarano and Moore has significant limitations. The maximum frequency response is necessarily restricted by the spatial resolution of a single vector measurement and by the time between laser pulse pairs. Another limitation is that planar PIV does not provide information on the out-of-plane convection and therefore supersampling must work solely with 2D motion (even for stereoscopic PIV). In one of the test cases examined by Scarano and Moore, they discovered that the achievable supersampled frequency in a low-Reynolds-number jet was reduced due to nonlinear interactions in the large-scale vortices that dominated the flow. This motivated development of a more sophisticated algorithm by Schneiders et al [25] that incorporated solutions of the Navier–Stokes equations to avoid the assumptions of Taylor's hypothesis. Schreyer et al [26] took an alternative approach using repeated measurements from a dual PIV system with varying time delay between them, allowing reconstruction of spectral content but lacking the full spatio-temporal information of TR-PIV.
Given the limitations of temporal supersampling, a need exists for still faster implementations of TR-PIV. PIV has been demonstrated at 1 MHz by Wernet and Opalski [27] and Brock et al [12] but these were limited to sequences of 7 and 13 vector fields, respectively, which is inadequate to obtain spectral content. Pulse-burst PIV as developed by Beresh et al [10] can be achieved at higher frequencies if the field of view is greatly reduced. The laser energy available at high frequencies is considerably diminished and must be confined to a smaller area if sufficient scattered energy is to be collected. Current high-speed camera technology allows very fast image acquisition for long time sequences if the field of view is windowed down to a small array. Combining these capabilities, pulse-burst PIV has been acquired at 400 kHz for image sequences exceeding 4000 frames, but by necessity for a small array of only 128 × 120 pixels, giving rise to the moniker of 'postage-stamp PIV'. Despite the limited spatial extent, this approach is well-suited to measuring turbulent velocity spectra and can be used to test whether PIV is capable of reaching the very high frequencies that earlier measurement techniques have not. The present article details the implementation of postage-stamp PIV to extract accurate high-frequency information, compares the data with supersampled results, and demonstrates the scaling laws for turbulent decay that are revealed by this measurement technique.
2. Experimental configuration
2.1. Wind tunnel hardware
The development of postage-stamp PIV has been performed using a supersonic jet exhausting into a transonic crossflow, a flow that has been studied thoroughly employing both conventional [28–30] and pulse-burst PIV [10, 15]. The present experimental configuration is identical. This work was conducted in Sandia's TWT, which is a blowdown-to-atmosphere facility using air as the test gas. In its solid-wall transonic configuration, the test section is a rectangular duct of dimensions 305 × 305 mm2 (12 × 12 inch2). Mach 0.8 was tested exclusively for the data used herein at a fixed stagnation pressure of 154 kPa and stagnation temperature of 321 K ± 2 K.
The jet-in-crossflow experiment was configured with a supersonic jet installed on one wall of the transonic test section upstream of its windows. The upstream location of the jet positioned the imaging region for measurement of the far-field of the jet interaction once it has developed, as shown in figure 1(a). The laser sheet was oriented in the streamwise plane and aligned to the center plane of the test section, which coincides with the center of the jet nozzle exit. A nitrogen jet exhausted from a conical nozzle with a design Mach number of 3.73, an expansion half-angle of 15°, and an exit diameter of 9.53 mm. In the present case, the jet was operated at a pressure of 3.9 MPa to produce a jet-to-freestream dynamic pressure ratio of J = 8.1. The coordinate axes originate at the centerpoint of the nozzle exit plane; the u component is in the streamwise direction and the v component is positive away from the tunnel wall.
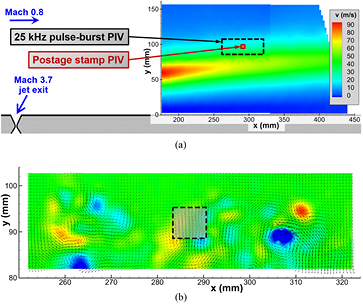
Figure 1. Field of view of the postage-stamp PIV measurement within the larger jet-in-crossflow experiment superposed on (a) a conventional PIV mean vector field of the far-field (reproduced from [28]; image stated to be in the public domain), and (b) a snapshot of the vorticity field from the earlier 25 kHz pulse-burst PIV data (reprinted with permission from [15]. Copyright 2016, AIP Publishing LLC).
Download figure:
Standard image High-resolution imageThe TWT is seeded by a thermal smoke generator (Corona Vi-Count 5000) whose output is delivered to the TWT's stagnation chamber upstream of the flow conditioning section through a series of pipes and tubes, in which agglomeration of the particles occurs. Previous measurement of the in situ particle response across a shock wave generated by a wedge reveal a frequency response of 500–700 kHz, corresponding to a particle size of 0.7–0.8 µm when sphericity is assumed. Stokes numbers have been estimated as at most 0.05 based on a posteriori analysis of PIV measurements, which by conventional analysis is sufficiently small to render particle lag errors negligible [31, 32].
However, TR-PIV deserves a more careful analysis as errors may concentrate towards high frequencies and impact specific spectral content even if the integrated response is adequate. A common if arbitrary descriptor of frequency response is to define the point at which the energy of the velocity fluctuations is reduced by a factor of two. Melling's analysis [32] predicts this will occur between 100–200 kHz for the present particle diameter and Mei [33] provides a more refined range of 160–200 kHz. As will be shown subsequently, under the best circumstances in the present experiments the noise floor emerges at about 120 kHz and therefore particle lag effects become significant only at frequencies beyond those measurable.
2.2. Pulse-burst PIV system
A burst-mode laser (QuasiModo-1000, Spectral Energies, LLC) with both diode- and flashlamp-pumped Nd:YAG amplifiers was used to produce a high-energy pulse train at 532 nm. The pulse-burst laser generates a burst of maximum duration 10.2 ms once every 8–12 s with a maximum repetition rate of 500 kHz. For postage-stamp PIV, it was operated to deliver single pulses at 400 kHz with an energy of about 8 mJ per pulse at 532 nm, creating a time between successive pulses of 2.5 µs. The laser sheet was narrowed to a slender width to concentrate the available energy in the small field of view and had a sheet thickness of 1 mm. A total of about 170 bursts of data were acquired.
Images were acquired using high-speed CMOS cameras (Photron SA-Z), which have an array of 1024 × 1024 pixels at a full framing rate of 20 kHz. The SA-Z cameras were operated at 400 kHz, which necessitates that they are windowed down to a small array of only 128 × 120 pixels; hence the use of the term 'postage-stamp PIV'.
Three SA-Z cameras were used to acquire two independent measurements. One camera was aligned for a conventional two-component measurement. The other two cameras combined for a stereoscopic measurement with each camera oriented at a half-angle of 20°. The cameras each were equipped with 200 mm focal length lenses and anti-peak-locking diffuser plates [34]. Scheimpflug mounts were used to ensure focus of the two oblique images. The two-component configuration provides a safe measurement without possibility of bias due to an inadequate calibration using such a tiny imaging array, but a successful stereo measurement offers three-component data for evaluation of the turbulent kinetic energy spectra.
Data were processed using LaVision's DaVis v8.3.1. In each case, image pairs were background corrected, intensity normalized, and then interrogated with an initial pass using 64 × 64 pixel interrogation windows, followed by two iterations of Gaussian-weighted 24 × 24 pixel interrogation windows. A 50% overlap in the interrogation windows was used as well. The resulting vector fields were validated based upon signal-to-noise ratio, nearest-neighbor comparisons, allowable velocity range, and a median filter in both space and time. Close attention to the seeding stability yielded a valid vector rate in excess of 99%, which is particularly important for measurement of high-frequency spectral content. Low valid-vector rates degrade high-frequency accuracy and are not well corrected by vector interpolation.
Much of the data analysis concerns power spectral densities (PSDs) of the velocity fluctuation energy. A standard Welch periodogram fast Fourier transform with a Hamming window was used, except that spectra were computed on each burst of data without further windowing and then all bursts were averaged together. The frequency resolution was 100 Hz limited by the burst length of 10.2 ms.
2.3. Stereoscopic PIV calibration
A customized single-plane calibration plate was used to calibrate all three cameras for the two PIV measurements. The target was an aluminum plate 3.05 mm thick machined such that each surface was very flat and parallel, drilled with normal fiduciary holes every 1.59 mm. The target was carefully aligned to known coordinates then translated through the volume of the laser sheet. Seven calibration stations were imaged by each camera and calibration was accomplished using a third-degree polynomial fit by the DaVis software. The two-component measurement was calibrated simply by determining a scale factor.
A unique challenge arises when performing a stereo calibration on an image only 128 × 120 pixels in extent. In the field of view for postage-stamp PIV, only a 5 × 4 matrix of fiduciary dots is visible, which limits the precision of the calibration. In contrast, the field of view of the full 1024 × 1024 array of the camera captures the entire calibration target and can fit through many more points better differentiated in space. A stereo calibration using the full array and all fiduciary dots could be applied to the postage-stamp images formed by only the central 128 × 120 pixels. However, this seemingly superior stereo calibration did not produce significantly different spectral data than the limited calibration based upon the 5 × 4 array of dots.
Self-calibration is similarly a challenge on such a small field of view. Correlations for self-calibration typically must be applied on much larger interrogation windows than velocity vector interrogation, which exceed the size of the postage-stamp array. A sufficient array of disparity vectors could not be produced to accurately correct rotation but even a single disparity vector can correct translation. Stereo calibrations adjusted by incorporating self-calibration estimates did not yield significantly different spectra. Therefore, the resulting velocity data appear robust to the quality of the stereo calibration, at least for spectral content.
3. Results
The field of view for the postage-stamp PIV is shown in figure 1. The full extent of the jet-in-crossflow experiment is given in figure 1(a), with the vertical component of the mean velocity field shown positioned in its far-field location. These data were acquired using conventional 10 Hz PIV and are reproduced from [28]. Superposed are the fields of view for both the 25 kHz pulse-burst PIV described in [10, 15] and the current postage-stamp PIV. The small size of the postage-stamp PIV window is evident, hardly more than a point measurement. Figure 1(b) reproduces a previous pulse-burst PIV vector field and derived vorticity field from [15] as well as the postage-stamp PIV field of view.
Figure 2 shows a sample vector field acquired using two-component postage-stamp PIV at 400 kHz. Velocity vectors are superposed on a contour plot of the vertical velocity magnitude. The small field of view emphasizes that little may be discerned about the overall structure of the flow. Although adjacent velocity vectors are similar to one another, even over this brief distance the velocity can be observed to vary. This indicates that small-scale turbulent fluctuations are captured and the goal of postage-stamp PIV is achievable: to capture high-frequency small-scale turbulence that occurs within the context of the overall flowfield behavior.

Figure 2. Sample snapshot of a postage-stamp PIV velocity field extracted from a 10.2 ms burst of 4200 velocity fields acquired at 400 kHz. Velocity vectors are shown superposed on a contour plot of the vertical velocity component.
Download figure:
Standard image High-resolution image3.1. Two-component data
The power spectra of the velocity fluctuations that are measured by the two-component postage-stamp PIV are shown in figure 3. Two PSD plots are shown averaged from all 170 bursts, one for the streamwise component of velocity fluctuations and the other for the vertical component. Also given in figure 3 are the velocity spectra obtained by supersampling the 25 kHz PIV data from Beresh et al [15]. A supersampling factor of 16 was used to reflect the number of vectors between successive vector fields, reducing the time between snapshots to 2.5 µs, which still exceeds the frequency response limitation of the 2.0 µs time between paired laser pulses. Slopes for −1 and −5/3 power law dependencies are provided as well.
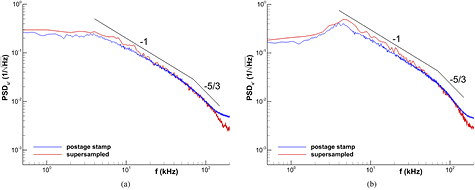
Figure 3. Postage-stamp PIV power spectra of velocity fluctuations for the jet in crossflow, measured near the center of the field of view. Spectra from velocity supersampling of 25 kHz data also are shown. (a) Streamwise component; (b) vertical component.
Download figure:
Standard image High-resolution imageIn the present case, the properties of the jet interaction change very little within the far-downstream field of view and it suffices to examine the spectra at a single point near the center of the field of view where no edge effects interfere with computing correlations as particles may exit the field of view. Though a single vector location is used, an adequate spatial extent must be provided to both capture the convection of particles between exposures and to provide a sufficient spatial description of the velocity gradients to serve the image deformation step within the interrogation process. Despite the slowly evolving flow, spectra are not averaged over adjacent vectors because PIV uncertainty correlates spatially due to common flow features and therefore neighboring vectors are not statistically independent (e.g. [35]).
For both velocity components in figure 3, the postage-stamp results well match the supersampled data to nearly the end of their range, at which differing noise floors account for their deviation. The noise floor begins to show at about 150 kHz for the supersampled data, but emerges at about 120 kHz for the postage-stamp PIV and has a greater value. The most consequential of the spectra is the vertical component in figure 3(b). The spectra peak at 4 kHz, which corresponds to one full period between pairs of turbulent eddies convecting through the flow [15]. Following the peak, the spectra then exhibit a −1 slope dependence to about 60–70 kHz before gradually transitioning to an apparent −5/3 slope dependence. The presence of the −5/3 region is well-known and expected as a consequence of the inertial subrange of turbulence decay (e.g. Pope [1]). The −1 dependence, on the other hand, is an unanticipated discovery and extends over more than one full decade, from approximately 4–60 kHz.
The streamwise component in figure 3(a) also appears to be supportive of a −1 slope dependence but its lack of a peak means this region does not initiate until close to 10 kHz. The −5/3 slope dependence at high frequencies is somewhat less convincing for the streamwise component than for the vertical component. This is because the overall intensity of the streamwise velocity fluctuations is reduced compared to the vertical velocity fluctuations, and therefore the impact of the noise floor is felt sooner.
The close agreement of the postage-stamp PIV data with the supersampled data from the original 25 kHz pulse-burst PIV data validates the efficacy of Scarano and Moore's supersampling algorithm [23], at least for the jet-in-crossflow experiment. This flowfield is well-suited for use of supersampling because in the far-field where measurements are acquired, the flow is dominated by convective motion nearly aligned with the freestream direction. Therefore, the out-of-plane motion that cannot be accounted by the supersampling algorithm in a planar measurement is minimal. Out-of-plane velocity fluctuations are small as identified by a spanwise turbulence intensity  less than 0.1 [30]. Unlike supersampling, spectra obtained using postage-stamp PIV are not subject to assumptions regarding the convection of frozen turbulence or the absence of out-of-plane data in a planar measurement, and therefore postage-stamp PIV is suitable for a much greater range of applications. Still, the agreement between the two techniques supports the veracity of the postage-stamp PIV approach.
The frequency response of the postage-stamp PIV is coupled to the size of the interrogation window. The vector spatial resolution is about 1.2 mm based simply on the size of the final interrogation window (neglecting Gaussian weighting), which corresponds to a frequency of 220 kHz at the convection velocity. This exceeds the maximum possible frequency response of the 400 kHz data rate, given Nyquist considerations. In comparison, the integral length scale of the flow at the present location is about 40 mm [29] and inertial subrange scales initiate at about 7 mm [1], indicating that the present measurements capture the range of dominant turbulence eddies in the flow. Still, this covers only a portion of the turbulence spectrum as the Kolmogorov scale can be estimated on the order of 0.01 mm, and therefore only onset of dissipation scales can be expected to be measured.
Although a smaller final interrogation window nominally will improve the spatial resolution and the frequency response associated with it, the noise floor will increase due to the fewer particle pairs in the correlation, and this counteracts the spatial benefit. Conversely, a larger interrogation window reduces the bandwidth of the measurement and restricts the frequency response below that needed to observe the initiation of the inertial subrange. The 24 × 24 pixel windows were found to be an optimal value for these competing considerations.
However, translating the interrogation window size into a frequency response limit is not straightforward due to its sensitivity to numerous details of the interrogation algorithm that couple with one another [36, 37]. Moreover, the modulation is gradual, typically a sinc function, rather than a definitive threshold (e.g. [37, 38]); therefore some loss of amplitude will occur over a range of frequencies near the cutoff. Nogueira et al [37] suggest that with 50% overlap or more between interrogation windows in multi-iteration analysis and a particle displacement not exceeding half the window size, the minimum detectable fluctuation wavelength is on the scale of the final interrogation window. This indicates that the frequency cutoff due to the spatial resolution of a vector is indeed around 220 kHz, which exceeds the point in the spectra at which the noise floor becomes dominant. Therefore, the spatial resolution of the PIV is not the dominant limitation on the frequency response for the present parameters.
An additional concern is that aliasing might erroneously shift energy from unmeasurably high frequencies to contaminate lower ranges. However, Gamba and Clemens [39] determined that the spatial averaging of the PIV interrogation window serves as an effective anti-aliasing filter, and indeed the impact on the spectrum is dominated by the spatial limitations with little energy redistribution due to aliasing. Given that the current PIV spatial resolution is not the limiting factor for the measurement frequency response, aliasing effects are expected to be negligible. This conclusion is supported by the close agreement with the supersampled data before the noise floor arises, since Scarano and Moore [23] report that aliasing is well mitigated by the supersampling algorithm.
It is important to note that peak locking can have a noticeable impact on the noise found in the velocity spectra. Figure 4 replicates the data from figure 3 that were acquired using an anti-peak-locking diffusion filter behind the camera lenses, denoted here as 'anti peak locking'. It also includes data acquired without the filter, named 'higher peak locking'. Figure 4 indicates that the noise floor in the spectra increases considerably when peak locking is more prevalent. In this case, the slope in the inertial subrange also can be seen to decrease as the noise floor is approached, which is due to additive noise from peak locking affecting turbulent motions at these high frequencies. The increased thickness of the spectral line for the peak-locked data is simply a consequence of having acquired many more bursts of data for the anti-peak-locked measurements, and hence improved statistical convergence in the latter case. The improvement in peak locking is verified using probability density functions of the vertical velocity component in figure 5. High levels of peak locking in the no-filter cases are apparent from the split peaks; conversely, hardly any peak locking is evident in data generated using the diffusion filters. Figure 5 confirms that the diffusion filters successfully remove peak locking, and that this correlates with the reduction in the noise floor in the spectra.

Figure 4. Postage-stamp PIV power spectra as in figure 3, but showing effects of peak locking and use of the pyramid correlation. The 'reduced peak locking' data corresponds to the spectra from figure 3. (a) Streamwise component; (b) vertical component.
Download figure:
Standard image High-resolution image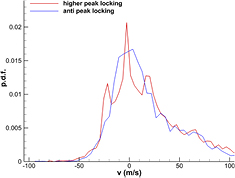
Figure 5. Probability density functions of the vertical velocity component demonstrating the reduction of peak locking through use of diffusion filters.
Download figure:
Standard image High-resolution imageA further reduction in the noise floor requires an improvement in the data processing accuracy of TR-PIV. One means to accomplish this is by utilizing multiple-frame image interrogation rather than the image-pair interrogation of conventional PIV [40–46]. The pyramid correlation of Sciacchitano et al [41] probably is the most appropriate, in which an ensemble-averaged correlation is generated based on more than the usual two image pairs to improve correlation precision. Correlations are created between adjacent time steps as well as longer intervals within a maximum range such that an optimization may be achieved between dynamic range and signal-to-noise ratio. Here, the pyramid correlation was tested with n = ±2 images and n = ±3 images and the results are included in figure 4. The comparison is made against the 'higher peak locking' data rather than the more recent data employing the diffusion filters.
For both velocity components, use of the pyramid correlation distinctly reduces the noise floor of the spectra by about one-half an order of magnitude. However, the spectra begin to roll off at much lower frequencies. This is attributable to a loss in signal bandwidth due to the use of multiple images per correlation, which corresponds to a longer period of time and therefore lower frequency response. The minimal difference between n = 2 and n = 3 likely is a result of the algorithm attempting to optimize the data processing with smaller image displacement regardless of the length of the available image sequence. Figure 4 demonstrates that the pyramid correlation is not well suited to data sets such as the present one because it is not temporally oversampled. The use of additional time steps cannot be achieved without compromising the frequency response. When frequency content is desired very close to the camera framing rate, the pyramid correlation is unhelpful.
Improvements in TR-PIV data accuracy also may be found by incorporating a noise-reduction algorithm into post-processing [39, 47, 48], but current methods are unsuitable to the present case. This matter is discussed in section 4 subsequently.
3.2. Stereoscopic data
The stereoscopic postage-stamp PIV measurements offer turbulent kinetic energy spectra rather than the 1D spectra examined in figure 3. This is important because turbulent theory typically is based upon 3D fluctuations rather than 1D. Prior to calculating these three-component spectra, figure 6 shows the spectra of the streamwise and vertical velocity components extracted from the stereo measurements and compares them to the two-component measurements from figure 3.

Figure 6. Stereoscopic postage-stamp PIV power spectra compared to the two-component spectra of figure 3. (a) Streamwise component; (b) vertical component.
Download figure:
Standard image High-resolution imageThe comparison between the two-component spectra and the stereo spectra is disappointing. Although the noise floor is similar in both cases, the power-law slope is different in the inertial subrange for the stereo data as compared to the two-component measurement, and its onset is earlier. This difference in slope in the inertial subrange is attributable to poorer spatial resolution in the stereo data because of the oblique camera images and the registration of two cameras, which increases the practical size of each interrogation window and thereby lowers the associated frequency response. For the present 24 × 24 pixel interrogation windows, the spatial extent of a single vector increases from 1.2 mm in the two-component data to 1.4 mm in the stereoscopic data, with the caveat that the true spatial resolution of a PIV vector is somewhat ambiguous owing to the repeated warping and filtering of the images [36] and by the oblique view of a finite-thickness laser sheet [49]. The larger spatial extent attenuates the signal at high frequencies in comparison to the two-component measurement. The effect appears stronger for the vertical component because the magnitude of these velocity fluctuations is greater. At low to mid-range frequencies, the agreement between the two-component and stereo data is excellent.
In figure 7, 1D spectra for each of the three components of the stereo measurement are shown, as is a single 3D spectrum derived from the total velocity fluctuation,  . Again, the stereo results are disappointing. The spectrum of the out-of-plane component, w, exhibits a considerably higher noise floor than the two in-plane components, u and v. Moreover, values are elevated at mid-range frequencies as well, which is likely inaccurate as w fluctuations should not be more intense than u or v fluctuations in this frequency band alone. The greater noise in w will, of course, propagate into the spectrum of k, and this is evident simply comparing the relative noise floors.
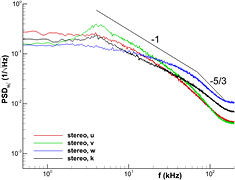
Figure 7. Power spectra of each of the three components of the stereoscopic postage-stamp PIV as well as the 3D spectrum, k.
Download figure:
Standard image High-resolution imageThe elevated noise in the w component of the stereo measurements can be attributed to the propagation of precision uncertainties from the two constituent correlations into in-plane and out-of-plane components. Classical analyses predict that for the present camera angles, the precision uncertainty in the out-of-plane component w is approximately 2–3 times greater than the in-plane components u and v [50, 51]. A recent, more sophisticated analysis is agreeable [52]. These estimates would be consistent with the noise floor differences in figure 7, for which the w floor has magnitude of 0.01 and the u and v floor is 0.004, or a ratio of 2.5. Uncertainty estimation drawn from the actual postage-stamp PIV images using the correlation statistics method [35] is given in figure 8. The uncertainty magnitudes are very similar for the two in-plane components despite mildly differing distributions, but the uncertainty in w is clearly much larger. Mean uncertainty values are 2.6 and 2.4 m s−1 respectively for u and v but 6.1 m s−1 for w, confirming that the uncertainty in the w component is consistently about 2.4 times greater than that in the u or v components. This corroborates that the elevated noise floor of the w component is simply a reflection of the expected division of precision uncertainty into the three velocity components.

Figure 8. Probability density functions of the uncertainty estimates for each component of the stereoscopic postage-stamp PIV.
Download figure:
Standard image High-resolution image
The intensity of the w spectrum remains elevated above the v spectrum in the range of 30–100 kHz by about 0.010 to 0.018, which suggests that this effect constitutes additive noise of a magnitude consistent with the noise floor. The v and w components should be most similar because both are induced by the counter-rotating vortex pair. Taken together, these observations imply that the aberrant nature of the w component is a result of increased correlation noise in the out-of-plane component of stereo PIV.
The clear presence of increased noise in the w component and its apparent distortion of the spectrum suggests that the same effect may be plausibly found even for the lower noise levels in u and v, though to a lesser extent. These effects are likely to become significant at frequencies greater than the approximately 30 kHz at which the w component begins to express deviance, but it is unclear how much greater. Therefore, despite the additional challenges in high-speed flows of discriminating noise from signal, a denoising algorithm is needed.
4. Discussion
The present work has demonstrated the efficacy of TR-PIV to measure power spectra of velocity fluctuations in high-speed flows and return useful insight into the underlying physics. Yet considerable developmental effort remains to improve the high-frequency accuracy of the measurement. Because oversampled data cannot be obtained for such high velocities, a denoising algorithm becomes necessary for high-frequency content.
Several denoising algorithms have been detailed in the literature [39, 47, 48]. Gamba and Clemens [39] requires an assumed spectral form to which the data are optimally filtered. This approach is undesirable in the present case since the data are to be used to discover the form of the spectrum. Vetel et al [47] also use an optimal filter but their assumptions concern the form of PIV errors, which again is unsatisfactory. Oxlade et al's approach [48] instead requires an accurate estimate of the noise floor, which generally demands that the noise greatly exceed the signal at a frequency about four times larger than the smallest measured turbulent event. As is evident in figures 3 and 7, the measurement does not reach a sufficiently large frequency for the noise floor to fully discriminate itself from the desired signal. At the present time, noise reduction has not been implemented due to lack of a suitable algorithm. An original approach currently is under development but this topic cannot fit within the confines of the current article.
Despite the limitations in extracting the highest frequency content from the postage-stamp PIV, the spectra produced thus far have demonstrated a capability to detect new insights into turbulent behavior. This best can be seen in figure 3 where the additional complications of multi-frame correlation or stereo angles are absent. Here, mid-range frequencies exhibit a −1 power-law dependence over an extent exceeding one full decade. Moreover, this result agrees well with the supersampled data. Even the stereoscopic data, despite the limitations described earlier, indicate some degree of −1 power-law slope in the same frequency range (figure 6). The onset of the −5/3 slope of the inertial subrange also is detected at a frequency consistent with Pope's prediction [1], but little of its extent can be accurately reproduced before high-frequency noise interferes with the measurement. This also is the frequency regime in which particle lag errors may begin to become noticeable and impact the observed slope. Mei's analysis [33] shows that at the frequency of the onset of the inertial subrange, a loss of spectral energy of only 10% is expected; this magnitude corresponds to approximately the same level as the noise in the spectra. Therefore the turn from −1 slope to −5/3 slope exceeds the estimated impact of the particle lag.
The −5/3 power-law of the inertial subrange is well established and nearly ubiquitous in fluid dynamics (e.g. [1]), though not previously detected in a high-speed flow. Conversely, the power-law with a −1 dependency at mid-range frequencies has a more enigmatic precedent. It is well established at frequencies lower than those of the inertial subrange in pressure power spectra beneath wall-bounded turbulence (e.g. Bull [53]) but its existence in the velocity field remains elusive [54–56]. Nickels et al [57] provide an excellent summary of why it is so difficult to detect in wall-bounded turbulence. In free shear flows, however, only Tchen [58] offers a theoretical prediction for the existence of a −1 power-law without resort to the presence of a wall, and to the best of the present authors' knowledge, no experimental confirmation has been documented. The significance of the −1 power-law regime is discussed for the jet-in-crossflow case in Beresh et al [15] based on supersampled spectra. Future work will seek its broader existence by exploiting postage-stamp PIV in flows for which velocity supersampling is questionable owing to increased out-of-plane motion and lower spatial frequencies [59]. This is now possible in high-speed flows with their associated higher Reynolds numbers owing to the very high sampling rate established herein using TR-PIV with a pulse-burst laser.
Finally, it is worth noting that postage-stamp PIV also has the ability to measure spectra of spatial derivatives of velocity, and in particular, vorticity. Vorticity spectra are relevant to investigating the dynamics of turbulent motion, particularly in high-Reynolds-number cases, and the development of turbulent models (e.g. [60–63]). Prior efforts to measure vorticity spectra have used cumbersome and complex multi-wire thermal anemometry probes, but in addition to a high degree of experimental difficulty, suffer from limitations in crosstalk between components, spatial resolution, and frequency response [64, 65]. Postage-stamp PIV promises great improvement on such prior disadvantages, but reduction of correlation noise in TR-PIV is a necessary step prior to effective measurement of vorticity spectra.
5. Conclusion
TR-PIV previously has been demonstrated in high-speed flows using a pulse-burst laser at repetition rates reaching 50 kHz. However, the turbulent behavior at all but the largest scales occurs at still higher frequencies. Pulse-burst PIV can be achieved at higher frequencies if the field of view is greatly reduced and lower laser pulse energy is accepted. Current technology allows image acquisition at 400 kHz for sequences exceeding 4000 frames but for a small array of only 128 × 120 pixels, giving rise to the moniker of 'postage-stamp PIV'. Despite the limited spatial extent, this approach is well-suited to measuring turbulent velocity spectra in high-speed flows because it is not subject to frozen turbulence assumptions. The postage-stamp PIV technique has been tested in a far downstream field of view for a supersonic jet exhausting into a transonic crossflow.
Measurements have been acquired using both a two-component configuration and a stereoscopic configuration. The two-component configuration provides a safe measurement without possibility of bias due to an inadequate calibration, but a successful stereo measurement offers three-component data for evaluation of the turbulent kinetic energy spectra. The two-component spectra appear valid until approximately 120 kHz at which point the noise floor emerges. Reduction of peak locking is important to minimize the noise floor. The use of multiple-frame image interrogation algorithms such as the pyramid correlation is unhelpful because the present data are not temporally oversampled; although the noise floor is reduced, the signal bandwidth is curtailed because the multiple images correspond to a longer time period. Stereoscopic spectra also exhibit a reduced signal bandwidth, but here it is a result of poorer spatial resolution because of the oblique camera images and the registration of two cameras. The out-of-plane stereo component exhibits a much higher noise level due to increased correlation noise propagating into the out-of-plane component at the present camera angles.
Despite the challenges still to be overcome in measuring spectral content at the highest frequencies, the resulting spectra reveal two regions exhibiting power-law dependence describing the turbulent decay. One is the well-known inertial subrange with a slope of −5/3, whose onset is captured near the highest measurable frequencies. The other displays a −1 power-law dependence for a decade of mid-range frequencies, which appears to have been previously unrecognized for high-speed free shear flows. These physical observations are possible only because the frequency response of the present measurement configuration exceeds nearly all previous velocimetry measurements in high speed flow.
Acknowledgments
The authors would like to thank Srinivasan Arunajatesan, Matthew Barone, Katya Casper, Edward DeMauro, Kyle Lynch, and Justin Wagner, all of Sandia, for numerous conversations regarding the data and their interpretation.
Sandia National Laboratories is a multi-mission laboratory managed and operated by National Technology and Engineering Solutions of Sandia, LLC, a wholly owned subsidiary of Honeywell International, Inc., for the US Department of Energy's National Nuclear Security Administration under contract DE-NA0003525.