

Abstract
We have studied the magnetic structure, spin reorientation behaviour and dielectric properties of polycrystalline HoMn1−xFexO3 (0.0 ⩽ x ⩽ 0.25) compounds using magnetization, neutron diffraction and dielectric measurements. These compounds crystallize predominantly in the hexagonal phase (P63cm) with a small phase fraction of the orthorhombic phase (Pnma) which increases with increase in dopant concentration and a total suppression of the hexagonal phase is observed at x = 0.25. Doping Fe at the Mn site leads to an increase in the spin reorientation temperature (TSR) from 33 K (x = 0) to 55 K (x = 0.1) while the TN remains nearly constant at 72 K. The magnetic structure of the hexagonal phase was found to be Γ4 (P63'c'm) below TN and Γ3 (P63'cm') below TSR. The magnetic ordering temperature of Ho3+ ions at 2(a) site appears to coincide with the TSR only in the case of x = 0 sample. The Ho ions at 4(b) site are found to magnetically order below 8 K. The TN of the Ho ions at both 4(b) and 2(a) sites do not appear to be affected by doping at the Mn site. The temperature variation of the Mn and Ho moments follow the Brillioun function dependence albeit with differing values of the molecular field constant λ0 and λ1. Short range magnetic order alone was found for the completely orthorhombic sample (x = 0.25). An anomalous suppression of the dielectric constant (ε) at TN is observed in the case of hexagonal samples. Further, a linear correlation between Δε (= ε(T) − ε(0)) and the square of the antiferromagnetic moment M, is observed in these compounds.
Export citation and abstract BibTeX RIS
1. Introduction
Hexagonal manganites (h-RMnO3; R = Ho–Lu, Y, Sc and In) have been explored extensively due to their strong coupling between electric, magnetic and structural degrees of freedom [1, 2].These compounds undergo a second order structural phase transition from the paraelectric centrosymmetric space group P63/mmc to the ferroelectric (FE) non-centrosymmteric space group P63
cm at TFE ∼ 1200 K [3, 4]. The polar state was shown to be characterized by buckling of Mn–O5 polyhedra along with the displacement of the R ions [5] and was later found by first principles calculation to emerge as a consequence of the asymmetric orbital hybridization between R5  –O2pz states [6, 7].The antiferromagnetic order of the Mn spins and/or the R moments sets in at much lower temperatures (Néel temperature, TN < 100 K) [8] and co-exists with the FE polarization. The difference of over ∼900 K between the magnetic and the FE ordering temperature, indicates a weak coupling between the two, leading to classifying these compounds as type-I multiferroic compounds [9].
Amongst the h-RMnO3 compounds, HoMnO3 is one of the most studied hexagonal manganite. Each Mn3+ ion in the hexagonal structure is five-fold co-ordinated with three in plane and two apical oxygen atoms, thus forming the Mn–O5 triangular bipyramid [10]. The Mn3+ ions form a natural two dimensional (2D) network of corner sharing Mn–O5 polyhedra's which are stacked alternatively along the c-axis with Ho3+ layers in between. This leads to the formation of 2D triangular lattices in the a–b plane composed of Mn3+ spins, leading to frustration in these systems. However, as compared to h-RMnO3 with a non-magnetic R3+ ion, the value of frustration parameter, f (= θCW/TN; θCW is the Curie–Weiss (C–W) temperature) [11], is low in compounds with a magnetic R ion [12] due to the presence of R-Mn interactions along the c-axis [13].The coupling between Ho and Mn moments has been confirmed earlier by both theory [14] and experiments [15–17]. More recent reports [18] point towards the coupling between the Mn spin waves and Ho crystal field excitations.
The magnetic structure of the Mn sublattice in HoMnO3 has been investigated using neutron diffraction [19, 20] and optical second harmonic generation experiments [21, 22]. The Mn3+ spins order at ∼72 K (TN) in a non-collinear 120° magnetic structure Γ4 (P63'c'm) and undergo in-plane spin reorientation at ∼33 K to Γ3 (P63'cm'). However the Mn3+ magnetic structure determination poses a symmetry problem which originates from the Mn position (x, 0, 0) with x ∼ 1/3. The Wycoff position (x, 0, 0) in the P63
cm space group occupies the mirror plane m⊥[120], which leads to equivalent intensity of the magnetic reflections generated by the pair of spin structures  /
/ and
and  /
/ [20]. Thus, a few reports also exist in literature [23, 24] where the magnetic structure below TSR has been shown to be Γ1 (P63
cm). Additionally, the presence of two crystallographic sites for Ho1 (2a) and Ho2 (4b) and the coupling between the Ho–Mn moments at TSR (∼33 K) leads to difficulty in solving the magnetic structure of these compounds [16, 19, 21, 25, 26]. At TSR, although it has been shown that Ho3+ spins order along the c-axis, contradictory reports are available in literature as to which of the two Ho3+ site orders (2a) [19] or (4b) [18, 27]. Similarly, below
[20]. Thus, a few reports also exist in literature [23, 24] where the magnetic structure below TSR has been shown to be Γ1 (P63
cm). Additionally, the presence of two crystallographic sites for Ho1 (2a) and Ho2 (4b) and the coupling between the Ho–Mn moments at TSR (∼33 K) leads to difficulty in solving the magnetic structure of these compounds [16, 19, 21, 25, 26]. At TSR, although it has been shown that Ho3+ spins order along the c-axis, contradictory reports are available in literature as to which of the two Ho3+ site orders (2a) [19] or (4b) [18, 27]. Similarly, below  at 5 K some reports suggest that the Mn3+ spins further reorient in the a-b plane to the Γ1 (P63
cm) structure [28, 29], while others suggest that there is no deviation observed from the Γ3 (P63'cm') [19]. Nandi et al [16] suggested that a mixture of Γ1 and Γ3 magnetic structures might be the true magnetic state below
at 5 K some reports suggest that the Mn3+ spins further reorient in the a-b plane to the Γ1 (P63
cm) structure [28, 29], while others suggest that there is no deviation observed from the Γ3 (P63'cm') [19]. Nandi et al [16] suggested that a mixture of Γ1 and Γ3 magnetic structures might be the true magnetic state below  . The above studies indicate inconclusive nature of studies on the magnetic structure of HoMnO3 compound.
A correlation between the FE and magnetic orders in these compounds is reflected in the anomalous suppression of the dielectric constant at TN and increase at TSR. Interestingly, for h-RMnO3 with a non magnetic R, the magnetodielectric coupling is found to be present only in the a–b plane [30], whereas with magnetic R ions it is present along the c-axis also [31]. These results point towards the crucial role of R–Mn interactions in influencing the dielectric constant. Some reports [30, 32], attribute the change in ε to be originating partly from the change in the charge excitation gap Eg and partly due to the geometrical frustration.
In our earlier study on YFe1−x
Mnx
O3 [27], we observed significant effect of Fe doping on the structural, magnetic, and dielectric properties, despite the ionic radii of Fe and Mn being similar, (∼0.58 Å) in the +3 oxidation and five co-ordination state [33]. The influence of Fe doping on these behaviours in the presence of moments on both transition metal (Mn) and rare earth (Ho) site in hexagonal manganites has been reported briefly [34]. The difference between the two ions is created due to an additional electron in the Fe3+ ion which fills the Eg orbital and increases the magnetic moment of the system and thereby influences the magnetic structure and its correlation with the dielectric anomaly in HoMn1−x
Fex
O3 (0 ⩽ x ⩽ 0.25) compounds. In this study we show that of the two sites Ho1(2a) and Ho2(4b), Ho1 is preferentially ordered at close to TSR (∼32 K for x = 0) and Ho2 is ordered at a much lower temperature (<8 K). However, we do not find any change in Mn ordering with the onset of ordering at Ho2 site, reported before [28, 29], which is in agreement with the results of representation analysis of h-RMnO3 compounds [16]. Further, we find a significant enhancement in the spin reorientation temperature, TSR with Fe doping while the change in  is minimal or absent, which appears to suggest that the occurrence of TSR is independent of Ho ordering, which is not in agreement with the theoretically proposed model [14, 35]. The increase in the value of TSR with Fe doping is also in contrast with the earlier observations of suppression of TSR with doping [36–38], magnetic field [39, 40], and external pressure [41]. The suppression of the dielectric constant below TN is further shown to scale linearly with the square of the Mn sublattice magnetization, in accordance with Landau theory.
2. Experimental details
Polycrystalline samples of HoMn1−x Fex O3 (x = 0.0–0.25) were synthesized by conventional solid state reaction route. The starting materials Ho2O3, Mn2O3 and Fe2O3 were mixed in stoichiometric ratio and calcined in air at 1250 °C for 80 hours with several intermediate grindings. The phase identification of these samples was performed by using x-ray powder diffraction recorded on a Rigaku diffractometer, using Cu Kα radiation in the angular range 10° ⩽ 2θ ⩽ 90° at room temperature. Raman experiments were performed in a backscattering geometry using an HR-800 Horiba Jobin Yvon micro Raman spectrometer having spectral resolution (∼1 cm−1) and a CCD as the detector. The instrument was calibrated with a 520 cm−1 Raman mode of Si single crystal, following which Raman spectra was recorded using a 488 nm laser excitation source. The magnetization measurements in zero field cooled and field cooled cooling conditions were carried out by using a superconducting quantum interference design (SQUID) magnetometer, in a field of 0.1 T. Low temperature dielectric measurements were carried out using a Novocontrol alpha impedence analyzer. For cooling the sample down to 5 K, a closed cycle refrigerator with He-gas exchange attachment was used. Temperature dependent capacitance data was measured in a temperature and frequency range of 1 Hz–1 MHz and 5–300 K respectively, with the heating rate maintained at 0.8 K min−1. The neutron diffraction patterns were recorded on the PD2 powder diffractometer (λ = 1.2443 Å ), Bhabha Atomic Research Centre, Mumbai at selected temperatures between 1.5 K and 300 K in the angular range 5° ⩽ 2θ ⩽ 140°. The neutron diffraction patterns were Rietveld refined using the Fullprof programme [42].
3. Results and discussion
3.1. Structure
The end compounds of the series HoMn1−x Fex O3 possess contrasting crystallographic structures. The parent compound HoMnO3, under ambient conditions, crystallizes in hexagonal phase with the space group P63 cm (SG No. 185) [19] whereas the compound HoFeO3 adopts a GdFeO3 type distorted perovskite structure with the space group Pnma (SG No. 62) [43]. The coordination chemistry of the cations Ho3+, Mn3+ and Fe3+ in both the structural phases are significantly different. In the case of hexagonal compounds (P63 cm) the transition metal occupies the Wyckoff position (6c) and is five-fold coordinated by the oxygen anions. The Mn/Fe–O5 trigonal bipyramids are arranged in a layered structure forming a two dimensional Mn/Fe–O–Mn/Fe array in the a–b plane. These layers are separated by Ho3+ ions which are seven fold coordinated and occupy the (4b) and (2a) Wycoff positions. On the other hand in the orthorhombic perovskite phase the transition metal cation is six fold coordinated by the oxygen ions in an octahedral geometry whereas the rare earth ions are twelve coordinated. In this case the Mn/Fe–O–Mn/Fe interactions exist both along the a–b and the a–c axis thereby leading to both inter and intra layer exchange interactions. A gradual transition from the hexagonal to the orthorhombic phase is observed as the dopant concentration is increased.
Figure 1 shows the (a) x-ray and (b) neutron diffraction patterns at 300 K for three samples x = 0.01, 0.10 and 0.25. A single phase hexagonal model (P63 cm) was found to fit the data of the parent compound h-HoMnO3, whose lattice parameter and volume were found to be in agreement with the earlier reports [44]. For higher doping concentrations (x = 0.05 and 0.10), Bragg reflections (112) and (031) corresponding to the orthorhombic phase were observed. Therefore, we chose a two phase model with both hexagonal and orthorhombic phases for the refinement of the structure in these samples. The results of the refinement at 300 K are summarized in table 1. With increase in the dopant concentration to 25% a complete transformation to the orthorhombic phase was observed. Figure 2 shows the increase in the concentration of the orthorhombic phase as a function of dopant concentration (x), obtained from the Rietveld analysis of the neutron diffraction data. As compared to other trivalent dopants on the Mn site such as Cr3+ [38] or Co3+ [45], Fe3+ maintains the stability of the hexagonal structure up to a higher degree of dopant concentration. This is probably due to the similar ionic sizes of the Mn3+ and the Fe3+ ions in the five coordination (0.58 Å) and the six-fold coordination states (0.645 Å). However, as compared to YFe1−x Mnx O3 [32], the transformation to the orthorhombic phase was found to be much faster.
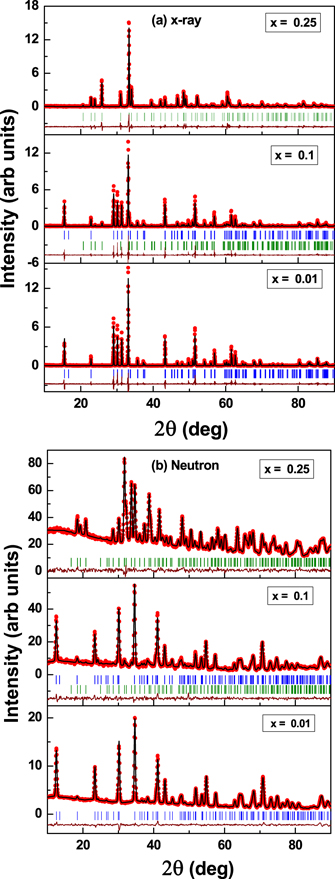
Figure 1. The (a) x-ray and (b) neutron diffraction patterns of x = 0.01, 0.1 and 0.25 samples at 300 K. The blue and the green ticks represent the Bragg reflections corresponding to the hexagonal and the orthorhombic phases respectively.
Download figure:
Standard image High-resolution imageTable 1. Lattice parameters, atomic positions, Mn–O bond lengths and Mn–O–Mn bond angles as obtained from Rietveld refinement of the neutron diffraction data of HoMn1−x Fex O3 (0 ⩽ x ⩽ 0.25) compounds at 300 K. The atomic sites are Ho1 (2a) (0, 0, z); Ho2 (4b) (1/3, 2/3, z); Mn/Fe (6c) (x, 0, z); O1 (6c) (x, 0, z); O2 (6c) (x, 0, z); O3 (2a) (0, 0, z); O4 (4b) (1/3, 2/3, z) in the P63 cm space group and Ho (4c) (x, 1/4, z); Mn/Fe (4b) (0, 0, 0.5); O1 (4c) (x, 1/4, z); O2(x, y, z) in the Pnma space group.
| HoMnO3 | HoMn0.99Fe0.01O3 | HoMn0.95Fe0.05O3 | HoMn0.9Fe0.1O3 | HoMn0.75Fe0.25O3 | |||
|---|---|---|---|---|---|---|---|
| P63 cm | P63 cm | Pnma | P63 cm | Pnma | Pnma | ||
| a (Å) | 6.136 (2) | 6.133(1) | 6.137(1) | 5.81(1) | 6.142(2) | 5.755(2) | 5.753 (3) |
| b (Å) | ... | ... | ... | 7.05(2) | ... | 7.419(4) | 7.428 (4) |
| c (Å) | 11.399 (1) | 11.399(4) | 11.412(5) | 5.34(1) | 11.432(6) | 5.255(3) | 5.258 (3) |
| V (Å3) | 371.81 (5) | 371.35(2) | 372.26(2) | 219.3(7) | 373.59(2) | 224.4(2) | 224.73( 2) |
| Ho1 | |||||||
| x | --- | --- | --- | 0.10(1) | --- | 0.080(3) | 0.8006(3) |
| z | 0.276(2) | 0.283(1) | 0.278(3) | −0.02(1) | 0.285(2) | −0.010(4) | −0.0167(4) |
| Biso (Å2) | 0.25(2) | 0.41(6) | 0.4(1) | 0.5 | 0.66(9) | 0.5 | 0.29(2) |
| Ho2 | |||||||
| z | 0.234(2) | 0.239(1) | 0.234(3) | ... | 0.240(2) | ... | ... |
| Biso (Å2) | 0.59(2) | 0.61(4) | 0.3(1) | ... | 0.62(6) | ... | ... |
| Mn/Fe | |||||||
| x | 0.344(2) | 0.335(2) | 0.322(2) | ... | 0.326(3) | ... | ... |
| Mn occupancy | 0.5 | 0.495 | 0.475 | 0.475 | 0.45 | 0.45 | 0.375 |
| Fe occupancy | 0 | 0.005 | 0.025 | 0.025 | 0.05 | 0.05 | 0.125 |
| Biso (Å2) | 0.49(5) | 0.44(5) | 0.4(1) | 0.5 | 0.5(1) | 0.5 | 0.8(6) |
| O1 | |||||||
| x | 0.314(2) | 0.3099(8) | 0.305(1) | 0.46(2) | 0.305(1) | 0.459(4) | 0.4625(4) |
| z | 0.161(3) | 0.1699(9) | 0.161(3) | 0.10(2) | 0.167(2) | 0.113(4) | 0.1096(5) |
| Biso (Å2) | 0.55(7) | 0.42(2) | 0.73(5) | 0.5 | 0.45(3) | 0.5 | 0.67(1) |
| O2 | |||||||
| x | 0.643(3) | 0.6411(8) | 0.642(2) | 0.36(1) | 0.644(1) | 0.335(3) | 0.3243(3) |
| y | ... | ... | ... | −0.01(1) | ... | 0.053(2) | 0.0551(2) |
| z | 0.339(3) | 0.3428(9) | 0.342(3) | −0.30(1) | 0.341(2) | −0.306(4) | −0.3003(4) |
| Biso (Å2) | 0.55(7) | 0.42(2) | 0.73(5) | 0.5 | 0.45(3) | 0.5 | 0.62(2) |
| O3 | |||||||
| z | 0.481(3) | 0.480(1) | 0.481(4) | ... | 0.485(2) | ... | ... |
| Biso (Å2) | 0.45(6) | 0.64(3) | 0.32(6) | ... | 0.73(5) | ... | ... |
| O4 | |||||||
| z | 0.015(2) | 0.022(1) | 0.017(3) | ... | 0.023(2) | ... | ... |
| Biso (Å2) | 0.45(6) | 0.64(3) | 0.32(6) | ... | 0.73(5) | ... | ... |
| Mn–O1 (Å) | 1.8284 (2) | 1.9301(2) | 1.7935 (1) | ... | 1.9283 (2) | ... | ... |
| Mn–O2 (Å) | 1.8499 (2) | 1.8088(2) | 1.9333 (2) | ... | 1.8149 (2) | ... | ... |
| Mn–O3 (Å) | 2.0603 (1) | 2.0555(1) | 2.0688 (1) | ... | 2.0539 (1) | ... | ... |
| Mn–O4 (Å) | 2.0526 (1) | 2.0606(1) | 2.0504 (1) | ... | 2.0662 (1) | ... | ... |
| Mn–O3–Mn (0) | 119.094 (4) | 118.932 (4) | 117.812 (5) | ... | 119.388 (5) | ... | ... |
| Mn–O4–Mn (0) | 119.186 (4) | 118.486 (4) | 119.551 (5) | ... | 118.272 (5) | ... | ... |
| Mn–O1 (Å) | ... | ... | 1.87(5) | ... | 1.9663(9) | 1.9557(1) | |
| Mn–O21 (Å) | ... | ... | 2.37(9) | ... | 2.2174(9) | 2.1806(3) | |
| Mn–O22 (Å) | ... | ... | 1.75(8) | ... | 1.9143(8) | 1.9200 (1) | |
| χ2 | 0.477 | 5.62 | 5.32 | 3.37 | 2.88 | ||
| RBragg (%) | 6.13 | 4.98 | 5.61 | 3.80 | 5.46 | ||
| Phase (%) | 100 | 100 | 95 | 5 | 92 | 8 | 100 |
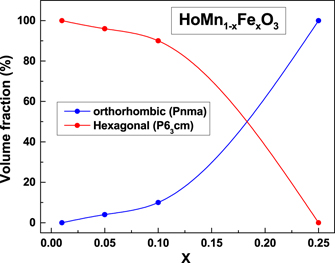
Figure 2. Variation of volume fraction of orthorhombic and hexagonal phases of HoMn1−x Fex O3 with Fe content (x), as obtained from Rietveld analysis of the neutron diffraction data.
Download figure:
Standard image High-resolution imageFigure 3 shows the Raman spectra of all the doped samples recorded in the range 85 cm−1 ⩽  ⩽ 750 cm−1 at T = 300 K. The difference in phonon modes observed for x ⩽ 0.1 compounds, and x = 0.25 compound corroborates the complete structural transition of the hexagonal phase to the orthorhombic phase in case of the x = 0.25 compound observed from the analysis of the neutron diffraction pattern. The identification of the Raman active modes in the case of hexagonal and orthorhombic compounds was carried out in accordance with references [46, 47] respectively. We could not identify any peaks corresponding to the modes of the orthorhombic phase in the compounds with x ⩽ 0.1, due to very small orthorhomobic phase fraction in these compounds as obtained from neutron diffraction.
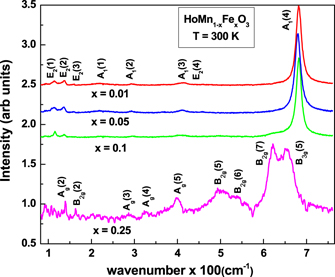
Figure 3. Raman spectrum of the doped compounds (x = 0.01, 0.05, 0.1 and 0.25) recorded at T = 300 K.
Download figure:
Standard image High-resolution imageFigure 4(a) shows the variation of lattice parameters and the volume of the hexagonal phase as a function of Fe content. Both the lattice parameters a and c were found to increase linearly with increase in dopant concentration, which is in contrast to the cases of YbMn1−x
Fex
O3 [48] and LuMn1−x
Fex
O3 [49] where the a axis decreases and the c axis increases with increase in Fe concentration. A similar increasing trend of the a and c axis is observed for YMn1−x
Fex
O3 [32] until the development of the orthorhombic phase from where the a and c lattice parameters start decreasing. The relative change in the c-axis (0.3%) was found to be larger than the change in the a-axis (0.1%), thereby increasing the c/a ratio. An associated change [50] in the TN with c/a was not observed due to a only a small relative change (0.01) with increase in dopant concentration. Due to the absence of Jahn–Teller effect in the hexagonal system, these changes must be associated with orbital effects induced due to doping of Fe3+ions. Figure 4(b) shows the temperature evolution of volume for x = 0.01 sample where a monotonous increase is observed with increasing temperature. The solid line shows fit to the volume via Debye model, using Grüneisen approximation [51]. In this approximation the temperature dependence of volume is given as V(T) = [γU(T)/B0 + V0], where γ, B0 and V0 are Grüneisen parameter, bulk modulus and volume at T = 0 K. In the Debye model, internal energy U(T) is given by  , where N is the number of atoms in the unit cell, kB is the Boltzmann constant, and θD is the Debye temperature. It is clearly seen from the fit that the volume does not exhibit any anomaly in the vicinity of either TN or TSR. In the inset to figure 4(b) we have shown the temperature variation (7 K ⩽ T ⩽ 150 K) of specific heat measured for the x = 0.01 sample in fields of 0 and 2 T. Even though the volume does not exhibit a significant anomaly at either TN or TSR, a clear lambda type anomaly is observed in the specific heat data at TN, in corroboration with the dielectric data. This clearly indicates that the magnetic ordering couples with the lattice though the changes are not apparent in the temperature evolution of volume. However, in contrast to the report on YMnO3 [52], no broadening of the anomaly at TN was observed in C(T) in an applied field of 2 T.
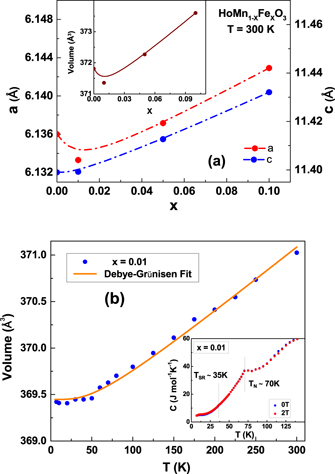
Figure 4. (a) Variation of lattice parameters and volume as a function of Fe content (b) Temperature evolution of volume for x = 0.01 sample. The solid line shows the fit to the Debye Grüneisen equation. Inset to (b) shows the specific heat measured as a function of temperature with anomalies at the magnetic ordering temperatures.
Download figure:
Standard image High-resolution image3.2. Magnetization
In figure 5 we show the temperature dependence of magnetization for compounds of the series HoMn1−x
Fex
O3 (0.01 ⩽ x ⩽ 0.25). Unlike in Fe doped YMnO3 compounds [32], the magnetization curves do not reveal the presence of any anomaly at the TN or the TSR, and appear to be paramagnetic down to the lowest temperature. This behaviour arises due to the large paramagnetic moment of the Ho3+ ions (=10.6 μB) which masks the magnetic ordering of the Mn/Fe ions. The paramagnetic susceptibility data was fitted to the (C–W) law, given by χ = C/(T − θCW), where C and θCW are the Curie constant and C–W temperature respectively. The susceptibility data was found to follow the C–W law in the temperature range (∼140–300 K) for x = 0.01–0.10 hexagonal samples as shown in the inset to figure 5. The susceptibility data for x = 0.25 was found to deviate from the C–W behaviour at ∼30 K, which is associated with the development of short range order observed in the neutron diffraction pattern in this compound. Using the Curie constant values, we calculated the value of effective paramagnetic moment (μeff) by using the equation,  . The theoretical value of the effective paramagnetic moment can be calculated, by assuming Mn, Fe and Ho in the trivalent state, by using the expression
  , where μeff for Mn3+ (S = 2), Fe3+ (S = 5/2) and Ho3+ are 4.89 μB, 5.9 μB and 10.6 μB respectively. The experimental and the theoretical value of μeff for x = (0.01, 0.1, 0.25) were found to be (11.26, 11.21, 11.11) μB and (11.68, 11.70, 11.79) μB respectively. We note that the experimentally obtained moment values are in agreement with the calculated values for trivalent state of Ho, Fe and Mn.
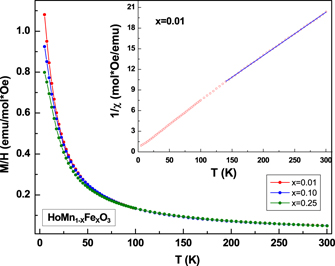
Figure 5. The temperature variation of Magnetization (M) for HoMn1−x Fex O3. Inset shows the inverse of susceptibility as a function of temperature and C–W fit (solid line) for the x = 0.01 sample.
Download figure:
Standard image High-resolution imageFigure 6 shows magnetization measured as a function of applied external field at 5 K. The absence of hysteresis in M(H) curves indicates the absence of ferromagnetic component, however a small hysteresis curve is observed for x = 0.25. A decrease in the value of magnetic moment at 5 T with increase in the Fe ion concentration is observed. In inset (a) to figure 6 we show variation of magnetization with temperature measured up to 1.5 K for x = 0 sample. A clear decrease in the value M at ∼4 K marks the ordering of Ho ions in an antiferromagnetic configuration, discussed later. In inset (b) to figure 6 we show M(H) measured for x = 0 sample at 1.5 K. In contrast to the measurements on single crystals [26], we did not observe a jump in value of magnetization at 1 T or 2.5 T, however the value of magnetization was found to saturate at ∼5 T to 8 μB which is nearly the value of magnetic moment of the Ho3+ ions indicating a possible field induced reorientation of Ho spins.
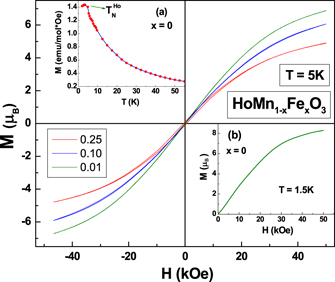
Figure 6. The variation of magnetization as a function of magnetic field at 5 K for HoMn1−x Fex O3 compounds. Inset (a) and (b) show the magnetization as a function of temperature and field (at 1.5 K) for x = 0 (parent) compound.
Download figure:
Standard image High-resolution image3.3. Neutron diffraction
A section of the neutron diffraction pattern of HoMnO3 at few selected temperatures is shown in figure 7. Similar magnetic ordering associated with the hexagonal phase was observed in the samples, x = 0.01, 0.05, 0.10, as well. The appearance of the superlattice reflection (011) at 65 K, below the TN (∼72 K) of the sample, originates due a 2D ordering of the Mn moments in the a-b plane. On further lowering of temperature to 35 K the (011) reflection loses intensity while the superlattice reflection (010) gains intensity. A significant increase in the intensity of the reflection (102) is also observed at this juncture. The change in the relative intensities of the (011) and (010) reflection indicates the 90° reorientation of Mn3+ spins in the a–b plane and change in the magnetic symmetry of the compound. Along with the reorientation of Mn spins, moment on the Ho1(2a) sites, aligned along the c-axis, is also observed at 35 K. Below T = 15 K, the (011) reflection again gains intensity and an additional superlattice reflection (201) is observed in the raw data. These new peaks correspond to the ordering of the Ho2 ions located at the (4b) site, oriented parallel to the c-axis. These observations are corroborated by the modelling of the magnetic structure as described below.
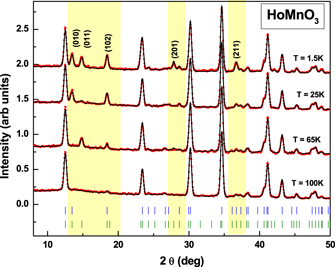
Figure 7. The neutron diffraction patterns for the parent compound at various temperatures. The portion highlighted in yellow shows the prominent magnetic reflections.
Download figure:
Standard image High-resolution imageFollowing the classification given by Bertaut [53–55], there are six possible magnetic configurations (Γ1–Γ6) for the space group P63
cm with the propagation vector  for both the Mn atom, which occupies the (6c) site, and the Ho1 and Ho2 atoms, which occupy the (2a) and 4b sites, respectively. Description of the representation analysis for h-RMnO3 can be found in ref [54]. Among these configurations for the Mn ion, (Γ1, Γ3) and (Γ2, Γ4) are homometric and cannot be distinguished using neutron diffraction. But, as was discussed earlier, the magnetic ordering of h-HoMnO3 has been established, using various techniques [19–22], below TN as Γ4 (P63'c'm) and below TSR as Γ3 (P63'cm') along with the ordering of Ho3+ spins, located at the (2a) site, parallel to the c-axis. Thus we carried out the refinement in accordance with the magnetic structure reported in the literature [19] and found to be in agreement with it. The basis vectors corresponding to the various irreducible representations were obtained using SARAH programme [56].
In figure 8 we show the magnetic structure of the parent compound HoMnO3 both below and above TSR, obtained using Rietveld refinement. Here we point out that equivalent fit to the data of 2 K could be obtained using (i) P63 cm (Γ1) ordering of the Mn3+ ions along with AFM ordering of the Ho2 ions ((4b) position) [55] and (ii) P63'cm'(Γ3) ordering of Mn3+ ions with ferromagnetic coupling of Ho1 and Ho2 within the planes, and which are coupled antiferromagnetically between the planes, as shown from polarimetry studies [19]. We have chosen the latter model as the ground state magnetic structure for reasons discussed later. The values of the Mn site moment were found to be ∼3 μB which is lower than 4 μB expected for fully ordered Mn3+ spins. The lower value of Mn3+ moment originates from the effect of frustration in layered systems. The values obtained in the case of Ho at both the sites are also lower than the expected value of 10 μB. The Brillioun function dependence indicates that the temperature has to be lowered further to achieve the saturation.
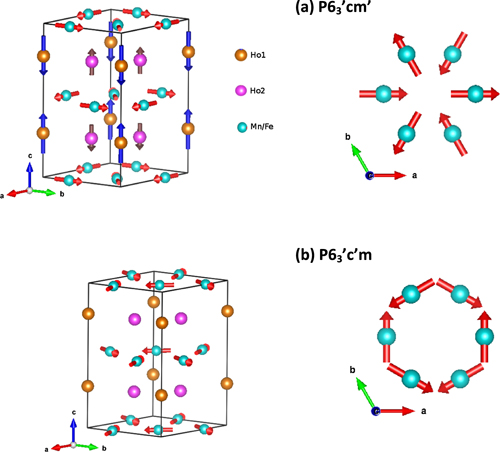
Figure 8. Magnetic structure of HoMnO3 (a) at T = 1.5 K (<TSR) showing the  ordering of Mn ions and intra-plane ferromagnetic layers of Ho1 and Ho2 coupled anti-ferromagnetically inter-plane (b) at T = 50 K (>TSR) showing the
  ordering of Mn ions.
Download figure:
Standard image High-resolution imageFigures 9(a) and 9(b) show the temperature evolution of magnetic moments for the x = 0.01 and x = 0.1 compounds respectively. At the TSR, along with the reorientation of Mn spins, a simultaneous increase in the magnetic moment of the Ho1 ions located at the (2a) site is observed. This observation falls in accordance with the symmetry consideration of the P63'c'm (Γ4) and P63'cm' (Γ3) ordering of the Mn ions as the former does not allow moments on the Ho1 site while the latter does [19]. An inconsistency exists in literature regarding which Ho site orders at TSR, (2a) [18] or (4b) [19, 27]. In powder neutron diffraction pattern, ordering of the Ho ions at both the (2a) and the (4b) sites, parallel to the c-axis, contributes to the same superlattice Bragg reflections (011) and (201). We obtained equivalent fits of the neutron data on considering Ho moments on the (2a) or the (4b) sites, however a final model was chosen based on the results reported by neutron polarimetry study [19].
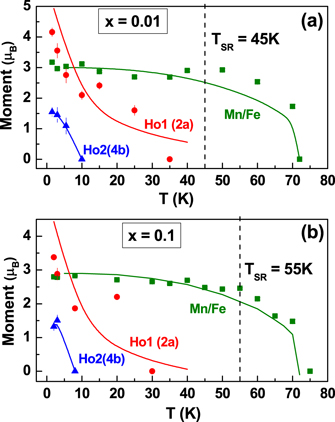
Figure 9. Thermal evolution of the magnetic moments at Mn, Ho1(2b) and Ho2(4b) sites for (a) x = 0.01 and (b) x = 0.1 compounds obtained from neutron diffraction measurements. The solid line corresponds to the fit obtained from molecular field calculations.
Download figure:
Standard image High-resolution imageThe ordering of the Ho1 sites may be induced by the reorientation of Mn spins in the a–b plane via the anisotropic superexchange between the 3d and 4f ions [16, 57]. With further decrease in temperature moments at Ho2 sites order at 10 K, coupled antiferromagnetically inter-plane with Ho1 ions, and ferromagnetically in intra-plane. In contrast to YMn1−x Fex O3 [32], we did not observe a mixed phase of Γ3 and Γ4 structures at any temperature. Following the molecular field analysis by Fabreges et al [27] for the case of YbMnO3, we find the temperature variation of variation of moment of the Mn site could be described by the Brillioun function,

and the variation of the Ho moment as,

where the molecular field constant λ0 and λ1 represent the Mn/Fe–Mn/Fe and Ho–Mn/Fe exchange, respectively. A fit using these expressions to the thermal evolution of magnetic moments is shown in figures 9(a) and (b). The variation of the Mn moment is well described by the Brilliuon function with the value of λ0 = 56.5 T μB −1. This value is large as compared to the values of 10.2 T μB −1 [32] and 19 T μB −1 [27] obtained for the cases of YMn1−x Fex O3 and YbMn1−x Fex O3. The variation of the Ho1 (2a) moment is described well by the above expression with λ1 = 4 T μB −1. However, its variation cannot be extrapolated, beyond ∼35 K (TSR), to the TN. Unlike in the case of YbMnO3, where the moment is predominantly on Yb2 (4b) site, we observe moment on Ho1 (2a) site. The temperature variation of the moments on Ho1 and Ho2 sites are similar to the observations of Brown and Chatterji [19].
As against the increase of magnetic moment, expected with increase in the concentration of Fe3+ ions in the system, a lower value moment was observed in the doped samples, as shown in table 2. Further we did not find any long range magnetic ordering in the fully orthorhombic x = 0.25 sample down to the temperature of 1.5 K. However, a large broad hump is observed at the position where the superlattice reflection of G-type AFM ordering would have appeared. Figure 10 shows the diffraction pattern at 2 K and 300 K for x = 0.25. The increase in intensity at lower angles in the neutron diffraction data starts to develop from 35 K. The 1/χ(T) behaviour too is found to deviate from linearity at about this temperature as shown in the inset to figure 10. This suggests a magnetic short range ordering in this compound. The scattering intensity due a 3D short range spin–spin correlation can be expressed by a Lorentzian function as [58],

Where A is a proportionality constant, k is the inverse of the 3D magnetic correlation length and QC is the length of the scattering vector at which the peak of I(Q) occurs. A fit using this expression, to the background subtracted curve, is found to give an unphysical correlation length of 1 Å. However for higher doping concentration, x ⩾ 0.4, a magnetic order of the GXGZ type (Γ1 + Γ4) was found to set in the orthorhombic phase, whose results are reported in another study [59].
Table 2. The values of magnetic moments obtained from the Rietveld refinement of neutron diffraction pattern at 2 K for the compounds HoMn1−x Fex O3 (0 ⩽ x ⩽ 0.25).
| HoMnO3 | HoMn0.99Fe0.01O3 | HoMn0.95Fe0.05O3 | HoMn0.9Fe0.1O3 | |
|---|---|---|---|---|
| Moment (μB) | ||||
| Mn/Fe | 3.01 (5) | 3.17 (3) | 2.97 (3) | 2.79 (3) |
| Ho1 (2a) | 4.2 (2) | 4.1 (1) | 3.8 (2) | 3.4 (1) |
| Ho2 (4b) | 1.3 (1) | 1.5 (1) | 1.1 (1) | 1.3 (1) |
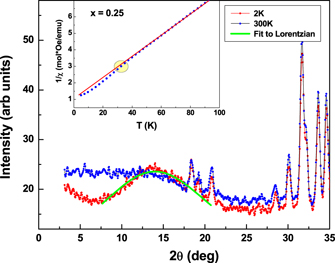
Figure 10. Neutron diffraction pattern for x = 0.25 sample at 2 K and 300 K. The green line shows fit to the Lorentzian for obtaining short range correlation length. Inset shows deviation of inverse susceptibility data from C–W behavior for x = 0.25 sample.
Download figure:
Standard image High-resolution imageFigure 11 shows a section of the diffraction pattern at selected temperatures for x = 0.1 sample. The existence of the (010) reflection characteristic of the Γ3 phase is observed up to 55 K. Above this temperature the (011) reflection gains in intensity while the (010) is suppressed, indicating a transition from Γ3 to Γ4 phase at 55 K in x = 0.1 sample. A clear signature of increase in TSR is observed with doping of Fe, as shown in figure 12. The origin of TSR in hexagonal manganites has been attributed primarily to the onset of Ho ordering and therefore to the Ho–Mn interaction [35]. Earlier results have also shown that perturbations like external pressure [41] and magnetic field [39, 40] lead to lowering of TSR. However TSR can either be increased or decreased with doping different ions such as Ga [60], Er [36], Y [37] and Cr [38]. In earlier works [41, 61], the variation of TSR with pressure has been correlated with the suppression of the c-axis. In our case, the c-axis expands for the doped compounds. This weakens the interlayer coupling between Ho and Mn and therefore, plausibly shifts the TSR to higher temperatures in doped compounds. In figure 12, the variation of the TSR,  ,
,  with composition is summarized. In the hexagonal rich end while the TN of Mn and Ho do not vary within the error bar, the TSR clearly increases with composition.
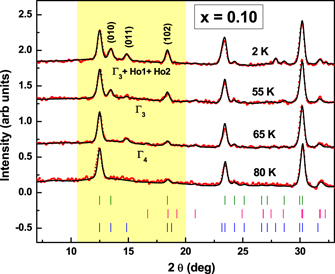
Figure 11. Temperature evolution of the neutron diffraction pattern recorded for the x = 0.10 sample. The highlighted portion shows the evolution of magnetic peaks.
Download figure:
Standard image High-resolution image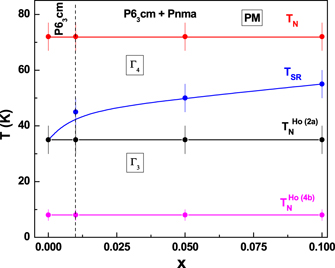
Figure 12. The variation of spin reorientation temperature TSR and TN as a function of composition (x).
Download figure:
Standard image High-resolution image3.4. Dielectric
Figure 13 shows the temperature variation of dielectric constant (ε) (for clarity only 10 kHz is shown, behaviour is same at all other frequencies). A distinct fall in the value of ε' is observed for the doped compounds x = 0.05 and 0.10 at their Néel temperature (TN), which is similar to that observed in the parent compound h-HoMnO3 [62]. In contrast to the dielectric measurements on single crystals of HoMnO3 [41, 63], we did not observe a sharp anomaly at the spin reorientation temperature of the compounds, where the Mn3+ spins reorient in-plane by π/2, from the P63'c'm (Γ4) to the P63'cm'(Γ3) magnetic structure. However a small hump in the dielectric data was found to be present at the TSR for x = 0.05 sample. The jump in the dielectric constant at TSR has been ascribed to the intermediate magnetic phase between Γ4 and Γ3 type of orderings, P63', whose physical properties are susceptible to external perturbation [31, 64].However due to symmetry constraints [65], a direct coupling between the magnetic moments and the electric polarization is allowed only when the Mn moments tilt out of plane with a component along the c-axis [63]. In our neutron diffraction experiments, although we observe the in-plane rotation of the Mn spins, we do not find any signature of magnetic moment along the c-axis. This might be possibly due to a very small value (< 0.1 μB) of moment along the c-axis which is beyond the resolution of our Neutron diffraction instrument.
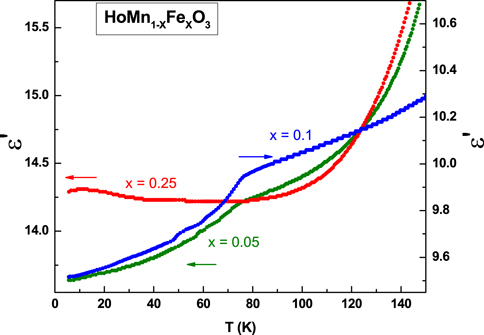
Figure 13. Temperature variation of the dielectric constant for x = 0.05, 0.1 and 0.25 compounds.
Download figure:
Standard image High-resolution imageIn the absence of external electric and magnetic fields, the anomaly in dielectric constant at TN is most likely driven by isostructural phase transitions associated with the displacement of the Mn ions present in system. Indeed such a case is observed in YMnO3 and LuMnO3 which exhibit exceptionally large motion of the Mn ion from its x ∼ 1/3 position at TN [66, 67]. An alternative explanation for the observed variation of ε based on the 'pinning' between the domain walls of the AFM and the FE phases also exists in literature [64, 68].
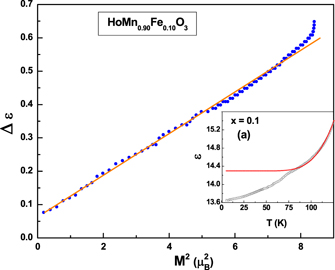
The lattice contribution to the dielectric constant can be modelled by using the expression  , where ε0 is the value of dielectric constant at 0 K, ω0 is the fitted frequency of the polar mode and the C is a constant [69, 70]. Inset to figure 14 shows the fit carried out for the x = 0.1 sample in the vicinity of TN. By subtracting the lattice contribution from the experimental data we obtain Δε which represents the magnetic contribution to the dielectric constant below TN. The expansion of free energy from the Landau's theory [69], can be given as,

Where E, H, P and L are the electric field, magnetic field, polarization and anti-ferromagnetic vector, respectively. Using this relation, it has been shown in the case of YMn1−x Fex O3 [32] that the dielectric permittivity below TN varies linearly with the square of the anti-ferromagnetic vector L, which is equal to the magnetic moment (M) below TN. Figure 14 shows a plot of Δε(ε(T) − ε(0)) vs M2, where the values of M at various temperatures have been obtained by extrapolating the fitted curve shown in figure 9. A linear correlation between the two order parameters shows the coupling between lattice and magnetism in the frustrated antiferromagnetic system of HoMn1−x Fex O3 in absence of any external field.
Figure 14. Variation of Δε (ε(T) − ε(0)) as a function of M2(T) for HoMn0.9Fe0.1O3. Inset shows the temperature evolution of the dielectric constant fitted to the theoretically generated lattice contribution.
Download figure:
Standard image High-resolution image
4. Conclusion
We have studied the structural, magnetic and dielectric properties of Fe doped h-HoMnO3 compounds using magnetization, neutron diffraction and dielectric experiments. These compounds crystallize predominantly in the hexagonal structure (P63 cm) with a small phase fraction of the orthorhombic phase (Pnma). The orthorhombic phase increases with increase in the dopant concentration and completely suppresses the hexagonal phase at x = 0.25. Doping Fe at the Mn site does not affect the TN (in the hexagonal phase rich end) but leads to increase in TSR. The magnetic structure of the hexagonal phase was found to be, by using neutron diffraction, Γ4 (P63'c'm) below TN and Γ3 (P63'cm') below TSR. Below the TSR, Ho1 (2a) sites are found to order for HoMnO3. However, in the case of the doped compounds, though the TSR shifts to higher temperatures, the Ho1 ordering temperature remains the same suggesting an weakening of the Ho–Mn interaction as a result of expansion of c-axis. Below 10 K, Ho2 (4b) sites also are found to order without further influencing the Mn sublattice from their Γ3 structure. For the orthorhombic sample, x = 0.25, a diffused scattering peak was observed indicating the presence of short range magnetic correlations in the compound. In hexagonal samples, the anomalous suppression of ε below TN, Δε (ε(T) − ε(0)), was found to be linearly correlated with the square of the magnetic moment M, obtained from neutron diffraction data.
Acknowledgments
The authors would like to acknowledge Dr Vasant Sathe of the UGC-DAE Consortium for Scientific Research, Indore, for Raman measurements and useful discussion.
Data availability statement
The data that support the findings of this study are available upon reasonable request from the authors.