

Abstract
The resistivity of amorphous Fe90Sc10 and Co90Sc10 alloys can be described well in terms of a simple model based on the wave character of electrons and their associated tunnelling over the temperature ranges ~1.9 K to 135 K and ~1.9 K to 12 K respectively. The extended range of agreement between experiment and theory for amorphous Fe90Sc10 is linked with its relatively small mean free path of  = 0.32 nm, thus allowing electron waves to tunnel between clusters. On the other hand the restricted region of tunnelling of electron waves for amorphous Co90Sc10 alloys is linked with its relatively large mean free path of
  = 0.48 nm which restricts the ability for tunnelling between clusters while enabling electron waves to tunnel between different regions with a cluster.
Export citation and abstract BibTeX RIS
1. Introduction
In the semi classical model [1, 2] the sign of the slope, dρ(T)/dT, of the electrical resistivity, of metals as a function of temperature is always positive. Free electrons in both the Grüneisen and Ziman models [1, 2] are considered as particles with the increase of the resistivity with temperature occurring as a consequence of electron–phonon interactions. In this context, it is worth noting that for alloys in which electrons have a mean free path, λ, of a few angstroms, the wave character of electrons must be taken into account. In the case of amorphous Sc75Fe25 for which  ~ 1–2 Å, it has been demonstrated that considering the wave nature of the conduction electrons delivers a different temperature dependence of the electrical resistivity in comparison to the classic Grüneisen model [3]. As discussed in section 3, ρ(T) for both amorphous Fe90Sc10 and Co90Sc10 is found to increase quadratically with temperature over restricted temperature regions, whereas in contrast, the Grüneisen model, ρ(T) is associated with a T3/2 dependence for temperatures below the Debye temperature, or a T dependence for temperatures above the Debye temperature. Furthermore, it has been shown that to describe ρ(T), it is necessary that the wave character of free electrons and quantum tunnelling processes be combined [3].
Here we investigate the temperature dependence of the resistivity of transition metal-based amorphous Fe90Sc10 and Co90Sc10 alloys using the wave character model of free electrons mentioned above [3]. In comparison to the earlier study of a similar class of material (amorphous Sc75Fe25 alloy for which electrons have a mean free path of a few angstroms), the aim of the present contribution is to investigate and establish which are the main factors that influence the temperature dependence of the resistivity, ρ(T), of amorphous alloys in general. Amorphous Fe90Sc10 and Co90Sc10 alloys have been chosen for the following reasons. (a) Detailed information about the atomic arrangement in these alloys has been determined by Mössbauer effect spectroscopy [4, 5], x-ray diffraction [6] and the present electron microscopy studies. (b) The atomic arrangements in amorphous Fe90Sc10 and Co90Sc10 alloys are similar, consisting of distorted bcc [6]. (c) Despite the similarity of the atomic structures, the residual resistivities differ, with ρ0 ~ 135 µΩ · cm for amorphous Fe90Sc10 being over 50% larger than ρ0 ~ 80 µΩ · cm for amorphous Co90Sc10. (d) It has been demonstrated [5], that amorphous Fe90Sc10 alloys comprise primarily magnetic clusters with an average size of about 125 atoms. (e) It will be shown that each cluster consists of two main regions—atoms at the centre of disordered bcc clusters (Region I) and those close to the surface of the clusters (Region II). As considered in section 4, in amorphous Fe90Sc10 and amorphous Co90Sc10, the free electrons are captured inside distorted bcc clusters. The free electrons, however, are able to tunnel from one cluster to another.
As described in section 3, the temperature dependence of the resistivity, ρ(T), of amorphous alloys rich in transition metals combined with early transition metals such as Zr or Sc, is determined by the wave nature of free electrons and tunnelling. A related aspect is to consider the effect of the magnetic state of the amorphous alloys on ρ(T). As discussed below, the influence of the magnetic state of these amorphous systems on the behaviour of ρ(T) is negligible. For example, Mössbauer measurements show that amorphous Fe90Zr10 and Fe90Sc10 have similar distributions of quadrupole interactions [4, 7, 8] as well as similar x-ray pair distribution functions, G(r) [9, 10], thus indicating that the atomic structure in both alloys is equivalent. In addition, despite the different magnetic states and transitions temperatures of amorphous Fe90Sc10 and Fe90Zr10 alloys, their temperature dependent resistivity is the same (see section 4.2, figure 6 and [11, 12]). These results show that in this case, the magnetic state has no decisive influence on ρ(T). In section 4.2 it will be shown the transmission probability of tunnelling plays the essential role for the behaviour of ρ(T). Amorphous Fe90Zr10 alloy has a ferromagnetic Curie temperature of Tc = 232 K [13] with a further magnetic transition at Tf = 35 K [14]. Below Tf, the magnetic state can be described by the spin canting model based on the theory of Gabay et al [15] for the infinite-ranged vector-spin-glass model of Sherrington et al [16]. The amorphous Fe90Sc10 alloy on the other hand is a cluster spin glass below its transition temperature of Tc = 105 K [17]. In addition, while amorphous Fe90Zr10, exhibits a change in slope in the temperature dependence of the magnetic hyperfine field around T ~ 35 K in zero external field [14], no such behaviour is observed for amorphous Fe90Sc10 in zero external field [18]. Overall, despite the different magnetic states of amorphous Fe90Sc10 and Fe90Zr10 alloys, the similar behaviour of their temperature dependent resistivity (see figure 6 and section 4.2; also [11, 12]) confirms that the magnetic state has a relatively minor effect on ρ(T) for such amorphous alloys.
As below, we briefly consider different models that aim to describe the temperature dependent electrical resistivity in relation to the present experimental results of ρ(T) for amorphous Fe90Sc10 and Co90Sc10 alloys. The physical reason for the behaviour of ρ(T) of distorted systems such as simple liquid metals, has been described by Ziman [2]. In this model the temperature dependence of resistivity is related to the structure factor S(q). A T2 dependence of ρ(T) is expected from this theory [19] although such a T2 dependence of ρ(T) is not observed in amorphous alloys with high resistivity values [20]. Further models based on a Boltzmann theory for the explanation of ρ(T), are the electron–electron interactions [21] and quantum interface models [22].
Given that the above theories and models have both advantages and disadvantages in accounting for the behaviour of ρ(T) in amorphous alloys, we propose a simple and straightforward method for understanding the temperature dependent behaviour. As described previously [3], given that the mean free path of electrons in the direction of an applied current is a few angstroms, free electrons with a propagation direction in the current direction can be considered as electron waves in a one-dimensional quantum well. Assuming that the electrons or waves propagate freely in the interval between the quantum wells, the analysis leads to an inverse quadratic relation between mean free path, λ, and the permitted energy (section 3, equation (2)). On condition that the permitted energy of the system increases with temperature, a relationship of the form, ρ(T) ~ √T, is obtained between resistivity (or inverse λ) and temperature. However, the variation of electrical resistivity as a function of temperature in the alloys investigated here is slight and a clear-cut dependency of the resistivity on temperature for amorphous Fe90Sc10 and Co90Sc10 alloys cannot be concluded. The decrease of the resistivity with increasing temperature for distorted systems has been explained by Anderson et al [23]. In particular, the difference in free energy between different regions of atomic arrangements in distorted systems is minor and, as a result, tunnelling of free electrons from one region to the other region is possible [23]. In the case of decreasing resistivity with increasing temperature, we applied the theoretical equation for the transmission probability tunnelling of electrons or waves (section 3 and [3]). It will be shown that in the case of amorphous Fe90Sc10 and Co90Sc10 alloys, electrons above the Fermi surface have scope for tunnelling from one region to another if the differences in barrier energy between regions is of order of ~4 × 10⁻²⁰ J.
2. Experimental procedure
Ingots of Co90Sc10 and Fe90Sc10 (nominal compositions in at.%) were prepared by arc-melting mixtures of high purity elemental metals of purity ⩾99.9 at.% in an argon atmosphere. Glassy ribbon samples of thickness ~50 µm and width ~3 mm were prepared by rapid solidification of the melt on a single copper roller at a tangential wheel velocity of 40 m s−1. The amorphous nature of samples was confirmed by x-ray diffraction measurements using CuKα radiation. Transmission electron microscopy (TEM) measurements were carried out using a JEM-2010F microscope (JEOL Co. Ltd) operated at 200 kV. Thin-foil specimens for the TEM observations were prepared by mechanical polishing followed by Ar ion-beam thinning under liquid nitrogen cooling to avoid radiation damage and thermal effects.
The coefficient of thermal expansion of Fe90Sc10 was measured over the temperature range 77 K to 300 K using a standard capacitive dilatometer as described in [24]. The electrical resistivity investigations were performed with a Physical Property Measurement System (PPMS®) from Quantum Design over the temperature range 1.9 K to 320 K. Electrical measurements were performed by the standard four-probe technique.
3. Data analysis
The data have been analysed based on the model and approach outlined recently [3]. Agreement between experiment and theory over restricted temperature ranges were obtained for both amorphous Fe90Sc10 and amorphous Co90Sc10 by inserting the following set of parameters into the theoretical transmission probability of tunnelling, T(E) (equation (1), [3, 25]):
- 1.Electron energy
 where E0 presents the Fermi energy at 4.2 K and kB is the Boltzmann constant (kB = 1.38 × 10⁻²³ J K−1).
- (a)Co90Sc10; E0 ~ 11.2 eV and
- (b)Fe90Sc10; E0 ~ 10.7 eV.
- 2.Barrier energy differences:
- (a) = 4.0 × 10⁻²⁰ J at T = 4.2 K and
- (b) = 4.3 × 10⁻²⁰ J at T = 4.2 K.
- 3.The barrier widths, of amorphous Co90Sc10 and Fe90Sc10 were selected as:
- (a) ~ 0.24 nm and
- (b) ~ 0.35 nm.


The mean free paths for amorphous Fe90Sc10 and amorphous Co90Sc10 −  = 0.32 nm and
  = 0.48 nm respectively—were determined according to standard relationships [26, 27]. The permitted energies of electron waves are given by [3]:
Inserting the values  = 0.32 nm and
  = 0.48 nm in the Schrödinger equation for principal quantum numbers
  = 6 and
  = 4, results in values for the permitted energies of
  ~ 10.7 eV and
  ~ 11.2 eV respectively. The permitted energies correspond approximately to the Fermi-energy of Fe and Co [25, 27], indicating that electrons have scope for free movement above the Fermi surface. This follows when the permitted energy for a certain principal quantum number is of the order of the Fermi energy. Furthermore,
  , the mean squared free path of free electron waves, determines the permitted energy per equation (2).
4. Results
4.1. Structural and magnetic properties
The analysis of x-ray diffraction measurements of amorphous Fe90Sc10 and amorphous Co90Sc10 reveals that both systems exhibit a distorted bcc-Fe atomic structure [6] while analysis of the corresponding Mössbauer spectra shows that these alloys consists of clusters with an average cluster size of about 125 atoms [5]. In other words every cluster of amorphous Fe90Sc10 and amorphous Co90Sc10 exhibits a bcc-distorted structure (a 2D representation of a distorted bcc-cluster is depicted in figure 1). In addition, the distribution of magnetic hyperfine fields is found to comprise two predominant contributions, a high magnetic field distribution centred around ~27 T and a low magnetic field distribution centred around ~12 T (e.g. hyperfine field distribution of amorphous Fe90Sc10; figure 2, [4, 5]). The distribution of the quadrupole splitting (caused by the interaction of the electrical field gradient of surrounding atoms with the nuclear quadrupole moment of 57Fe), also exhibits a bipolar nature reflecting the occurrence of two different atomic arrangements [5]. A combination of the structural and hyperfine studies indicates there are two different regions inside every distorted bcc-cluster of amorphous Fe90Sc10 and amorphous Co90Sc10. In terms of the Mössbauer analysis, these two regions labelled I and II correspond to nuclei experiencing low and high hyperfine fields. It should be noted that as a result of the mixed interaction between the magnetic hyperfine field and the quadrupole interaction and the consequent change in the Mössbauer line shape (e.g. [28, 29]), the hyperfine field distribution is somewhat continuous and the boundary between the two regions is not distinct. It is, nonetheless evident from the hyperfine field distribution of figure 2 that a sizeable low field component is present in addition to the dominant high field component. In addition, as mentioned above [4], the quadrupole distribution of the Mössbauer spectrum above the Curie temperature consists of two distributions with maxima at about ~0.2 mm s−1 and ~0.62 mm s−1. The existence of two distributions of quadrupole splitting confirms the presence of two regions.
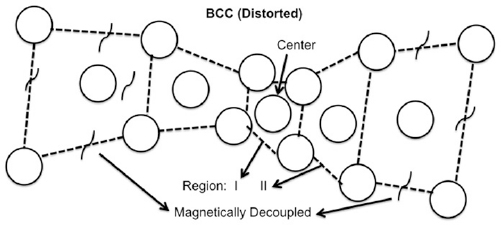
Figure 1. A 2D representation of a distorted bcc-cluster in amorphous Fe90Sc10 and amorphous Co90Sc10 (see text). Regions I and II are discussed in the text.
Download figure:
Standard image High-resolution image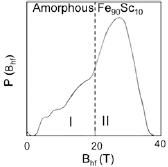
Figure 2. The distribution of magnetic hyperfine fields of amorphous Fe90Sc10 alloy [4, 5]. The distribution consists of low field and high field components as discussed in the text.
Download figure:
Standard image High-resolution imageIt is well accepted that the internal magnetic hyperfine field is linked to the magnetic moment of 57Fe (e.g. [5]). Similarly, numerous experimental and theoretical contributions have demonstrated that magnetic transition temperatures such as the Curie temperature, as well as the magnetic moment of Fe, are linked to the atomic spacing [30, 31]. Based on these earlier findings, it can be concluded that the low magnetic field values in the hyperfine field distribution of Fe (figure 2) are associated with the denser packed atoms while high magnetic field values are associated with Fe atoms with larger atomic spacings. According to the Bethe–Slater curve [32], if dFe–Fe/d3d, the ratio of the Fe interatomic separation to the 3d shell radius is large, this leads to reduced or zero values of the exchange integral and Curie temperature. In view of the large variation [6] of the atomic Fe–Fe distances in these amorphous alloys, magnetic clusters form in amorphous Fe-rich alloys and it is always possible to find groups of atoms that are magnetically decoupled from other Fe atoms. In agreement with experimental findings [5, 33], the formation of magnetic clusters can be understood in term of large Fe–Fe distances between clusters. This means that the Fe–Fe distances between clusters are large enough to prevent an exchange interaction between spins in separate clusters at a given temperature. Clear indication for the existence of magnetic clusters is provided by the response of the internal magnetic hyperfine fields to applied external fields [33]. In metallic magnetic materials with bulk grains, the internal magnetic fields decrease as a function of applied external field. In the case of isolated or weakly coupled magnetic clusters with sizes of a few nanometers such as the present Fe90Sc10 alloys, however, the internal field increases as a function of external applied field. In general accord with the 57Fe hyperfine field distribution of figure 2, the low field distribution includes atoms close to the centre of the disordered bcc clusters (defined as Region I; see figure 1) while the high field distribution is due to atoms close to the surface of cluster (defined as Region II). This interpretation is in agreement with the x-ray measurements, the radial distribution functions [6] and magnetic behaviour [30, 31].
The high–resolution electron microscopy (HRTEM) method allows direct imaging of the atomic structural features using both transmitted and diffracted beams. The HRTEM image of the amorphous Fe90Sc10 ribbon (figure 3) reveals the general absence of crystallinity, but possible existence of the atomic clusters as the brighter nanoscale areas of about 1 nm size. Similar to some Al90R10 alloys (R denotes rare-earth elements), Fe90Sc10 and Co90Sc10 alloys consist of Sc-centred clusters owing to the atomic size ratios of Fe/Sc ~ 0.128/0.16 ~ 0.8 and Co/Sc ~ 0.125/0.16 ~ 0.78 (nm nm−1) [34] with strong bonding tendency between the constituent elements, especially between Co and Sc [35]. Moreover, similar to the Al90Tb10 alloy and its role in controlling nanocrystal formation [36], there could also be overabundant Fe in the structure forming a high-density of nanoscale Fe-rich amorphous zones. Given the high atomic ratio of 9/1 for the present amorphous alloys, it is difficult to build an efficiently packed homogeneous atomic structure [37, 38].
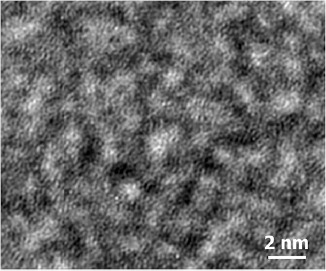
Figure 3. High-resolution TEM image of amorphous Fe90Sc10 alloy. As discussed in the text, the image reveals a general absence of crystallinity but possible existence of atomic clusters.
Download figure:
Standard image High-resolution image4.2. Electrical resistivity—Co90Sc10 and Fe90Sc10
4.2.1. Amorphous Co90Sc10.
As in figure 4, the electrical resistivity of amorphous Co90Sc10 varies from 80.0 µΩ · cm at T = 1.9 K to 79.9 µΩ · cm at T = 21 K with an overall change of ~0.1% over the temperature range ~1.9–22 K. As shown in the insert to figure 4, ρ(T) deviates from a linear decrease with temperature above T ~ 12 K, while ρ(T) increases above T ~ 50 K. The insert in figure 4 also reveals that agreement between the theoretical transmission probability of tunnelling and the experimental ρ(T) data was obtained only over the range ~1.9 K to 12 K. As outlined above, the agreement was based on tunnelling of electron waves through the barriers and an increase of free electron energy at the Fermi surface as a function of temperature according to E = E0 + kBT and with the data presented in section 3. As discussed previously [3], tunnelling through a barrier of constant width as the temperature increases, leads to an increase of the mean free path of electrons and consequently a decrease of the resistivity as observed for amorphous Co90Sc10 over the temperature range ~1.9 K to 12 K in figure 4.

Figure 4. The resistivity ρ(T) of amorphous Co90Sc10 over the temperature range 1.9–300 K. (open circles). The insert shows a comparison between the experimental ρ(T) data and the theoretical transmission probability of tunnelling with agreement obtained below T ~ 12 K.
Download figure:
Standard image High-resolution imageAs noted above, for T > 12 K, the resistivity deviates from the transmission probability of tunnelling. Further, for T ~ 50 K, the tunnelling process is suppressed. According to equation (2), the temperature (or energy) and mean free path of free electrons are related via, En ~ 1/ . As a result, an increase of temperature leads to a quadratic decrease of mean free path of electrons as observed experimentally for amorphous Co90Sc10 (figure 5). As discussed below, the transition from the tunnelling process at low temperatures (T < ~12 K) to the quadratic increase of resistivity for T > 50 K can be understood within the framework of Anderson et al [23] with tunnelling due to the weak variation of the internal energy of individual regions or clusters inside the sample [23, 39]. In other words, the internal energy in amorphous alloys differs from region to region and changes as a function of temperature. In amorphous alloys such as Co90Sc10, the variation of internal energy of individual clusters vanishes for T > 50 K and a quadratic increase of the electrical resistivity (equation (2)) as a function of temperature is expected (figure 5).

Figure 5. The square of the resistivity of amorphous Co90Sc10 alloy as a function of temperature T ~ 50–300 K. The full line represents a linear fit to the theory (see text; linear regression factor R = 0.967).
Download figure:
Standard image High-resolution image4.2.2. Amorphous Fe90Sc10.
The graph of resistivity versus temperature for amorphous Fe90Sc10 shown in figure 6 exhibits the same fundamental trends as observed for amorphous Co90Sc10 (figure 4). The resistivity initially decreases with increasing temperature (~4.2 K to ~250 K) before a change in the slope of the graph of ρ versus T takes place from negative to positive around T ~ 250 K. As demonstrated by the linear fit to the low temperature measurements, good agreement is obtained with the tunnelling model of free electron waves from ~1.9 K to 135 K.
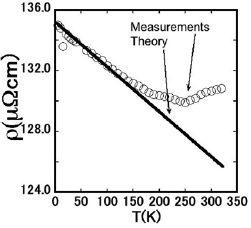
Figure 6. The resistivity ρ(T) of amorphous Fe90Sc10 over the temperature range 1.9–320 K (open circles). The full line shows theoretical values of ρ(T) calculated on the basis of the theory of transmission probability of tunnelling as described in the text.
Download figure:
Standard image High-resolution imageAs already noted, while amorphous Fe90Sc10 exhibits a similar atomic structure to that of amorphous Co90Sc10 [6], the residual resistivity of amorphous Fe90Sc10 (ρ0 ~ 135 µΩ · cm) is somewhat larger than that of amorphous Co90Sc10 (ρ0 ~ 80 µΩ · cm). This arises because in the case of Fe the Fermi surface cuts through the 3d band, whereas for Co the 3d band is below the Fermi surface [40, 41]. For Fe the spin up as well as the spin down parts of the 3d band are not fully occupied. This means that the free s electrons can approach the spin up and spin down 3d band. This behaviour results in scattering of free s electrons with both spin up and spin down by the 3d band, since the s electrons can approach the 3d band with either spin up or spin down. In the case of Co, however, the 3d band with spin up is fully occupied and electron scattering is restricted to the scattering of free electrons with the 3d band of spin down. The overall result is a lower value of the residual resistivity for Co90Sc10 compared to the Fe90Sc10 alloy. As shown in figure 7, changes in the slopes of the thermal expansion coefficients of amorphous Fe90Sc10 were observed over the temperature range ~77 K to 250 K. In particular, the thermal expansion coefficients of amorphous Fe90Sc10 were found to change slope around ~130 K and ~200 K. The changes in slope of the thermal expansion coefficients are presumably the result of minor reversible atomic rearrangements within the individual clusters or regions with temperature, although this change could not be confirmed by the Mössbauer effect or x-ray diffraction measurements. The temperature regions around which the resistivity of amorphous Fe90Sc10 changes slope (figure 6), deviate approximately from the exact value of the changes in the slope of the thermal expansion coefficient. This outcome shows, however, that changes in energy difference between individual clusters are not constant as a function of temperature. Given that tunnelling is the result of minor energy differences between regions in the sample [23, 39], this in turn leads to modification of the transmission probability of tunnelling (equation (1)) and hence resistivity behaviour as presented in figure 6. As noted above, for amorphous Fe90Sc10, good agreement is obtained between the experimental data and tunnelling model of free electrons over the temperature range ~4.2 K to 135 K (section 3; energy difference of 4.3 × 10⁻²⁰ J and barrier width of ~0.35 nm). Above T > 135 K, the resistivity deviates from the transmission probability of tunnelling while for T ~ 250 K, the tunnelling process is suppressed. As discussed above, an increase of temperature leads to a quadratic decrease of mean free path of electrons as presented in figure 8. In the range 250 K > T > 135 K, the fraction of tunnelling process starts to decrease as a function of the temperature with ρ(T) in this range a consequence of the thermal process and the tunnelling process.
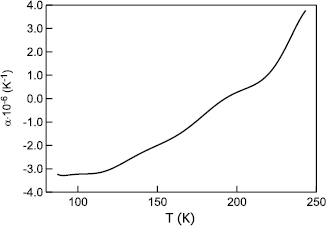
Figure 7. Thermal expansion coefficient of amorphous Fe90Sc10 over the temperature range ~77–250 K. The values are shown relative to T = 195 K. The changes in slope around ~130 K and ~200 K are discussed in the text.
Download figure:
Standard image High-resolution image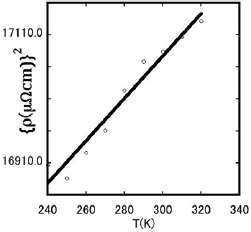
Figure 8. The square of the resistivity of amorphous F90Sc10 alloy as a function of temperature T ~ 240–320 K. As discussed in the text, the full line represents a linear fit to the theory (linear regression factor R = 0.978).
Download figure:
Standard image High-resolution image
5. Discussion
Analyses of the x-ray diffraction and Mössbauer effect measurements (in particular the distributions of magnetic hyperfine fields and quadrupole splitting [4, 5]) and the bright HRTEM images, have led to the following insights to the atomic arrangements in amorphous Co90Sc10 and amorphous Fe90Sc10.
For amorphous Fe90Sc10, considering a Fe atom in the centre of the bcc-distorted cluster as in figure 1, the atomic spacing between nearest neighbour atoms increases as atoms move from the centre of the cluster. Increased atomic distances results in decoupling of the ferromagnetic interactions and the magnetic clusters tend to separate. The mean free path of electrons in clusters is similar to the atomic separation distance and consequently some electrons are trapped and cannot migrate from one cluster to another. In effect, while some free electron waves are captured inside the cluster, there is a possibility for the electron waves to tunnel between the clusters. As a result and as discussed above, the resistivity of amorphous Fe90Sc10 is found to decrease with temperature over an extended region (~4.2–135 K; figure 6).
While similar in overall trends, the resistivity behaviour of amorphous Co90Sc10 (figure 4) differs from that of amorphous Fe90Sc10. The mean free path of electron waves for amorphous Co90Sc10 is relatively large (λ = 0.48 nm) compared with that of amorphous Fe90Sc10 (λ = 0.32 nm) and hence the probability of electrons residing in a given cluster is lower for amorphous Co90Sc10 than for amorphous Fe90Sc10. As mentioned above, the best agreement between measurements and theory (equation (1)) over the temperature range 1.9 K < T < 12 K was found with a barrier width of  ~ 0.24 nm. We therefore conclude that for amorphous Co90Sc10 the slight change of resistivity in this range occurs as a result of tunnelling of electron waves within a cluster from Region I to Region II (figure 1), whereas for amorphous Fe90Sc10 (barrier width
  ~ 0.35 nm) the change of resistivity is a consequence of tunnelling of electrons from one cluster to another cluster. From these measurements, it can be concluded that the wave nature of electrons and the tunnelling of electrons between clusters provide the basis for understanding the electrical resistivity of such amorphous alloy systems.
6. Conclusions
The resistivity of amorphous Fe90Sc10 and Co90Sc10 alloys has been investigated over the temperature range ~1.9 K to 320 K. Combined with high resolution transmission electron microscopy measurements and previous x-ray diffraction and Mössbauer effect measurements [4, 5], the behaviour of the resistivity of amorphous Fe90Sc10 and Co90Sc10 can be described in terms of the wave character of electrons and their associated tunnelling.
While electrons remain trapped within the distorted bcc cluster of the amorphous alloys, the relatively small mean free path of  = 0.32 nm for amorphous Fe90Sc10 allows tunnelling of the electron waves between clusters. As shown in figure 6, good agreement is obtained between the measured decrease in resistivity with temperature over the range ~4.2 K to 135 K and calculated values based on the theoretical transmission probability of tunnelling. By comparison the relatively large mean free path of
  = 0.48 nm for amorphous Co90Sc10 restricts tunnelling between clusters within the restricted temperature range ~1.9 K to 12 K (figure 4) but allows tunnelling of electrons between different regions within a cluster (Region I and Region II, figure 1). In summary, the wave character of electrons has to be considered in order to provide a full description of the electrical resistivity of the amorphous Fe90Sc10 and Co90Sc10 alloys.
Acknowledgments
MG acknowledges support from UNSW Canberra while based there as a senior visiting fellow. This work was supported by the National Natural Science Foundation of China (grant nos. 51520105001, 51571119) and the Fundamental Research Funds for the Central Universities (No. 30916011106). TF acknowledges the support from the innovation project, Qing Lan Project and the specially-appointed project of Jiangsu province.