

Abstract
We report photoinduced effects in nonlinear third harmonic ac electric transport—which is a measure for the density of correlated polarons—in thin films of  (LBMO) and
  (LPCMO) manganites. Both materials show an enhancement of third harmonic voltage in the vicinity of the metal-to-insulator transition, indicating strong electron-lattice correlations within a phase-separated state. Relatively low laser excitation with a pulse fluence of
  leads to an increase (decrease) in nonlinearity in LBMO (LPCMO). With a high pulse fluence of 8mJ cm−2, we were also able to suppress the correlations in LBMO, which is accompanied by a decrease of third harmonic voltage by
  in our time-averaging measurement technique.
Export citation and abstract BibTeX RIS
1. Introduction
Perovskite manganites display a variety of intriguing physical phenomena such as ferro- and antiferromagnetic ordering, metal-to-insulator and structural phase transition as well as electronic phase separation [1, 2]. In their general formula  , where
  denote rare earth metals and
  alkaline earth metals, the doping level x gives the fraction of
  ions and 1 − x the complementary portion of
  . This ratio of
  ions and the cation radii of R and A determine the interplay of two competing interactions: one is double exchange [3], which leads to the delocalization of Mn eg electrons and stabilizes a ferromagnetic metallic ground state, and the other is electron–phonon coupling originating from Jahn–Teller (JT) polaron [4, 5] formation favoring an insulating paramagnetic or antiferromagnetic state. Due to the nature of a JT polaron being an eg electron accompanied by a lattice distortion in the form of an elongation of the
  octahedron in one direction and a contraction in the other, multiples of these deformations can arrange themselves next to each other to further gain energy forming correlated polarons [6]. On the other hand, the Coulomb repulsion between the electrons limits the formation of correlated JT polarons [7–9] leading to long-range charge ordering for higher dopings,
  . There is strong evidence [10] that these correlations play an important role for the well known [11] colossal magnetoresistance (CMR) effect in connection with an electronic phase separation scenario [12].
The CMR is a classic example of the extreme susceptibility of manganites to different external stimuli which results in a drastic change of properties via the phase transition. Such stimuli include chemical doping, temperature, pressure [13], strain [14], magnetic [15] and electric [16, 17] fields as well as electromagnetic radiation, including light [18, 19]. For example, Rini et al [20] were able to drive an insulating  (PCMO) single crystal into a transient metallic state by means of a coherent laser excitation of a low energy JT phonon mode. Moreover, incoherent—with respect to JT phonons—electronic excitations [21, 22] with much higher photon energies in the ultraviolet, visible and near infrared spectral region have been shown to strongly affect electric transport and structural properties [23]. Thus, manipulating electron-lattice correlations by electronic transitions can have direct effects on the structure of a material as shown by DMFT calculations [24]. The photoinduced changes of electrical resistance were found to be mostly pronounced for small-bandwidth manganites, i.e. PCMO, at low temperatures, for which the electronically and structurally phase separated state can be destroyed or strongly modified by electromagnetic radiation [25].
Here we report the influence of laser excitation with ultra-short laser pulses in the near-infrared regime ( ) on the nonlinear third harmonic voltage (
 ) of middle-bandwidth strongly correlated
  (LBMO) and
  (LPCMO) manganites. Both these compounds show a metal-to-insulator (MI) transition which is highly influenced by the strength of the electron–phonon coupling in the system. For LBMO the coupling is rather weak, which leads to an MI transition near room temperature, whereas in LPCMO the coupling is strong and thus the transition occurs at lower temperatures,
  [26]. This coupling manifests itself in the formation of correlated JT polarons, which give rise to non-linear behavior in electric transport due to their quadrupolic nature. Namely, the third harmonic coefficient,
  , was shown to represent the density of correlated JT polarons [27]. The laser excitation changes
  near the transition temperatures,
  , thus indicating a manipulation of electron–phonon coupling.
2. Methods
LBMO/ (1 0 0) and LPCMO/MgO(1 0 0) thin films were prepared by metalorganic aerosol deposition [28]. The films were microstructured to a bar with a width of
  and a length of
  (LBMO) and
  (LPCMO), respectively, using electron beam lithography on a Raith Elphy-Plus and chemical wet etching. In addition, metal contacts (
 Au on top of
  Cr) were deposited by thermal evaporation onto the bar to get a hall-bar geometry for electrical four-probe measurements. A nonlinear
  measurement technique [27] was used with an ac current sent through the bar while the voltage drop was measured on the fundamental
  and third harmonic frequency (
 ) by means of lock-in amplifiers to calculate the third harmonic coefficient
  . Therefore the 5 V-sine output of a Stanford SR830 was used to provide a constant excitation current of
  at
at  over a 10 MΩ series resistor.
The photoexcitation was realized by two different Ti:sapphire lasers with the same photon energy  and wavelength of
  , but with different duration (τ) and repetition rates (f) of the pulses. The 'Femtolasers Femtosource fusion 20' provides pulses with
  and
and  repetition rate and a spot size of
  , yielding a relatively low pulse fluence,
  . The second laser 'Coherent RegA 9040' with
  pulses,
  and a
and a  results in a much higher fluence
  . To measure the laser-induced effects in a wide range of temperatures,
  , a customized inset with fiber-guided laser insertion for a Quantum Design physical properties measurement system (PPMS) was built for the first laser system. For the second, more powerful system, which demands a free beam configuration, a Peltier-cooled sample holder was built, enabling measurements at temperatures
  .
.
3. Results
3.1. Sample characterization
Firstly, we examined the general characteristics of the films to ensure their quality. X-ray diffraction (XRD) in Bragg–Brentano geometry ( , Cu
, Cu  radiation) confirms the perovskite crystal structure with a pseudo-cubic out-of-plane lattice constant
  and
and  and film thicknesses
  and
and  . Scanning tunneling microscopy (not shown here) reveals a smooth surface for both films with a mean-square roughness value
  for LBMO and
  for LPCMO. In figure 1 we present dc resistivity versus temperature curves used to map the MI transition, which is clearly visible at
  for LBMO and at
  for LPCMO. Interestingly, the latter sample also shows a second maximum in resistivity at
  , which was not present before the microstructuring of the LPCMO film. We interpret this feature to be a signature for a large scale phase separation effect [29]. For the second phase we assume a slightly different Pr-doping, which cannot be identified in the XRD pattern since the lattice constant only differs by less than
  . If we furthermore assume that this phase forms elongated spatial domains, electrical currents can circumvent these domains in the full film. In the structured sample this short-circuit is eventually inhibited. By comparing the 2nd maximum to its full phase expected value, which could be roughly calculated by extrapolating from the slope towards the main maximum, one gets an estimation of about ∼10% fraction of the second phase. However, this second phase shows a stronger nonlinear behavior than the main transition as we will see later.
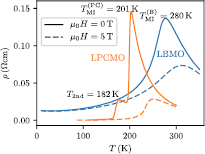
Figure 1. Temperature and field dependence of the resistivity of LBMO and LPCMO bars with  width. At zero external field, the MI transition is at
  (LBMO) and
  (LPCMO). Note that LPCMO shows a second maximum which is at
  , which we attribute to a second phase with different doping. After applying an external magnetic field (dashed lines) the transitions are suppressed and shifted to higher temperatures.
Download figure:
Standard image High-resolution image3.2. Electronic transport
The actual study of laser-induced effects in manganite films was performed using the following protocol developed by us: (1) The desired temperature was set and we waited until it was stable; (2) measuring  and
and  was started without laser excitation; (3) after
  the laser with a pulse length of
  (
( ) and a repetition rate of
  (
( ) for the low (high) fluence was switched on; (4)
  later the excitation was switched off, meaning that during this period the sample was actually illuminated for only
  or
or  , respectively, due to the pulsed nature of the laser beam; (5) after further
  the measurement was stopped. The levels of the saturated signal for 'laser off' and 'laser on' states were extracted and assigned to the set temperature, resulting in the corresponding
  and
and  dependencies. We have shifted the 'excited'
  up to higher temperatures so that it matches the 'unexcited' curve. This was necessary to account for the unavoidable heating of the sample caused by a repetitive laser light absorption during the continuous electric measurement. Although the T shift was determined empirically, a simple finite-element simulation (not shown here) was also carried out using COMSOL Multiphysics [30] to confirm it. Our model describes the steady state temperature distribution in an unstructured manganate film on top of an STO substrate, subject to local heating at the surface. The relevant parameters for heat transport (density, specific heat, thermal conductivity) were taken from [31]. Experimental laser heating was implemented as a spatially distributed heating source, reflecting the properties of the laser system in Greifswald. This simulation confirmed the empirically determined T shift and this shift was then also applied to
  . This was done for all temperatures from
  down to
  for LBMO and down to
  for LPCMO using the PPMS.
Figure 2 shows the data on LBMO with the two different fluences used. Both  and
and  display a pronounced maximum at the MI transition and one can clearly see that
  , after temperature compensation, is not influenced by the laser excitation for both intensities. In contrast,
  is slightly increased in the case of the small fluence and is evidently decreased under irradiation with a much higher fluence. Thus, the third harmonic coefficient
  at
at  is also changed correspondingly by ∼+1% and ∼
 , for small and large fluence respectively.
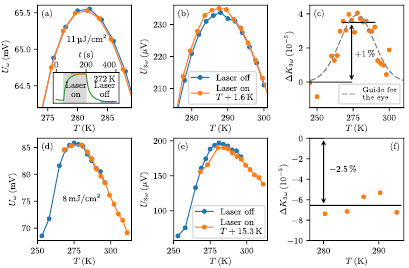
Figure 2. Influence of laser excitation on transport properties of LBMO measured with low ((a)–(c)) and high fluence ((d)–(e)). From the time evolution of  and
and  (example in inset of (a)) the saturated levels were extracted to get temperature dependencies for 'laser off' and 'laser on' ((a), (b), (d), (e)). In (a) and (d),
  shows no change upon excitation except for a temperature increase which was corrected by a shift of
  and
and  , respectively. But
  and so
  was increased by
  with low fluence (c) and decreased by ∼2.5% with a high fluence (f). Note that 'laser on' means excitation with laser pulses, where only during a fraction of
  (
( ) of the time for the low (high) fluence the sample is actually illuminated.
Download figure:
Standard image High-resolution imageThe LPCMO film could only be measured with low fluence since the required low temperatures were available within the PPMS setup only. The results from these measurements are shown in figure 3. Here the maximum in  is located at
  which corresponds to the second maximum in
  . Additionally there is also a small maximum in
  at
at  , but it is by a factor of 50 smaller than the main one. Again, the laser excitation does not change
  , even the heating was found to be very small (
 ), but in
  a clear effect at
  is visible in
  . Expressed in terms of
  , which is about
  at
at  , this implies a laser-induced decrease of the polaron density by about
  .
.

Figure 3. Change in transport properties of LPCMO upon laser excitation with a small laser fluence of  . In (a)
  has the two expected maxima at
  and
and  as known from resistivity in figure 1. The laser-excitation has no influence on
  , even no heating.
  in (b) shows the maximum at
  and at
  there is only a small hump which is a factor of 50 smaller. Here upon illumination the signal decreases, which is also visible in the change of
  (c).
(c).
Download figure:
Standard image High-resolution image4. Discussion
The small increase of  in the case of LBMO with small fluence could be originating from an incoherent excitation of JT breathing modes similar to the coherent stimulation of these modes observed by Rini et al [21]. Even though the energy of this mode
  is much smaller than the excitation energy
  , some part of the photon energy could have been transferred from the initially excited electron system via dissipative processes into the JT optical phonon modes because of strong electron–phonon coupling (see figure 4). Being close to the phase transition enables a large susceptibility to the enhancement of the short-range polaronic order mediated by this activation of JT phonon modes. This would explain the rise in
  caused by the laser.

Figure 4. Model for the excitation processes in LBMO. The photons can induce a transition of the eg electron into a higher band. For high fluence this happens in many unit cells due to the large number of photons, which then induces melting of the polaronic correlations. In the case of low fluence, only a few of these excitations are induced, which then dissipate their energy into the phonon system upon relaxation. Thus Jahn–Teller phonon modes are excited, synchronizing adjoining JT distortions which stabilizes the polaronic correlated state.
Download figure:
Standard image High-resolution image
On the other hand, with high laser fluences one could melt the correlated polarons in LBMO and thus decrease  . This can be understood by looking at the electronic structure, in which due to the crystal field and JT splitting the fivefold degeneracy of the 3d electrons is lifted and two separated eg levels are formed. The lower level is occupied by one electron in the
  —where JT distortion is favored—and can be excited with
  photons to the upper level (see figure 4) [21, 22]. In this case, the distortion no longer gains energy and so the JT polarons and the electron-lattice correlations are destroyed.
Another mechanism could be that the free upper eg level is populated from the low-lying O-2p states. In fact, the photon energy,  , is well above the typical JT eg splitting of
  . However, even though this process is possible, it should not be the predominant one. As DFT calculations for the band structure of the related system PCMO show [22, 32], this excitation requires photon energies of
  to be significant. Anyway, such an excitation would induce a change in the Mn valence, which in turn destroys the energetic balance between Coulomb repulsion and JT distortion. Thus, one can expect a destruction of correlated polarons as a consequence.
For the measurements of LPCMO, our model also explains the findings, except that there the lower fluence is already sufficient to break the polaronic state. This can be understood by taking into account the stronger electron–phonon coupling [26] and thus larger polaron density, wich in turn increases the probability of polaron melting for LPCMO in comparison to LBMO.
There are two important points to be accounted for in all measurements presented here. First, the spot sizes of the lasers do not illuminate the whole bar, leaving some unexcited parts, which therefore keeps its unaltered response in  . So the changes in
  only originate from the area below the laser spot. Because the contribution from the excited and unexcited parts to
  add up in a serial manner and are proportional to their areas, we will now scale the measured effect with the ratio of these areas. This enables us to estimate the impact on the illuminated part only. Thus, for the LBMO bar (
 ) we get a rescaled change in
  of
of  for the low fluence (
 ) and
) and  for the high fluence (
 ). For the LPCMO bar (
 ) the rescaling yields
  for the low fluence.
The second point is that, due to the ultra-short pulses and the moderate repetition rate of the lasers, the sample was illuminated for a time fraction of about 10−5 for low fluence and 10−8 for high fluence during the measurement time. Note that the electric measurements of  and
and  are continuous and the observation of a measurable time-averaged photoinduced signal depends solely on the lifetime
  of the excitations and the pulse period
  . On short timescales directly after photoexcitation, we expect a much larger change to
  than the observed values. Let us first have a look at the high fluence case for LBMO, where we had a repetition rate
  , which corresponds to
  . From previous studies [33] it is known that
  can be reduced by static modification from 10−1 to 10−4. Taking this relative change as an initial suppression of
  in our experiment as well, we deduce a lifetime of
  of the photoexcited state. A lifetime of the same order of magnitude was also found by Fiebig et al [34] in their investigations on the reflectivity dynamics of PCMO.
If we also assume this lifetime for the experiments on LBMO and LPCMO conducted with the small fluence laser system, we can now deduce the initial change in  directly after laser excitation for those experiments. Taking into account that the pulse period,
  , is by a factor of 11 smaller than the assumed lifetime, we calculate an initial change of
  of
of  (LBMO) and
  (LPCMO) for the low fluence measurements. This is in agreement with our experimental results. Note that compared to the high fluence measurements discussed above, one can understand the much smaller initial change in
  due to the three orders of magnitude smaller pulse fluence.
5. Conclusion
We have shown the influence of laser light on correlated JT polarons near the phase transition for thin films of LBMO and LPCMO with relatively low and strong electron–phonon coupling, respectively. The stabilization or melting of correlated polarons, depending on the manganite system and the excitation fluence, was demonstrated. Rescaled to the known possible change in  , we could calculate a lifetime of
  for the photoexcited polaronic state.
Acknowledgments
We would like to thank the DFG for financial support through SFB 1073 TP B01.