
Abstract
Dielectric barrier discharges are an emerging technology for the plasma-catalytic removal of volatile organic compounds and other gas purification challenges such as the removal of O2 traces from H2. Packed-bed reactors are mainly used for these applications, but surface dielectric barrier discharges (SDBDs) typically printed on thin dielectric plates are promising alternatives for the treatment of large volumetric flow rates due to their low flow resistance causing a low pressure drop. Especially for SDBDs the flow conditions are crucial, because the active plasma filled volume covering the mentioned plates with a typical thickness of 0.1 mm is small in comparison to the overall reactor volume with a typical distance of some tens of millimeters to the reactor wall. In this study, the flow conditions of a twin-SDBD were investigated by Schlieren imaging applied in converting O2 traces in H2 containing gas mixtures to H2O and compared to fluid dynamics simulations. Schlieren imaging was used to visualize local gradients of the refractive index inside the SDBD reaction chamber, while gas composition, dissipated power, or flow rate were varied. Without a plasma discharge, laminar flow dominates, resulting in a conversion below 10% over a Pt-coated electrode configuration in the reaction of O2 traces with H2. With the plasma discharge, full conversion was achieved for the same reaction without catalyst, although the plasma is also confined to the surface of the electrode configuration. Schlieren structures covering the complete cross section of the reaction chamber were observed, showing that strong radial mass transport is induced by the plasma. The shape and extent of the Schlieren structures is ascribed to a superimposition of gas flow, thermal expansion from the plasma volume, thermal buoyancy as well as an electrohydrodynamic force between the electrodes and the grounded reactor walls. Fluid dynamics simulations show vortex formation above and below the electrode, created by the electrohydrodynamic force further implying extensive mass transport by the plasma, which is visualized in addition by carbonaceous deposits on the reactor lid. This emerging deposition pattern during toluene decomposition closely corresponds to the electrode geometry. It is proposed that the reaction proceeds only in the active plasma volume and that reactive species transported to the bulk gas phase only have a minor contribution. Thus, the degree of conversion of the SDBD reactor is not only determined by the chemical reactivity in the plasma volume, but also by its plasma-induced mass transport resulting in efficient gas mixing. These findings reveal new possibilities to improve SDBD reactors for gas purification applications based on their favorable flow conditions.
Export citation and abstract BibTeX RIS

Original content from this work may be used under the terms of the Creative Commons Attribution 4.0 license. Any further distribution of this work must maintain attribution to the author(s) and the title of the work, journal citation and DOI.
Symbols and acronyms
| Description | Unit (if applicable) | |
|---|---|---|
| CEM | Controlled evaporator mixer | — |
| CFD | Computational fluid dynamics | — |
| Cp | Specific heat capacity | J Kg−1 K−1 |

| Total capacitance of the system | F |
| E | Electric field strength | V m−1 |

| External body force per unit volume | N m−3 |

| Focal length | mm |

| Pulse repetition frequency | Hz |
| g | Gravitational acceleration | m s−2 |
| HV | High voltage | — |

| Measured current | A |

| Thermal conductivity | W m−1 K−1 |
| p | Pressure | Pa |

| Power dissipated into the system | W |
| PEEK | Polyether ether ketone | — |
| Q | Volumetric heat source | — |

| Reynolds number | — |

| Critical Reynolds number | — |
| SST | Shear stress transport | — |

| Pulse period | s |
| tp | Time interval between pulses | s |

| Temperature | K |

| Measured voltage | V |

| Velocity Vector | m s−1 |

| x-component of velocity | m s−1 |

| y-component of velocity | m s−1 |

| z-component of velocity | m s−1 |

| Applied voltage (peak-to-peak) | kV |

| Volumetric flow rate | l min−1 |
| Δt | Discharge time | s |

| Debye length | m |

| Dynamic viscosity of the fluid | Pa s |

| Permittivity | C2 N−1 m−2 |

| Relative permittivity | — |

| Density of the fluid | Kg m−3 |

| Charge density | C m−3 |

| Electric potential | V |
1. Introduction
One of the major challenges in environmental protection is the total oxidation of volatile organic compounds (VOCs) to CO2 and H2O. VOCs are released from a variety of industrial processes, paint shops or canteen kitchens and are harmful for human health and environment [1–3]. Plasma-only as well as plasma-catalytic processes based on robust and easy to handle dielectric barrier discharges (DBDs) are promising alternatives to established processes such as thermocatalytic oxidation [4] and provide fundamental insight into plasma-chemical mechanisms. DBDs are used for ozone generation [5, 6], for biomedical applications such as wound healing [7], or for the plasma-assisted oxidation of various VOCs such as cyclohexane [8], benzene [9], toluene [10], or formaldehyde [11]. Due to its simple setup and strongly non-thermal nature DBDs provide a high flexibility with short ramp-up times, facilitate scale-up by numbering up using arrays and can be operated at ambient and even elevated pressure and temperature. In general, DBDs can be divided into surface DBDs (SDBDs) or volume DBDs (VDBDs), depending on the electrode configuration and the plasma discharge. When the gap between both electrodes is completely filled with the dielectric, the plasma is generated on its surface, creating an SDBD, and when the region between the electrodes is not completely filled with the dielectric, plasma can be generated in the volume between both electrodes, resulting in a VDBD [12, 13].
Furthermore, SDBDs are often investigated as plasma actuators in the field of aerospace engineering and flow control [14, 15]. Potential applications may include vortex formation in gas channels [16, 17], active noise control [18] or flight control of aircrafts [19]. Plasma actuators offer a multitude of advantages over traditional actuators, which include the direct conversion of electric energy into kinetic energy without using mechanical parts, a fast response time, light weight and thin design [14, 15]. The ions which are created by the discharge transfer their momentum from the plasma discharge to the surrounding gas molecules, thereby accelerating them and inducing gas flow [14]. The mass transport and flow control induced by DBDs may not only be utilized in the field of aerospace engineering, but may also be crucial for the performance of SDBD reactors in plasma-only and plasma-catalytic gas purification applications.
The flow induced by the DBDs is well studied and different methods are used to characterize it, like Schlieren imaging [20, 21], particle image velocimetry (PIV) [20, 22, 23], or numerical simulations [22, 24]. Schlieren imaging is a common method to investigate the flow characteristics of a fluid medium by visualizing phase differences in a light beam [25]. Schlieren techniques use optical setups to translate phase differences into visual intensity (or color) differences. When light propagates through media with different refractive indices, the phase velocity of the light is altered at the interface, and the propagation direction is changed depending on the incident angle [25], which is called refraction. Schlieren setups with high sensitivity can be used to visualize gradients in the refractive index caused by changes in the first derivative in density. For compressible gas flows these gradients are typically induced by temperature differences or high gas velocities.
In this study, Schlieren imaging is used to investigate the flow characteristics of a twin-SDBD, which was designed for the oxidation of VOCs. Offerhaus et al [26] characterized the SDBD with respect to its plasma parameters, electrical parameters, chemical reactivity and performed preliminary Schlieren imaging. Schücke et al [27, 28] and Peters et al [29] applied the SDBD in the plasma-only and plasma-catalytic oxidation of several VOCs and demonstrated its viability for such applications with a high performance. The plasma is limited to the surface of the SDBD electrode configuration with a radial expansion of approximately 100 µm and a lateral expansion of only a few millimeters. The obtained high degrees of conversion are against expectation, because the bulk gas volume is substantially larger, and bypassing of the active plasma volume under laminar flow conditions would be expected. Therefore, they have to be rationalized by a significant mass transport caused by the plasma. For this study, the parameter range of the Schlieren measurements was expanded from the preliminary measurements to include different gas compositions, applied voltages (i.e. dissipated power), and volumetric flow rates of the SDBD electrode configuration. The reaction of O2 traces with H2 was chosen as a simple probe reaction with only a single product, for which full conversion can be achieved at ambient temperatures. The plasma plays a dual role in this reactor design. It is not only the source of highly reactive species, but it additionally induces convection, which causes gas mixing in the reactor volume. As it is not possible to separate the chemical activity of the plasma from its influences on the flow characteristics, it is difficult to evaluate the contribution of the plasma-induced alteration of the flow characteristics to the performance of the SDBD. A highly active thin film of Pt nanoparticles on the surface of the SDBD electrode configuration was utilized to investigate the reaction of O2 traces with H2 inside the SDBD reactor without the plasma influencing the laminar flow conditions. Additionally, toluene was decomposed in the plasma reactor to yield a deposition pattern, which provides information about the underlying flow dynamics. An identification of the location of the chemical reaction is crucial to further elucidate the reaction mechanism and the participating species as well as to improve the performance of the SDBD reactor.
2. Experimental
2.1. Twin-SDBD
The SDBD electrode configuration consisted of an aluminum oxide (α-Al2O3) plate with two identical Ni-plated metal grids screen-printed on each side. The α-Al2O3 plate had dimensions of 190 mm × 88 mm × 0.635 mm and acted as the dielectric barrier. The metal grid lines had a width of 0.45 mm, a height of approximately 30 µm and formed evenly spaced squares of 10 mm × 10 mm. The metal grids consisted of 15 × 5 squares and served as the powered and grounded electrode of the SDBD. A photograph of the SDBD electrode configuration is shown in figure S1 (supporting information). A commercial high-voltage (HV) pulse generator with an external transformer (Redline G2000, Redline Technologies, Germany) provided HV pulses with typical peak-to-peak values  between 7 kV and 11 kV and a defined pulse repetition frequency
  of 4000 Hz to the powered electrode. The resulting voltage waveform had the shape of a pulsed damped sine wave. The natural frequency of 86 kHz was defined by the secondary inductance of the HV transformer and the capacitance of the SDBD electrode configuration, which formed a series resonant circuit. The plasma ignited along the grid lines on both sides of the dielectric surface.
2.2. Reaction chamber and flow setup
All measurements were performed at ambient pressure and temperature in an all stainless-steel flow setup with a custom-made reactor. Three different gas lines with H2 (purity > 99.999%, Air Liquide), N2 (purity > 99.999%, Air Liquide) and O2 (purity > 99.998%, Air Liquide) were connected to the flow setup. The gas flows were adjusted by calibrated mass flow controllers (EL-FLOW Select, Bronkhorst High-Tech B.V., Netherlands) and were mixed to produce the desired gas mixtures. A pneumatically actuated four-port-two-position valve (Valco valve, VICI AG International) was used to set the complete reactor unit either online or bypass. The reaction chamber was presented by Peters et al [29] in detail and was made from aluminum. KF 25 flanges at its inlet and outlet expand to a rectangular cross section of 105 mm × 17 mm with a length of 200 mm. The SDBD electrode configuration was positioned at the center of this rectangular reaction chamber and insulated from the reactor walls by PEEK mountings. Therefore, the gas flow passed along both sides of the SDBD electrode configuration. Rectangular quartz windows (Viosil SQ, GVB GmbH, Germany) with dimensions of 50 mm × 20 mm were placed on the center of the flat sides of the reaction chamber (17 mm × 200 mm) and allowed a side view of the electrode configuration. The complete reaction chamber was grounded. Voltage and current measurements were performed with a HV probe (P6015A, Tektronix, USA) and a current probe (Model 6585, Pearson Electronics, USA) connected to a digital oscilloscope (DPO5204B, Tektronix, USA). A typical current and voltage measurement is shown in figure S4. The composition of the exhaust gas stream was monitored online by a multi-channel analyzer (MCA) (X-STREAM Enhanced XEGP, Emerson, USA) equipped with an electrochemical O2 trace sensor and a thermal conductivity detector for H2. Due to the plasma discharge a minor temperature increase of the bulk gas to approximately 50 °C is observed. More detailed temperature measurements are described by Peters et al [29]. A schematic illustration of the reactor unit is shown in figure 1. Photos of the reactor with an active plasma discharge are shown in figure S5.
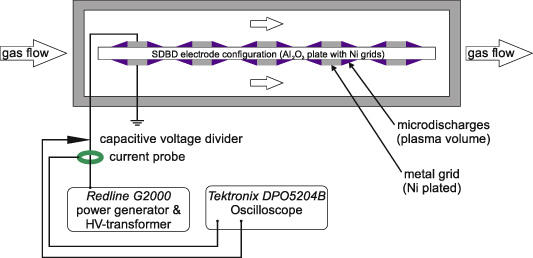
Figure 1. Schematic illustration of the reactor unit with the SDBD.
Download figure:
Standard image High-resolution imageIf not stated otherwise, a mixture of 500 ppm O2 balanced in N2 with a volumetric flow rate of 10 l min−1 was used resulting in a linear flow velocity of approx. 0.1 m s−1 in the rectangular reaction chamber. For the reaction of O2 traces with H2 to H2O, a mixture of 500 ppm O2 balanced in a H2/N2-mixture with an identical flow rate was used. The degree of conversion was calculated as the ratio of the converted amount of O2 relative to its amount in the feed. The HV pulses were applied to the top electrode. The addition of toluene was carried out using a controlled evaporator mixer (CEM, Bronkhorst High-Tech B.V., Netherlands) system, through which the respective N2 flow was directed.
2.3. Electrical characterization and dissipated power
The current–voltage characteristics of the SDBD have already been described by Offerhaus et al [26] and Kogelheide et al [30]. Plasma ignition can be observed as numerous spikes on the first half-waves of the current waveform. The power dissipated into the system was derived as described by Schücke et al [27] (equation (1)),
Here,  is the measured voltage,
  the measured current,
  the duration of a pulse period and
  the total capacitance of the system. It has to be noted that the power dissipated in the system is not equivalent to the power dissipated in the plasma, but additionally includes ohmic losses in the conductors and dielectric losses in the dielectric plate of the electrode configuration.
2.4. Spray coating
A spray coating procedure previously presented by Peters et al [29] was used to create a thin and homogeneous film of platinum nanoparticles (<50 nm, Sigma Aldrich) on both sides of the electrode configuration. The desired loading of 150 µg cm−2 was obtained using the following procedure: a suspension of 0.05 mg ml−1 Pt nanoparticles in a 1:1 mixture of isopropanol and water was prepared and treated for 40 min in an ultra-sonic bath. This suspension was sprayed onto the electrode configuration with a volume of 30 µl per spray point and 1 mm between the spray points. The liquid was immediately evaporated as the target was heated to 200 °C.
2.5. Schlieren imaging setup
Schlieren imaging was used to visualize density gradients of the gas phase inside the reaction chamber. Schlieren images were recorded by a lens-type Schlieren setup similar to the instrument described by Settles [25] and adapted for the SDBD by Offerhaus et al [26]. A schematic illustration of the Schlieren setup is shown in figure 2. A point-like light source was created by focusing a monochromatic LED light source onto a pinhole using a condenser lens ( ). Another lens (
 ) was used to collimate the light, and the SDBD reactor was placed within the parallel light beam. The light beam passed through the side windows of the reaction chamber and was therefore perpendicular to the flow direction. Consequently, several grid lines were in line of sight. After the light beam had passed through the SDBD reactor, another lens (
 ) focused it onto a razor blade (Wilkinson, UK), which was used as the knife edge of the Schlieren aperture. The knife edge was oriented in such a way that vertical Schlieren images were obtained. All images were recorded by a commercially available camera (Canon EOS 6D) equipped with a zoom lens (Canon 24–105 mm f/4.0) and a resolution of 20 MP. For each voltage step the images were recorded with an exposure time of 5 ms after 5 min of operation.
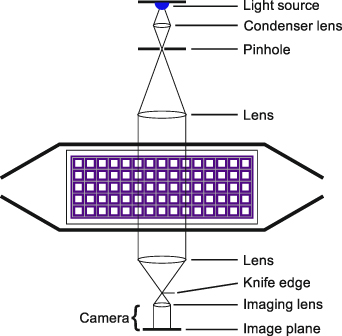
Figure 2. Schematic illustration of the lens-type Schlieren setup.
Download figure:
Standard image High-resolution imageThe recorded images were processed by using a MATLAB (MathWorks, Massachusetts, USA) script. The RGB (red, green, blue) images were converted into 256 bit grayscale versions. The resulting images were subtracted from a background image, which was recorded without plasma ignition. To increase the contrast, the final image was rescaled to the full 256 bit grayscale. The individual steps of the data processing are shown in figure S2.
3. Modeling methods
3.1. Geometry
The twin SDBD modeled in this work is based on the experimental setup described in section 2. For simplicity, we consider only the plasma chamber where the plasma discharge phenomenon is observed. The plasma chamber was defined as the computational domain for fluid flow and the dielectric medium positioned at the center as a solid domain to capture the plasma discharge effects. Due to the large difference in the length scales between the height of the electrodes and the length of the plasma chamber in the computational domain, 3D modeling is not viable and hence a 2D model along the flow direction was developed. The 2D model consists of a solid domain representing the dielectric medium and a fluid domain for the gas flow region as shown in figure 3.

Figure 3. 2D Model of the plasma chamber with fluid and solid domains.
Download figure:
Standard image High-resolution imageAn unstructured mesh was generated for the computational domain with enhanced meshing in both the solid domain to capture the electric field strengths between the electrodes, and the fluid domain near the electrodes to capture the flow details close to the electrodes. A total number of 342 410 mesh elements with a minimum mesh size of 2 μm were generated. Orthogonal quality was the mesh metric used to determine its quality. A value of 0.28 which lies in the 'good' range and above the 'acceptable' range in the ANSYS orthogonal quality mesh metrics spectrum was achieved [31].
3.2. Gas flow model
The simulation of gas flow inside the 2D model of the plasma chamber was carried out with N2 gas with an inlet velocity of 0.1 m s−1 corresponding to a flow rate of 10 l min−1 in the experimental setup. In order to capture the effects of convective heat transfer, it is assumed that density is a function of temperature only. Since the flow rate corresponds to the low Reynolds number flow regime, a laminar flow model was used, which solves the Navier–Stokes equations to obtain the velocity profile. The inlet velocity and atmospheric pressure were set as the inlet boundary condition and outflow boundary conditions at the outlet. The electrodes, dielectric surface and the walls are subjected to no-slip boundary condition. The governing equations for the fluid flow are described below.
Continuity equation
Momentum equations

3.3. Plasma discharge model
3.3.1. Governing equations.
The plasma discharge model for a twin SDBD is based on the simulation approach of plasma actuators used in aerodynamic applications [32]. A phenomenological body force model developed by Suzen et al was often used to study the plasma discharge effects on fluid flow in plasma actuators [33, 34]. In this model, it is assumed that the charges in the plasma have sufficient time to redistribute and the whole system is quasi-steady with no magnetic field effects. It is also assumed that the potential is decomposed into two parts: the potential due to the external field and the potential due to the net charge density. This results in the following two Maxwell equations, which solve for electric potential and charge density,

Furthermore, the electrohydrodynamic body force generated due to the plasma discharge is expressed in terms of charge density and electric field strength which are then coupled with the Navier–Stokes equations as an external body force acting on the bulk fluid [33, 34]. Experimentally, the plasma was ignited by a pulsed voltage input with a pulse repetition frequency of 4 kHz and voltage pulse amplitude of 7 kV–11 kV, which results in the generation of a pulsed body force. For the purpose of modeling and to investigate the plasma discharge effects on fluid flow, only the voltage amplitude of 10 kV was used. Jayaraman proposed a time-averaged body force model to calculate the instantaneous body force developed due to the pulsed discharge and is given in equation (8) [35],
The transfer of thermal energy in a plasma discharge resulting in gas heating occurs through multiple processes. The energy transfer occurs between electron and neutral species by elastic collisions, rotational, vibrational, and electronic excitation and also through collision between charged particles and neutral species, which result in gas heating at different timescales [36, 37]. Due to the complexity of the gas heating mechanism and to additionally incorporate the energy transfer into the plasma discharge model, the experimental data of power deposited during the plasma discharge was considered. In this approach, it was assumed that the power deposited during the plasma discharge process is utilized only in heating of the bulk fluid by means of heat flux from the electrodes. Here, the power deposited was assumed to be 45 W and is given as the source term on the electrodes. Thus, the energy equation is solved with an external heat source term,
3.3.2. Numerical implementation.
The literature study on fluid flow of plasma actuators and preliminary modeling efforts of the twin SDBD showed an accelerated flow with a local turbulence close to the electrodes. Hence, the laminar flow model was no longer valid. Therefore, simulations to focus on the mean properties of the flow and the effects of turbulence on the mean flow properties were performed using the Reynolds-averaged Navier–Stokes model. A k-ω shear stress transport (SST) model was used to capture the strong curvature of the flow and the rotational flow structures generated by the plasma discharge, both close to the electrodes and in the free stream. The momentum and the continuity equations were solved in a coupled manner using the pressure-based coupled solver feature in ANSYS Fluent. The Maxwell equations were solved simultaneously using user-defined scalar transport equations and user-defined functions in ANSYS Fluent [38, 39].
The boundary conditions were set similar to the gas flow model, and additional conditions were introduced for the Maxwell and energy equations. The upper side of the electrode configuration was the driven electrode, which was at the applied potential of 10 kV, and the bottom electrode and the reactor walls were grounded. The charge density and Debye length were defined along the plasma length. The charge density of 0.028 C m−2 was calculated from the electron density obtained from experiments carried out by Offerhaus et al [26] The remaining surfaces were subjected to zero flux condition. The inlet temperature was set to 300 K and no heat flux through the walls and the dielectric plate was introduced.
3.4. Gas flow model with heat effects
In order to study the gas heating effects on the fluid flow, a gas flow model with heat transfer mechanism through heat flux from the electrodes and without the body force model was developed. In this model, the Navier–Stokes equation and the energy equation with external heat source was solved simultaneously. The same boundary condition used in the model mentioned above was applied.
4. Results
4.1. Estimation of flow conditions based on reactivity with and without plasma
Previous investigations by Schücke et al [27, 28] and Peters et al [29] demonstrated that high degrees of conversion can be obtained with the presented SDBD reactor applied in the total oxidation of VOCs in synthetic air. As the plasma is limited to the surface of the SDBD electrode configuration (100 µm plasma height) and has a lateral extension of only a few millimeters, while the plasma-free volume is substantially larger, these high degrees of conversion must be due to significant radial mass transport. For this study the reaction of O2 traces with H2 was chosen as fast and thermodynamically highly favorable reaction with only a single product. Figure 4(a) shows the O2 mole fraction as a function of time in a gas mixture of 100% H2, while the applied voltage was varied between 7 kV and 11 kV. Subsequent to igniting the plasma after 5 min, the O2 mole fraction immediately decreased below 100 ppm. Even full conversion was achieved at applied voltages above 10 kV validating that the complete reactor volume can be treated by the SDBD. However, it is not possible to decouple the chemical activity of the plasma from its influences on the flow characteristics. Therefore, an electrode configuration coated with Pt nanoparticles was taken as a chemically active reference system without plasma. Pt-based catalysts are known to catalyze the reaction of O2 and H2 at ambient temperature [40]. Figure 4(b) shows the O2 mole fraction as a function of time in a gas mixture of 20% H2 passing over the Pt-coated electrode configuration. At the beginning of the measurement the reactor is bypassed and the gas mixtures directly passes through the online MCA. Subsequent to switching the SDBD reactor online after 10 min, a sharp decrease of the O2 mole fraction can be observed by flushing N2 out of the SDBD reactor. After another 10 min a stationary O2 mole fraction of 470 ppm was established. This qualitative comparison shows that despite the high catalytic activity of Pt-based catalysts only 6% conversion was achieved indicating that the system without plasma is strongly limited by mass transport phenomena.
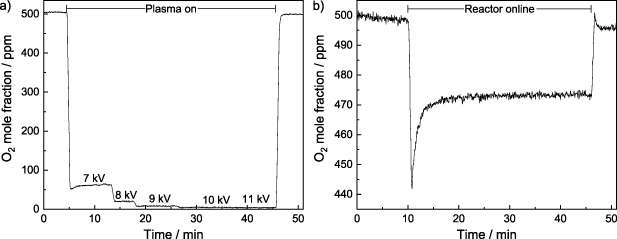
Figure 4. (a) Plasma-driven reaction of 500 ppm O2 in 100% H2 at a volumetric flow rate of 10 l min−1 in the SDBD reactor. The O2 mole fraction is shown as a function of time, while the applied voltage was increased from 7 kV to 11 kV. (b) Catalytic reaction of 500 ppm O2 in 20% H2 over an electrode configuration coated with Pt nanoparticles (150 µg cm−2) at a volumetric flow rate of 10 l min−1 in the SDBD reactor. The O2 mole fraction is shown as function of time without an applied voltage at ambient temperature.
Download figure:
Standard image High-resolution imageFurthermore, the Reynolds number Re was estimated to obtain a prediction of the flow conditions inside the reaction chamber without plasma using the hydraulic diameter of a rectangular tube. The results are summarized in table 1. It has to be noted that the Reynolds number only provides a rough estimate and that the exact reactor geometry as well as installed parts such as the electrode configuration are not properly considered. As the obtained Reynolds number are far below the critical Reynolds number  , it can be assumed that the flow inside the reaction chamber is laminar without plasma and that no significant gas mixing occurs perpendicular to the flow direction.
Table 1. Reynolds numbers derived for rectangular flow using the same inner dimensions as the SDBD reaction chamber (T = 293 K,  = 10 l min−1).
| Gas composition | Reynolds number |
|---|---|
| 100% H2 | 27 |
| 100% N2 | 193 |
The low conversion over the Pt-coated electrode configuration as well as the relatively low Reynolds numbers indicate that plasma may change the flow conditions leading to high degrees of conversion. Therefore, the influence of the plasma on the flow characteristics inside the reaction chamber was investigated by Schlieren imaging for a variety of reaction conditions and parameters.
4.2. Variation of gas composition
Schlieren images of the SDBD were obtained through the side window of the SDBD reactor in either 100% N2 or 100% H2 at a total volumetric flow rate of 10 l min−1. Measurements in the reaction gas mixture of H2, N2 and O2 showed analogous but less pronounced Schlieren structures and are excluded for the sake of simplicity. Figure 5 exemplarily shows Schlieren images of both gas mixtures at 11 kV (approx. 96 W). The SDBD electrode configuration can be seen in the middle of the images. The outlines are defined by the geometry of the side windows corresponding to the inner reactor wall at the top and the bottom and by the viewing angle of the lens at the right and left side. The gas flow was directed from left to right and passed above and below the electrode configuration. The positions of the metal grid lines perpendicular to the flow direction are indicated by vertical lines.
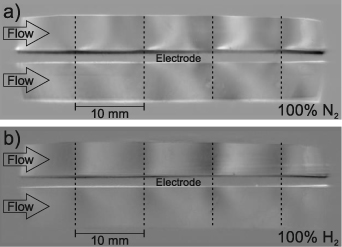
Figure 5. Schlieren images of the SDBD recorded through the side windows of the reactor for (a) 100% N2 and (b) 100% H2. The gas flow was oriented from left to right and the electrode configuration was in the middle. The positions of the grid lines perpendicular to the flow are indicated by dashed lines ( = 10 l min−1, fpul = 4000 Hz, Upp = 11 kV).
Download figure:
Standard image High-resolution imageFor both gas compositions Schlieren structures occurred above and below the electrode configuration covering the complete cross section of the reaction chamber. Even though the shape of the Schlieren structures was roughly comparable for both gas compositions, the intensity and visibility of the Schlieren structures decreased as a function of the H2 mole fraction, caused by a lower density gradient. This is counterintuitive, since the Gladston–Dale coefficient of H2 is higher than the one of N2, which would result in higher Schlieren visibility [41]. However, due to the higher thermal conductivity of H2, temperature and thus density gradients are less pronounced [42, 43]. As the Schlieren structures were most pronounced for 100% N2, all subsequent Schlieren images were obtained with this gas composition.
Therefore, a more detailed description of the Schlieren structures is provided for 100% N2. The starting points of the individual Schlieren structures correspond to the positions of the metal grid lines of the electrode configuration, which are parallel to the line of sight. This observation indicates that the Schlieren structures directly originate from the active plasma volume along the metal grid lines and that their extent is defined by the geometry of the electrode grid. The shape of the Schlieren structures is distinctly different above and below the Al2O3 plate. Bright parabolic structures almost resembling quarter circles occur above the electrode configuration and expand from the center of a metal grid line to the right and left side reaching the top of the reaction chamber in between two of the labeled metal grid lines. However, the Schlieren structures on the right side of a metal grid line are more pronounced and superimpose with the Schlieren structure from the following grid line in flow direction. Underneath rather straight Schlieren structures are formed pointing away from the Al2O3 plate at an angle of approximately 40°. The most dominant Schlieren structures follow the flow direction and are oriented from left to right reaching the bottom of the reaction chamber below the following metal grid line in flow direction, while Schlieren structures going in the opposite direction are hardly identified.
To obtain a more quantitative description of the Schlieren structures, line profiles for different positions above and underneath the electrode configuration were generated. The line profiles were obtained by plotting the intensity in the visible spectral range of the image along a line parallel to the Al2O3 plate as exemplarily shown in figure S3. Three different positions at 20%, 50%, and 80% of the height above or underneath the electrode configuration were chosen. Figure 6 shows the corresponding line profiles, which are in good agreement with previous observations. Above the Al2O3 plate the peak positions shift only slightly along the flow direction for the middle and most distant position in comparison to the nearest position, which corresponds to the parabolic shape of the Schlieren structures. In contrast, the intensity maximum below the electrode configuration is shifted in the flow direction, which is in good agreement with the linear Schlieren structures. Furthermore, it has to be noted that the Schlieren intensity of the peak and consequently the density gradient do not reveal a clear trend.
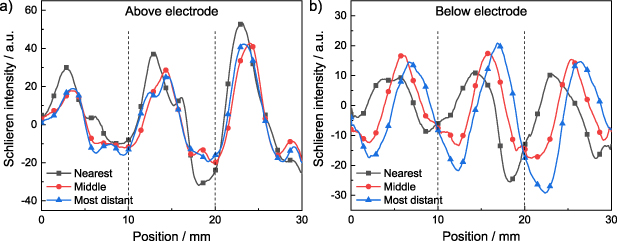
Figure 6. Line profiles of the Schlieren images at different positions at 20%, 50% and 80% of the height (a) above and (b) below the electrode configuration (background image subtracted). The positions of the grid lines perpendicular to the flow are indicated by dashed lines (100% N2,  = 10 l min−1, fpul = 4000 Hz, Upp = 11 kV).
Download figure:
Standard image High-resolution image4.3. Variation of applied voltage/dissipated power
For a more detailed evaluation Schlieren images were recorded for applied voltages between 7 kV (approx. 17.5 W) and 11 kV (approx. 96 W) at a pulse repetition frequency of 4000 Hz. A selection of these images is shown in figure 7. It has to be noted that all recording parameters such as the exposure time of the camera or the amount of light cut-off at the knife edge of the Schlieren aperture were kept constant during the variation of the applied voltage. Therefore, the obtained images and line profiles may be compared with regard to relative changes. It is obvious that the extent to which the Schlieren are visible is a function of the applied voltage and consequently of the dissipated power. At 7 kV only weak density gradients can be observed close to the surface of the Al2O3 plate. For applied voltages above 8 kV the shape of the Schlieren structures is identical to the one described in the previous section, but the visibility and intensity increases from 7 kV to 10 kV, while it is rather constant above 10 kV.
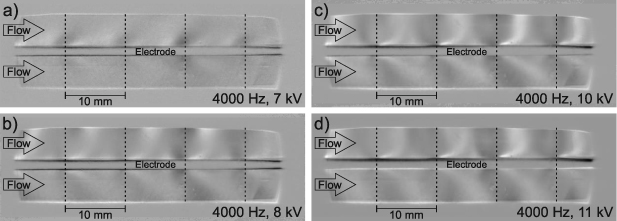
Figure 7. Schlieren images of the SDBD recorded through the side windows of the reactor for (a) 7 kV, (b) 8 kV, (c) 10 kV, and (d) 11 kV. The gas flow is oriented from left to right and the electrode configuration is in the middle. The positions of the grid lines perpendicular to the flow are indicated by dashed lines (100% N2,  = 10 l min−1, fpul = 4000 Hz).
Download figure:
Standard image High-resolution imageThese observations are supported by the corresponding line profiles at the most distant position above and below the electrode configuration (figure 8). Because the underlying trends are more prominent at the most distant position, in the following only these data are shown. The position of the peaks barely changes emphasizing the identical shape of the Schlieren regardless of the applied voltage. Only at 11 kV the peak maximum appears to be slightly shifted against the flow direction. On the other hand, the intensity of the peaks does not reveal a clear trend and the differences in intensity are rather negligible.
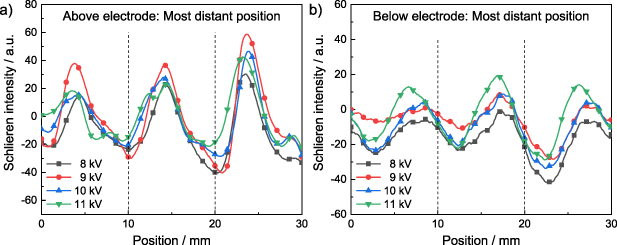
Figure 8. Line profiles of the SDBD for applied voltages between 8 kV and 11 kV at the most distant position (a) above and (b) below the electrode configuration. The positions of the grid lines perpendicular to the flow are indicated by dashed lines (100% N2,  = 10 l min−1, fpul = 4000 Hz).
Download figure:
Standard image High-resolution image4.4. Variation of volumetric flow rate
Another important parameter is the volumetric flow rate, which can influence the flow characteristics inside the reaction chamber as well as the performance of the SDBD in the oxidation of VOCs or other gas purification applications. Therefore, Schlieren images were recorded for volumetric flow rates between 5 l min−1 and 20 l min−1 as shown in figure 9.
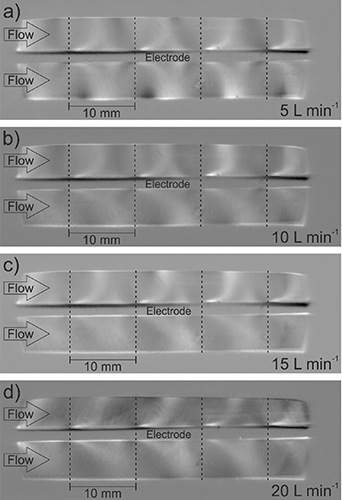
Figure 9. Schlieren images of the SDBD recorded through the side windows of the reactor for volumetric flow rates of (a) 5 l min−1, (b) 10 l min−1, (c) 15 l min−1, and (d) 20 l min−1. The gas flow is oriented from left to right and the electrode configuration is in the middle. The positions of the grid lines perpendicular to the flow are indicated by dashed lines (100% N2, fpul = 4000 Hz, Upp = 11 kV).
Download figure:
Standard image High-resolution imageThe shape and extent of the Schlieren structures on both sides of the electrode configuration was changed by the variation of the volumetric flow rate. Nevertheless, the Schlieren structures still covered the complete cross section of the reaction chamber. At a volumetric flow rate of 5 l min−1, the structures above and below the electrode configuration were more symmetric, as rather parabolic Schlieren structures can be observed for the bottom side as well, resembling the ones above the electrode configuration. An increase of the volumetric flow rate to 10 l min−1 or higher leads to the Schlieren shapes previously described. The Schlieren structures are distorted in the flow direction as a function of the volumetric flow rate, and rather straight Schlieren structures are obtained below the electrode configuration, which can be explained by the higher mean velocity of the gas. However, it has to be noted that the distortion along the flow direction also occurs above the electrode configuration, even though it is more pronounced on the bottom side of the electrode configuration. The parabolic shapes on the top side were maintained for all flow rates, but the point where they reached the inner reactor wall was shifted slightly in the flow direction.
The corresponding line profiles at the most distant position above and below the electrode configuration are in good agreement with the previous description of the Schlieren structures (figure 10). The peaks are slightly shifted in the flow direction to the left for volumetric flow rates of 15 l min−1 and 20 l min−1. The most notable deviation can again be observed below the electrode configuration for a volumetric flow rate of 5 l min−1, where the peak maximum is closer to the originating metal grid line. This correlates with the rather parabolic Schlieren structure.

Figure 10. Line profiles of the SDBD for volumetric flow rates between 5 l min−1 and 20 l min−1 at the most distant position (a) above and (b) below the electrode configuration. The positions of the grid lines perpendicular to the flow are indicated by dashed lines (100% N2, fpul = 4000 Hz, Upp = 11 kV).
Download figure:
Standard image High-resolution image4.5. Simulation
To allow better comparability with experimental Schlieren imaging, N2 was used for all theoretical flow simulations. Figure 11 shows the velocity profile at the center of the reactor for the 2D fluid flow simulation without the plasma discharge model. It can be observed that the flow follows a laminar profile for flow with and without heat transfer effects. The increase in mean velocity in flow with heat transfer model is due to the decrease in fluid density. It can be concluded from the velocity vector of fluid flow with heat transfer as shown in figure 12, that there is no vortex or eddy formation due to the presence of the electrodes and heat transfer effects.

Figure 11. Velocity profile of gas flow with and without heat effects.
Download figure:
Standard image High-resolution image
Figure 12. Velocity vector of fluid flow without the body force and only heat transfer effects. Velocity is reported in m s−1.
Download figure:
Standard image High-resolution imageFigure 13 shows the velocity vector of fluid flow for the plasma discharge model. It is observed that due to the electrohydrodynamic force, an accelerated flow is generated on both sides of the electrode, which imparts momentum to the fluid resulting in vortex formation. On the left side of the electrode, the body force generated by the plasma discharge accelerates the fluid away from the electrode against the bulk fluid flow direction and towards the free stream. Thus, a strong curvature in the fluid flow observed which is represented by the velocity vector in figure 13. It is due to the opposite direction of inertial force and the electrohydrodynamic force, which eventually evolves into a vortex structure. On the right side of the electrode, the generated body force due to plasma discharge accelerates the fluid away from the electrode towards the free stream, in the same direction as the bulk fluid flow. Since the direction of inertial force and electrohydrodynamic force are in the same direction, no vortex-like rotational structure is found.

Figure 13. Velocity vector of fluid flow for the plasma discharge model. Velocity is reported in m s−1.
Download figure:
Standard image High-resolution imageThe synthetic Schlieren image was generated using PARAVIEW by calculating the gradient of the density and comparing it with the experimental Schlieren images. The Schlieren structures generated along the x- and y-direction are shown in figures 14 and 15, respectively. It can be observed that the density gradient along the x-direction closely resembles the Schlieren image obtained from experiments with respect to the position of dark and light shade regions. For the top side of the electrode configuration in figure 14, density gradients of high intensity are observed above the configuration indicating a sharp change in density from top to the sides of the electrode. This high density gradient can be attributed to the movement of unreacted species from the bulk fluid to the reactive plasma region of low density. Density gradients of low intensity are observed on both sides of the configuration, which can be attributed to the movement of highly reactive species due to the electrohydrodynamic force generated by the plasma discharge away from the electrodes. Thus, the density gradients observed is a combined effect of density change due to plasma discharge process accompanied by the strong electrohydrodynamic forces along with the gas heating effects. Comparing the synthetic Schlieren images with the experimental ones shows that the position of the dark and light shade regions are similar, but in the experiment to a lesser extent. The experimental Schlieren images show that the light shade region extends until half the distance to the adjacent gridline, whereas the light shade region in the simulated Schlieren images covers less distance and the effect is observed most strongly close to the electrode. This deviation in the extent of the plasma discharge could be due to the cumulative effect of the electrohydrodynamic force occurring in a 3D structure in all directions, which is not completely described by modeling the plasma through a simplified phenomenological model.
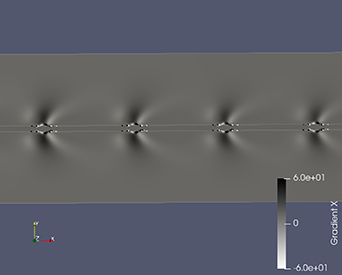
Figure 14. Synthetic Schlieren image obtained from the simulation. Density gradient along x-direction.
Download figure:
Standard image High-resolution image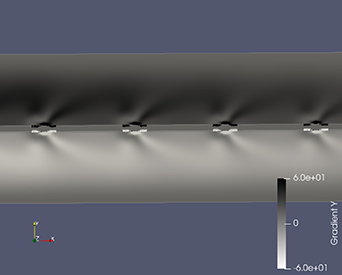
Figure 15. Synthetic schlieren image obtained from the simulation. Density gradient along y-direction.
Download figure:
Standard image High-resolution image4.6. Intentional deposit formation
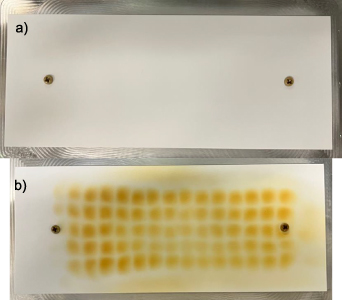
While the deposition of residues is often an adverse side effect, it can also yield valuable information about underlying phenomena. Deliberate deposit formation can be used to gain information about flow conditions and transport phenomena similar to PIV. Thus, we used the intentional toluene decomposition to qualitatively visualize the radial flow behavior induced by the plasma discharge. A gas flow (60% H2, 40% N2, 1000 ppm O2, 10 slm) additionally containing 200 ppm of toluene was fed into the reaction chamber where a plasma was ignited (20 W–90 W) for several hours on stream. An alumina plate was positioned at the reactor lid onto which a viscous, tar-like yellowish substance was deposited. A photo of the alumina plate before and after the plasma ignition is shown in figure 16.
Figure 16. Photographs of the alumina plate positioned on the reactor lid. (a) Before reaction. (b) After reaction showing a clear deposition pattern.
Download figure:
Standard image High-resolution image
Figure 16 shows an emerging grid pattern, which corresponds well to the metal grid of the electrode configuration. The ordered deposition of carbonaceous residues originating from toluene decomposition in the plasma clearly confirms radial mass transport from the electrode configuration to the reactor lid. The movement of the particles is induced by the force of the bulk gas as shown by the simulations. Charging individual particles or droplets of the deposit and subsequent acceleration by the electric field seems unlikely, because it would create this grid pattern only above the powered side. However, this pattern also emerged on the bottom of the reactor without a potential difference relative to the reactor walls (not shown).
5. Discussion
The results of the Schlieren imaging show that the flow characteristics along the SDBD electrode configuration inside the reaction chamber are significantly altered by the plasma discharge. The individual Schlieren structures originate at the positions of the metal grid lines perpendicular to the flow direction of the gas stream and cover the complete cross section of the reaction chamber. Without the plasma the flow in the reaction chamber is shown to be laminar. This assumption is supported by several considerations: the low Reynolds numbers, the low conversion observed for the Pt-coated electrode configuration without plasma, the computational fluid dynamics (CFD) simulation where the electrode configuration merely heats the gas stream and no vortex formation is observed, and the regular deposition pattern on the alumina plate positioned at the reactor lid. Therefore, the high conversion achieved in the plasma-assisted reaction of O2 traces with H2 can only be rationalized by the alteration of the flow characteristics by the plasma resulting in radial gas mixing. The intensity of the Schlieren increases as a function of the applied voltage from 7 kV to 10 kV that corresponds to the dissipated power and thereby follows the same trend observed for the degree of conversion reported by Peters et al [29] and Schücke et al [27] for the oxidation of VOCs. Hence, it can be assumed that the enhancement of the activity is not only caused by the higher dissipated power and electron density [26, 30], but also correlated with the changed flow characteristics. This assumption is further confirmed by the fluid dynamics simulations, where vortex formation was observed, when the electrohydrodynamic force was incorporated.
For a more detailed evaluation of the plasma-induced mass transport and its implications on the gas-phase reactions, different effects have to be discussed, which may lead to the formation of the Schlieren structures and determine their shape and extent. A superimposition of several effects is proposed to explain the asymmetry of the Schlieren on the top and bottom sides. It has to be noted that the observed Schlieren structures are always an overlap of several metal grid lines perpendicular to the flow direction, which may influence each other. Furthermore, the effect of metal grid lines parallel to the flow direction is not accessible to simulation and Schlieren imaging, even though these grid lines may also influence the flow characteristics and interact with the grid lines perpendicular to the flow direction. Nevertheless, the effect of all gridlines is visualized by the emerging deposition pattern on the alumina plate positioned at the reactor lid caused by toluene decomposition in the plasma.
One of the potential effects for the formation of the observed Schlieren structures may be the repulsion of accelerated species out of the plasma volume and away from the metal grid line. This effect would be directed against the flow direction on the left side of the metal grid line and in flow direction on the right side, which results in the observation of Schlieren structures on both sides of the metal grid lines perpendicular to the flow direction. This assumption is supported by the simulations, which show the described velocity field. Another effect causing the formation of the Schlieren structures may be thermal expansion from the active plasma volume into the volume of the reaction chamber away from the metal grid line. Consequently, these effects are directed upwards on the top side, while it is directed downwards on the bottom side. However, as it was highlighted by the simulations, the thermal force alone is not sufficient to induce the vortex formation. Nevertheless, its influence on the overall Schlieren image is present.
The formation of the density gradients is in good agreement with the increase of the average gas temperature in the active plasma volume shown by Offerhaus et al [26]. Due to the higher gas temperature, density gradients are enhanced, while the shape of the Schlieren remains almost unchanged, suggesting that the observed Schlieren structures are induced by the increased gas temperature. This hypothesis is supported by Shimizu et al [44] reporting that for DBDs changes of the refractive index are primarily associated with gas heating. In this context ion momentum transfer may be neglected for DBDs, while it cannot be excluded for the SDBD as discussed in the following. The heated gas may also experience thermal buoyancy, which is directed upwards on both sides of the Al2O3 plate. Another effect is caused by the gas flow itself, which distorts the Schlieren in the flow direction. The strength of this distortion is directly correlated with the mean velocity of the fluid. An electrohydrodynamic effect is caused by the potential difference between the powered side of the electrode configuration and the grounded reactor wall. Due to the additional electrical field, ions or other charged species are extracted from the plasma volume and accelerated towards the grounded reactor wall.
Based on these hypotheses regarding Schlieren formation, an attempt is made to specify the location of VOC oxidation as well as the reaction between O2 traces and H2. In general, two scenarios are possible: either the reactive species are transported from the active plasma volume to the bulk gas phase, or the flow characteristics are altered in such a way that the complete gas phase is brought into contact with the active plasma volume. In the first scenario, the reaction occurs over the complete cross section of the reaction chamber. This is supported by the observation that a change of the electrohydrodynamic effect influences the shape of the Schlieren indicating that charged species are extracted from the active plasma volume. However, the lifetime of proposed reaction intermediates such as atomic oxygen O or the hydroxyl radical OH is rather short. Based on ground-state oxygen atoms and OH radicals, Kim et al [45] calculated that short-lived species generated in the plasma have an interaction length of only 50 μm, which is far too small to cover the complete reactor cross section. Therefore, a volume effect, in which the reaction takes place in the complete reaction chamber, is considered unlikely. Nevertheless, it cannot be excluded that reactive species are extracted into the bulk gas volume, or that other reaction pathways based on long-lived species such as O3 or NOx may contribute as well. For the reaction of O2 traces with H2, the presence of long-lived species is less likely, because the O2 mole fraction is relatively low.
In the second scenario, VOC oxidation as well as the reaction between O2 traces and H2 only take place in the active plasma volume. Peters et al [29] showed that the application of a catalytic coating of MnO2 in the free space in between the metal grid of the electrode configuration significantly improved the CO2 selectivity of the SDBD in the total oxidation of VOCs. As the catalyst was only applied to the surface of the Al2O3 plate, this observation can only be explained by a pronounced mixing of the gas phase, so that a large fraction of the gas flow can interact with the surface of the catalyst. This further supports the second scenario, because a chemical reaction occurring over the whole cross section of the reactor would be barely influenced by a catalyst at the surface of the electrode configuration. Moreover, the transport of toluene decomposition products to the walls of the reactor demonstrates substantial mass transport.
For further evaluation, extensive 3D simulations of the complete plasma chemistry would be necessary, which are beyond reach. PIV based on Mie scattering may give additional experimental insight in the flow characteristics and is planned for the future. Furthermore, the densities of atomic oxygen or atomic hydrogen may be detected at varying distance from the electrode configuration by two-photon laser-induced fluorescence to assess whether reactions in the bulk gas phase are likely to occur.
6. Conclusion
Schlieren imaging was used to investigate the flow characteristics inside the SDBD reaction chamber to rationalize the high conversion achieved in the plasma-assisted reaction of O2 traces with H2. Without the plasma discharge a conversion of only 6% was achieved in the SDBD reactor equipped with a catalytically active Pt-covered electrode configuration indicating mass transport limitations under these conditions. This hypothesis is further supported by the determined Reynolds number of 193 for the SDBD reaction chamber in 100% N2, which is associated with laminar flow conditions, as shown in the reference simulation in which the electrode is merely heated. In contrast, full conversion was achieved for the plasma-assisted reaction. With the plasma, Schlieren structures originating from the center of the metal grid lines were monitored, which covered the complete cross section of the reaction chamber not only in 100% N2, but also in H2/N2 mixtures and 100% H2. In this way, the plasma induced radial mass transport, which is necessary to achieve high degrees of conversion, because the active plasma volume is limited to the surface of the electrode configuration and the flow conditions without plasma are laminar. Simulations show that the dominant effect of the plasma-induced mass transport is the electrohydrodynamic force generating vortices which in turn lead to pronounced gas mixing perpendicular to the flow direction. The mass transport is further visualized by carbonaceous deposits on the reactor lid created by toluene decomposition in the plasma volume. It is assumed based on the performed simulations that the extent of the mass transport and the shape of the observed density gradients is determined by a superimposition of several effects, comprising repulsion and thermal expansion from the plasma volume away from the center of metal grid line of the SDBD, thermal buoyancy, and the electrohydrodynamic force generated by the plasma discharge.
Acknowledgments
We want to thank Achim von Keudell and Soad Mohsenimehr for their valuable comments and fruitful discussions. We gratefully acknowledge the financial support received from the German Research Foundation (DFG) within the Collaborative Research Centre CRC1316 'Transient atmospheric plasmas: from plasmas to liquids to solids' (Projects A7 and B5) and from the German Federal Ministry of Education and Research (Bundesministerium für Bildung und Forschung, BMBF, Verbundvorhaben Carbon2Chem® L3 03EK3040B 'Gasreinigung' Teilvorhaben RUB: 'Einsatz von nicht-thermischem Plasma zur Gasreinigung'). Kevin Ollegott acknowledges financial support by the Fonds der Chemischen Industrie.
Data availability statement
The data cannot be made publicly available upon publication because they are not available in a format that is sufficiently accessible or reusable by other researchers. The data that support the findings of this study are available upon reasonable request from the authors.
Supplementary data (0.5 MB DOCX)