
Abstract
The behaviour of partial discharge has been examined for unipolar turn-to-turn-like waveforms with short 10%–90% rise-times of approximately 25 ns. Such waveforms simulate what may be seen between turns on random-wound inverter-fed electrical machines driven by ultra-fast switching wide-bandgap power semiconductors. The influence of pressure, voltage polarity, and pulse duration was examined, with particular focus on environments relevant to aerospace. Pulse waves were observed to generate distinct partial discharge behaviour relative to square waves, with important implications for detection and lifetime assessment. Partial discharge likelihood for pulse waves at a given voltage was reduced, with comparable discharge activity requiring an additional several hundred volts at both ambient pressure and 116 hPa. Partial discharge events typically occur sooner after voltage rise for shorter duration pulses, whereas discharges occasionally occurred over 1 ms after voltage rise for longer-duration 10–100 Hz square waves at lower pressures, which may be outside the window of detection of some instrumentation. While observations and stochastic behaviour were interpreted within the context of space charge and the latest understanding of Volume-Time theory, some observations have not been able to be accounted for. These include observed stochastic trends between partial discharge delay time and unipolar pulse duration not correlating well, a reduced delay between voltage change and partial discharge activity during voltage fall relative to rise, and the lack of observed partial discharge activity after voltage fall for unipolar voltage pulse durations less than 50 µs.
Export citation and abstract BibTeX RIS

Original content from this work may be used under the terms of the Creative Commons Attribution 4.0 license. Any further distribution of this work must maintain attribution to the author(s) and the title of the work, journal citation and DOI.
1. Introduction
The behaviour of partial discharge in machine insulation during the application of fast-switching converter voltage waveforms of inverter-fed machines is not fully understood. When the insulation system is subjected to short rise-time voltage waveforms, determining the probability and magnitude of partial discharge is more difficult—particularly in aerospace environments at low pressure.
Two situations have been identified that can lead to an increased chance of partial discharge activity. Firstly, the use of fast switching converters can often generate overshoots of tens to hundreds of nanoseconds duration at voltage transitions due to impedance mismatches between the motor terminals and power supply, with DC bus voltage doubling being possible [1–6]. The magnitude and duration of such overshoots—in particular, the often greater first peak overshoot—has been attributed to exceeding partial discharge inception voltage, increased partial discharge activity, and reduced insulation lifetime [7]. Secondly, the potential difference that can exist between two turns of a coil winding of an electric motor during the propagation of a short duration voltage pulse can be considerably greater in magnitude relative to the steady-state voltage distributions expected in line-fed machines. This results from a nonlinear voltage distribution along the wire for transient voltage pulses where the peak pulse duration is much shorter than the full-length propagation time for the pulse. This can be enhanced if the coil is random wound [8–11], as early turns may be adjacent to end turns.
There is an associated risk of partial discharge for each voltage transition [12], and as such, switching at increased frequencies in the kilohertz range can also increase the corresponding damage rate. The partial discharge response of the turn-to-turn insulation system in a machine cannot easily be tested by conventional procedures [13] but is arguably more important than the phase-to-earth insulation system, given the ease by which extra insulation like slot liners can be added without a significant reduction in power density.
Understanding how the duration of voltage application influences the likelihood and frequency of occurrence of partial discharge events is thus critical. Laboratory experiments have been carried out to understand the partial discharge behaviour of an effective turn-to-turn insulation system exposed to very short rise-time and duration unipolar voltage pulses, under conditions relevant to aerospace environments. These have been compared to behaviour seen in longer duration square waveforms typical of inverter phase-to-earth insulation systems. The influence of pressure, voltage polarity, and pulse duration has been systematically explored for corona resistant wires. An understanding of the partial discharge phenomena has been sought, with observations interpreted in terms of space charge and current theoretical models of partial discharge physics.
2. Experimental design
Turn-to-turn-like pulse waveforms with very short rise times were generated using the circuit shown in figure 1. Power was supplied using two 15 kV Glassman DC power supplies, and a Behlke GHTS 100 fast switch allows rapid polarity switching of the sample by discharging capacitors Cs. Resistors Rc limited the maximum current being supplied from the DC supplies and Rf limited the peak current flowing through the switch while also controlling the rising front voltage profile. Frequency was controlled using a square wave signal generator fed into the fast switch. The peak voltage of the pulses generated ranged in duration from 50 ns to 50 ms.

Figure 1. Schematic and circuit diagram of experimental setup.
Download figure:
Standard image High-resolution imageTesting was carried out in a screened room that has low background noise levels of approximately 200–500 fC when testing is carried out with an IEC 60270 [14] type circuit. Test samples consisted of twisted pairs of Vonroll FO 180 polyimide-film insulated winding wires (core diameter 1.0 mm and insulation thickness 75 μm), prepared according to IEC-60851 [15] with 16 twists. Samples were housed within a pressure vessel with appropriate high voltage connectors. A Vacuubrand CVC 3000 vacuum controller was used with a Hanning Elektro-Werke vacuum pump to evacuate a pressure vessel. Voltage applied across the samples was measured using a 1 GHz, 10 GS s−1 LeCroy Oscilloscope 104Xi via a VD60 voltage probe. Voltage rise-times (10%–90%) were measured to be approximately 25 ns (figure 2(a)). Typically, only a single overshoot was present (figure 2(b)), without ringing, with a magnitude typically 200–400 V above nominal, albeit for only approximately 20 ns, which is at least an order of magnitude shorter than found in similar experimental studies (e.g. [7, 16]), minimising the influence on partial discharge activity. Partial discharge was detected using a radio frequency antenna with a 600 MHz Mini-Circuits high pass filter eliminating noise from the switching of the power electronic circuit.
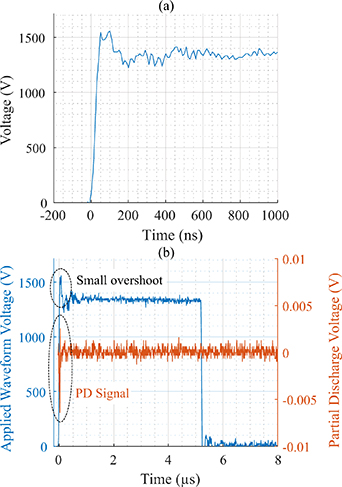
Figure 2. (a) Typical voltage waveform showing rise time; (b) example applied voltage and partial discharge waveforms.
Download figure:
Standard image High-resolution imageThe scope was set to trigger on the rising (or falling) edge of voltage waveforms and partial discharge was classified as being of amplitude twice the average peak background levels. Partial discharge likelihood as a function of voltage amplitude was measured by detecting the percentage of one hundred sequential voltage pulses that generated a discharge event. Partial discharge time delays were assessed using post-processing code to measure time between voltage rise (or fall) and the detected partial discharge for at least 100 discharge events per experiment.
3. Experimental observations
Figure 3 shows how the measured likelihood of partial discharge scaled with unipolar peak-to-peak voltage magnitude as a function of waveshape, pressure, and voltage polarity. Data was captured using 100 Hz waveforms; pulse waves had a 10%–90% rise-time of approximately 25 ns and peak voltage duration of approximately 50 ns, and square waves had a 50% duty cycle. The partial discharge inception voltage, that is, the lowest voltage at which partial discharge could first be observed as voltage increases from zero, reduced with pressure as expected (e.g. [17–20]). Of noteworthy interest, however, were the following observations:
- At even the shortest duration of voltage pulse, partial discharge was certain with a sufficiently high electric field strength.
- Voltage waveform and duration influences inception voltage at lower pressures associated with flight altitude. Inception voltage was 600–900 V lower for the longer duration square waves relative to shorter duration pulse waves, whereas there was no significant difference at ambient pressure. However, the relative difference in the repetitive partial discharge inception voltage (the voltage at which 50% of the pulses generated partial discharge) between waveform types, was small.
- Partial discharge probability profiles were comparable between polarities at given conditions. At low pressure, the repetitive partial discharge inception voltage was approximately 100–200 V lower than for positive voltage for both square and pulse waves, but was reversed at higher, ground-level pressure.
- Lower pressure also resulted in a more rapid transition from 0% to 100% of pulses producing partial discharge as a function of voltage. At ambient pressure, shorter duration pulse waves demonstrated a much more gradual onset relative to square waves and spanned a wider voltage range.

Figure 3. Profiles of partial discharge onset with increasing unipolar peak-to-peak voltage, as a function of wave shape, voltage polarity, and pressure, with 90% confidence intervals shown. Voltage frequency was 100 Hz and pulse waves had a 10%–90% rise-time of approximately 25 ns and peak voltage duration of approximately 50 ns.
Download figure:
Standard image High-resolution imageThe influence of voltage magnitude on the delay between the rapid voltage rise above the background floor and the occurrence of partial discharge was measured for 50 ns peak voltage positive pulses at ambient pressure (figure 4). The modal discharge delay time reduced with increasing voltage. Similarly, the influence of pressure on partial discharge delay was measured as a function of pulse duration (figure 5). During the time period in which the applied voltage is above zero, lowering pressure results in the broadening of the time delay distribution, particularly for longer duration voltage pulses. Attempts were made to maintain applied voltage between 10%–15% for a given pulse duration between pressure levels, based on when partial discharge activity became reliable; the exception being for 50 ms square waves where substantial partial discharge activity occurred at much lower voltages at lower pressure, preventing the higher voltages used at higher pressures from being applied. In the case of 50 ms square waves at lower pressure, partial discharges at low pressure could occur more than 1 ms after the application of the voltage pulse, which is many orders of magnitude longer than the rise-time of a few tens of nanoseconds.

Figure 4. Histograms of time delays between voltage rise and partial discharge activity as a function of peak voltage magnitude for 50 ns peak voltage positive pulses at 100 Hz at ambient pressure.
Download figure:
Standard image High-resolution image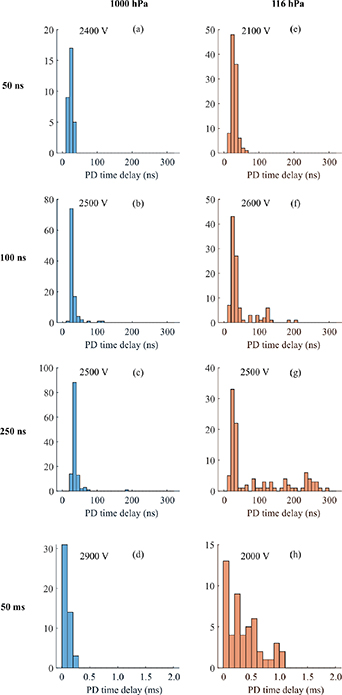
Figure 5. Histograms of time delays between voltage rise and partial discharge activity as a function of pulse width and pressure for positive unipolar pulses at 10 Hz.
Download figure:
Standard image High-resolution imageThe time between voltage rise and the occurrence of partial discharge was measured as a function of pulse duration and voltage polarity (figure 6) at 100 Hz and ambient pressure for 100 measured partial discharge events during continuous waveform cycles. Voltage level was set to ensure 15%–20% of pulses generated partial discharge. Partial discharge was also generally observed to occur after the falling edge and voltage had returned to zero. Such partial discharge events were also examined separately in these tests. Key observations included the following:
- While increasing voltage pulse width allowed greater time delays between voltage onset and partial discharges, as might be expected, the distributions are not simply broadened. Longer voltage pulse durations (all with comparable rise-times) appear to significantly reduce the likelihood of discharge activity sooner after voltage onset. The distribution of partial discharge delay times typically spans no more than three decades of time prior to the voltage fall, until pulse durations reach the 500 ns duration.
- Partial discharge delay times are generally symmetric with voltage polarity.
- The temporal behaviour of partial discharges occurring after voltage returns to zero is distinct from those occurring after voltage rise. Distributions are broader and delays typically shorter. Shorter duration pulses encourage more rapid discharge after voltage fall. No partial discharge was observed after voltage fall when pulse durations were less than 50 µs.
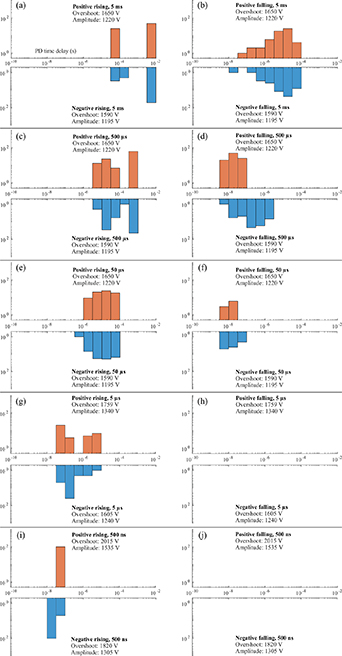
Figure 6. Histograms of time delays between voltage rise/fall and partial discharge activity as a function of pulse width and voltage polarity at 100 Hz and ambient pressure. Corresponding voltage peaks and amplitudes are shown.
Download figure:
Standard image High-resolution imageThe magnitudes of all partial discharges were also measured in this set of experiments and are shown in figure 7. The partial discharge magnitudes of square waves were generally lower than those of shorter duration pulse waves. Reducing voltage pulse duration broadened the distribution and resulted in the occurrence of some higher magnitude discharges. Partial discharge magnitude was generally symmetric with polarity, except at pulse durations of 500 ns, where there was a very strong deviation and positive polarity voltages produced much larger partial discharge magnitudes. For both positive and negative applied voltage, and for each pulse width, the polarity and magnitude of partial discharges was generally symmetric, again except at shorter pulse widths of 500 ns for positive applied voltages, where strong negative partial discharges dominated.
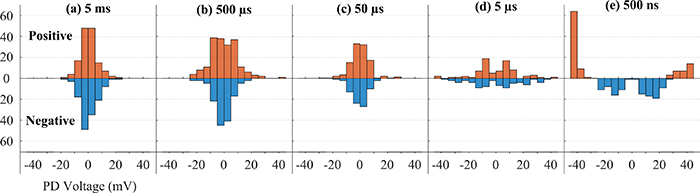
Figure 7. Histograms of partial discharge magnitudes as a function of pulse width and voltage polarity at 100 Hz and ambient pressure.
Download figure:
Standard image High-resolution image4. State of knowledge of partial discharge
4.1. Models of partial discharge
The properties of short rise-time voltage waveforms, representative of the short turn-turn voltage pulses that could be expected in fast switching converters, were examined under conditions representative of aerospace environments to attempt to learn more about the fundamental nature and behaviour of partial discharge. Two predominant models of partial discharge behaviour can describe much of what is observed here.
Firstly, expanding on the model of Patsch and Berton [21], Fabiani et al [22] outlined an idealised conceptual model for the temporal relationship between electric field and partial discharge activity for perfect square wave voltage waveforms (no higher frequency oscillations, ringing, and overshoots etc) in the air gaps between two wires in the presence of space charge. The model qualitatively describes the initiation of partial discharge requiring an electric field strength above the dielectric strength of air and subsequent inception of an electron avalanche following the Townsend breakdown process [18]. The increasing electric field during the rise of a voltage wavefront eventually meets this criterion and the partial discharge transfers charge between surfaces, partially reducing the net local electric field strength. The deposited heterocharge can recombine over time, gradually restoring the pre-partial discharge local electric field. Repeated partial discharge events during voltage waveform cycling are governed by the magnitude of the peak-to-peak voltage change being sufficient to restore the net electric field strength above the inception field threshold. Many other factors complicate space charge recombination and the temporal behaviour of the net local electric field strength, including charge trap depth, insulation surface conductivity, and charge mobility. Many of these relate to properties of the coating materials and surface condition.
While Paschen's law is often used to calculate breakdown voltage, it can only reasonably be applied in the presence of uniform fields and quasi-static conditions. This is often not representative of many systems of interest in which divergent fields are present and electrodes have insulation coatings with a greater work function than a bare electrode (9 eV compared with 4–5 eV for copper [23]), affecting the likelihood of secondary electron emission from positive ion or UV bombardment. As such, the more fundamental streamer inception criterion must be considered, and corresponding models incorporating this have been developed. The probability of partial discharge occurring can be quantitatively computed as a function of electrode geometry, pressure, and voltage waveform using Volume-Time theory. This physics first principles model derives from physical models of discharge breakdown processes [18, 24–28] and had initial application predicting breakdown in SF6 gas from uncoated electrodes under lightning impulse and fast transient voltages [29–32]. While many subset models considering streamer inception allow for the spatial aspects of the breakdown phenomenon—typically seen with AC sine waves, Volume-Time theory allows the stochastic and temporal aspects of breakdown for short duration pulses and very short rise times to be captured. More recently, this has been developed further to incorporate the influence of surface emission [33]. The model considers collisional electron detachment processes from gas ions in the gap and is expressed in the form of a Weibull cumulative distribution function to estimate probability of the formation of a critical avalanche within a critical volume:
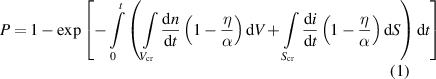
where:
-
 is the probability of generating a critical avalanche—one containing the critical electron number in the avalanche head, allowing survival and propagation to the electrode.
 -
and are the critical volume and critical surface, respectively.
-
and are the rates of detachment within the critical volume and from the critical surface, respectively.
-
and are the ionisation and attachment coefficients, respectively.


When the computed probability from (equation (1)) reaches a value of 63.2% (the scale parameter of the Weibull distribution representing the modal peak of the corresponding derivative probability distribution function, and greatest likelihood), the corresponding voltage generating the fields is defined as inception and is associated with one initial detachment electron generated within the critical volume. The critical volume and critical surface represent regions—the boundaries of which can be determined using finite element analysis, as discussed below—where the electric field strength is high enough to allow multiple collisions and grow an avalanche. The area of the critical surface is assumed to be the region of the coated earth electrode in contact with the critical volume.
Electrical breakdown in air is generally assumed to occur, for all conditions under consideration, when the number of electrons in the tip of the avalanche reaches a critical value of 108 [23]. The distance a growing avalanche travels along a line of electric force when it reaches the critical number of electrons, is called the critical electron drift path length,  . In general, the number of electrons at the tip of the avalanche,
  , at distance
  from starting location, is [34]:
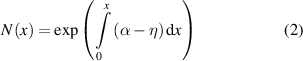
where  is the effective ionisation coefficient—the difference between ionisation and attachment coefficients, representing sources and sinks of electrons. Values above zero represent net electron contribution to the avalanche tip and thus propagation.
The critical volume,  , must satisfy the Schumann criteria for streamer transition during the electron avalanche process [34]—namely that the integrated sum of the effective ionisation coefficients over the critical path length, is constant:
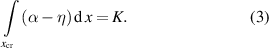
 is assumed to be equivalent to the gap length between electrodes and that electrons take a linear trajectory [33]. The effective ionisation coefficient is empirically determined for a given gas type by knowing the gas pressure,
  (MPa) and electric field strength,
  (kV mm−1). Many studies have shown that
  does not have a value of 18 for air
  [35–37], but varies depending on the specific system under test, indicating the importance of conducting corresponding experimental measurements of partial discharge inception voltage and computing this value [38] using finite element analysis [33, 39]. Many parameterisations necessary for this computation (or empirical data from which such expressions can be derived) exist for the effective ionisation coefficient, spanning the appropriate range of electric field strength and pressure [40–42], for example [41]:
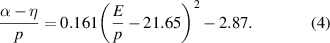
The applied electric field strength must be above a critical electric field strength,  , of approximately 21.65 kV mm−1 MPa−1 for dry air in this example [41].
In (equation (1)), the rate of detachment in the air volume is determined by the density of  ions,
ions,  (approximately 150 cm−3 at standard temperature and pressure [43]), scaled by the detachment coefficient,
  (µs−1):
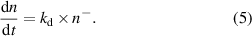
 is determined by the overvoltage ratio,
  , representing how many factors of the critical electric field strength are applied. This readily saturates as a function of electric field strength [33].
The rate of electron detachment from the earth electrode insulation surface is calculated from field emission theory, relying on emissions from both protrusions in the cathode surface (described by Fowler–Nordheim theory in quantum mechanics), as well as from insulation impurities, deposits, or trap levels in the presence of a high electric field [43]:
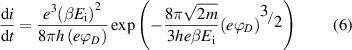
where:
-
is the electron charge.
-
is the field enhancement factor.
-
is the electric field strength applied to the insulation.
-
is Planck's constant.
-
is potential barrier height.
-
is the effective electron mass.


All terms of (equation (1)) are ultimately functions of the electric field strength and air pressure, and it is this understanding which informs interpretation of the experimental observations presented.
4.2. Stochastic behaviour of partial discharge
Partial discharge behaviour is observed to be stochastic for both pulse and square waves, manifesting in three cases:
- Case 1.Partial discharge only sometimes occurs after voltage change.
- Case 2.Multiple partial discharge events occur on some cycles (not explicitly investigated here).
- Case 3.Partial discharge occurs at variable times after voltage change has occurred.
Case 1 is principally accounted for by considering both magnitudes of resulting local electric fields and the influence of space charge, as well as sources of initial electrons. A partial discharge event transfers charge between surfaces, setting up a counter electric field and reducing net local electric field strength. When voltage polarity reverses (or returns to zero in the case of unipolar waveforms), the electric field component from the charge transferred supplements the external field contributed by the voltage change [22]. If the net electric field strength remains below the inception field, a discharge event will not occur during that cycle, accounting for some variability in discharge occurrence. The magnitude of charge transferred during the partial discharge event, as well as the factors affecting the deposited space charge decay, are the controlling factors. Furthermore, for unipolar waveforms, as used here, it is already established that the deposited heterocharge can reduce net fields, raising inception voltage [22, 44, 45], and reducing subsequent discharge likelihood. Long term exposure of a sample to unipolar waveforms, giving a substantial DC field component, can inject homocharge from the electrode into deeper traps where depolarisation takes longer, acting to partially reverse the influence of heterocharge and reduce inception voltage [22], although testing was not sufficiently lengthy for that effect to be noted here.
Fabiani et al [22] also occasionally observed two partial discharge events in a given half cycle of a square wave (case 2) at low frequency (approximately 10 Hz) when square wave peak voltage is sustained for a relatively longer time. After a discharge event, space charge decay from shallow traps—which is more rapid for materials with higher surface conductivity—restores the local field within the half cycle, taking the net electric field above the inception field and allowing a second discharge.
The presence of space charge (electrons and positive and negative ions) has strong influence on the repetition of partial discharge events. Often partial discharge activity is observed to be intermittent when fields are first applied [44], particularly for bipolar waveforms, and as space charge is subsequently deposited from earlier discharge activity, the frequency of partial discharges may increase. This is frequently observed in the laboratory during initial experimental testing when inception voltage is higher than for subsequent tests within a short space of time, and the reason why partial discharge extinction voltage magnitudes are lower than inception. The increased presence of negative ions in the gaps and on the surface can serve as sources of initial electrons [46], which if present within the critical volume, will incept an avalanche. Case 3 is discussed in sections 5.2 and 5.3.
5. Discussion
5.1. Influence of environmental conditions
Several studies have examined partial discharge activity using square wave voltage waveforms (e.g. [7, 22, 46]) with a range of frequencies and duty cycles. With sustained peak voltages of the order of at least 100 µs, it was observed that frequency and total duration of exposure to voltage had little impact on partial discharge inception voltage, leading to the conclusion they did not have first order influence. Fabiani et al [22] noted no inception voltage dependence on waveshape—although did not use short duration pulse waves as here—and slight dependence on coating material. Short rise-time turn-to-turn-like waveforms used here and as seen in other studies (e.g. [10, 16]), have peak voltages of much shorter duration than square waves (as little as 50 ns). In supplementary experiments, the frequency of 50 ns pulse waves was also observed to have little influence on inception voltage, supporting the conclusions of other studies (e.g. [7]) for short duration pulses.
Figure 3 shows the empirically observed likelihood of partial discharge occurring as a function of applied voltage follows a sigmoid function, consistent with the cumulative Weibull distribution function used to model its behaviour in Volume-Time theory. Whilst the probability of partial discharge is an interplay between the applied electric field strength and duration over which it is present, this data confirms the theoretical expectation that with sufficiently high electric field strength, partial discharge cannot be avoided, even for very short duration pulses associated with transient turn-to-turn potential differences within machine windings. The differences in discharge probability curves also indicates that machine insulation systems should be tested with the specific waveform profiles they will experience in operation rather than ones with merely similar rise times for specific equipment under test, echoing similar existing sentiments [47, 48]. Knowing the partial discharge probability curves for a given system can provide more information about its discharge response than simply measuring the repetitive partial discharge inception voltage alone (that is, when 50% of voltage pulses produce a discharge event), particularly if the operating voltage may vary from nominal.
Low pressure environments exhibited a relatively rapid onset of partial discharge activity for both square and pulse waves, reaching 100% discharge occurrence with much smaller voltage increases above inception (figure 3). This is likely due to the much stronger initial response of the effective ionisation coefficient with increasing electric field strength at low pressure (equation (4)) which more rapidly increases the critical volume. However, rapid onset was also observed at ambient pressure for square waves—particularly at positive polarity. This is likely accounted for by the increased integration time from (equation (1)) relative to pulse waves, increasing the duration of the critical volume and making partial discharge more likely. This similarly explains why square waves were observed to have a reduced 50% discharge occurrence voltage relative to shorter duration pulse waves at all pressures. It is not clear why at low pressure, negative polarity favours lower inception voltages for both square and pulse waveforms, yet the trend is reversed at higher pressure. While there are known differences in electron avalanche development processes with polarity (e.g. [26, 27]), this does not appear to fully account for the observations. Nevertheless, voltage polarity does not exhibit as significant a difference in partial discharge likelihood under given conditions, relative to pressure or waveform.
5.2. Partial discharge delay times
When electric fields are sufficient for partial discharge to occur and are sustained during peak voltage in square and pulse waveforms, discharge occurrence is temporally stochastic (case 3, section 4.2). It is known from theoretical and experimental studies of gas breakdown (e.g. [32, 49]) that the magnitude and spatial distribution of gas ion density affects breakdown statistical time lag. Free electron production rate is determined by considering their sources and sinks from gas molecular ionisation, attachment, and detachment processes, and must account for ion mobility, diffusion coefficient, and proximity of a free electron to the cathode. This is accounted for in Volume-Time theory previously outlined. The probability of electron detachment is electric field-dependent. Higher voltages—and the associated increase in local electric fields—increase the production of free electrons from ions—whose concentration can also be increased by space charge presence, as discussed earlier. The electrons are sourced from spontaneous detachment from negative ions or initiated by cosmic radiation and natural radioactivity [49], supplementing sources driven by collisional detachment. The increased free electron production rate ultimately increases the probability of critical avalanche formation within the critical volume, reducing the average partial discharge time delay. Higher electric field strength also increases the critical volume itself, making critical avalanche formation more likely. The effects of these factors are observed empirically in figure 4, with increasing voltage reducing the modal delay time between voltage change and subsequent partial discharge.
The probability of electron detachment is also pressure dependent. At lower pressure, the density of negative ions is reduced for a given temperature, diminishing detachment rate within the critical volume (equation (5)), and reducing partial discharge probability. This is reflected in the larger range of delay times in figure 5 at lower pressure. During square waves with a relatively long 50 ms pulse duration, partial discharge was observed to occasionally occur considerably after voltage onset, particularly at low pressure, where delays beyond 1 ms could be observed. This observation suggests that testing based on IEC 61934 [50] may need to have a sufficiently long detection time to ensure a delayed partial discharge event is accurately detected. Under environmental conditions relevant to aerospace with the presence of fast rise-time voltage waveforms that allow a wider temporal distribution of partial discharge activity following voltage change, if the detection window is too short in duration, misdetection or under-detection of partial discharge may occur.
The temporal distribution of partial discharge delay times after voltage rise is generally within the period that the high voltage is present. However, examination of the influence of pulse duration more closely, under conditions where partial discharge likelihood was consistently 15%–20% in each case (figure 6), revealed the surprising observation that while longer pulse durations allow for longer delay times between voltage increase and partial discharge, the distributions were not simply broadened. Longer duration pulses did not exhibit the presence of shorter discharge delay times after voltage rise. While the shorter duration pulses required a greater applied voltage (electric field strength) to initiate the same level of partial discharge activity—owing to the reduced integration time of the shorter pulse from (equation (1))—this does not fully account for the observation, since pulse durations of 5 ms, 500 µs, and 50 µs were all measured at the same applied voltage. It is also unlikely that space charge could explain this either; greater homocharge injected during the longer duration pulses would increase local electric field strength and reduce inception voltage. The applied voltage for these three longest pulse durations was unchanged and the partial discharge likelihood was consistently 15%–20%, indicating homocharge build-up was not significant and thus cannot account for the observation. It is not clear from known models of partial discharge how this behaviour could be explained.
5.3. Partial discharges after voltage returns to zero
A corollary of the conceptual model proposed by Fabiani et al [22], is that for unipolar square waves, partial discharge events are expected after applied voltage returns to zero. Such discharge events reflect a field restoration process, should a prior discharge have led to conducive field strengths. This was observed here (figure 6), supporting the model; however, the distribution in time delays between discharges occurring after voltage rise compared with voltage fall is very different. Partial discharge occurring after voltage fall typically occurs sooner and stops altogether for pulse durations of 5 µs and lower. Fabiani et al [22] also showed a clear difference in the distribution of discharge delay times between voltage rise and voltage fall; however, their subsequent study (Cavallini et al [51]) did not observe this and found symmetric partial discharge distributions. It is not clear what causes this marked difference in partial discharge behaviour, and we are not able to propose an explanation from known theory, but nevertheless demonstrates additional distinction between square waves and shorter duration pulse waves.
5.4. Partial discharge magnitudes
Partial discharge magnitudes are generally observed to be greater at low pressure than at ambient pressure. This likely relates to increased area of the surface discharged at lower pressures during a partial discharge event due to occurrence of glow discharges that form nearer to Paschen's minimum [52]. There may also be greater charge transferred in longer channel avalanches that are possible at lower pressures where the critical volume and surface are larger; however, this is likely secondary to the increased contribution from greater surface area involved in the discharge.
The magnitude of observed partial discharge also reveals differences between waveforms and pulse duration. Square waves typically have lower partial discharge voltage magnitudes, and this broadens to larger magnitudes with decreasing pulse duration (figure 7). The shortest pulse durations tested of 500 ns showed a transition to more distinct discharge magnitude behaviour and a stronger polarity dependence. For positive voltage polarity, discharges were exclusively high magnitude, and while true for a negative applied voltage, the magnitudes were not as large. It is not clear what drives the onset of polarity asymmetry. However, the increasing discharge magnitude is likely explained by the need for a greater applied voltage to initiate partial discharge for shorter pulse durations—which integrate over a shorter time period in (equation (1)), thereby reducing likelihood of inception, as discussed above in section 5.2—and that the partial discharge magnitude is also dependent on electric field strength [22]. This means that shorter duration pulses require a larger electric field strength to incept partial discharge, but their magnitude is greater as a result, which has implications for system degradation and lifetime.
6. Conclusions
The behaviour of partial discharge has been examined in aerospace environments for short rise-time (approximately 25 ns) unipolar turn-to-turn-like waveforms with peak durations as low as 50 ns. Such waveforms simulate what may be seen between turns on random-wound machines driven by fast switching converters. The influence of pressure, voltage polarity, and pulse duration was examined.
Overlapping observations are in general agreement with other studies. However, key distinctions in partial discharge behaviour exist between square waves and shorter duration pulse waves. Repetitive inception voltages are higher with pulse waves by up to several hundred volts, although partial discharge magnitudes are greater, with implications for insulation lifetime. At lower pressures associated with higher altitude, inception occurs at higher voltages for pulse waves, but is similar at ambient pressure. The stochastic behaviour of partial discharge is also distinct between waveforms, with discharges occurring sooner after voltage change for shorter duration pulses. Square waves sometimes produce partial discharge over 1 ms after voltage rise at lower pressures, which may be outside the window of detection of some partial discharge measuring instrumentation. Observations support the conclusion that testing should be done with waveforms that will be seen in service, and probability curves for partial discharge under given operating conditions may provide additional benefit for lifetime assessment over the 50% repetitive partial discharge inception voltage alone.
Many of the experimental observations can be accounted for with existing models of space charge and Volume-Time theory, although some observations did not appear to be well described. For example, it was not possible to explain here why there are no short delay times between voltage rise and corresponding partial discharge for longer duration waveforms, why partial discharge occurs relatively sooner after (unipolar) voltage falls to zero compared with voltage rise, or why partial discharge stops occurring after voltage fall for pulse durations less than 50 µs. Further understanding of the nature of partial discharge—particularly in aerospace environments—when using modulated waveforms, will be necessary as associated key technologies are developed.
Acknowledgments
For the purpose of open access, the author has applied a Creative Commons Attribution (CC BY) licence (where permitted by UKRI, 'Open Government Licence' or 'Creative Commons Attribution No-derivatives (CC BY-ND)' licence may be stated instead) to any Author Accepted Manuscript version arising. This research was supported by EPSRC Grant EP/S00081X/1.We would also like to thank the reviewers for their constructive feedback that helped improve this paper.
Data availability statement
The data that support the findings of this study are openly available at the following URL/DOI: https://doi.org/10.48420/19583200.v1.