
Abstract
Histopathology currently acts as a gold standard for human prostate cancer (PCa) diagnosis. However, the subjective nature of histopathology leads to inevitable discordance among pathologists. Specifically, the inter-observer discordance could be up to 40% for the differentiation between Gleason score 6 (low-grade) and 7 (high-grade) of PCa. According to clinical guidelines, patients with high-grade PCa need to be actively treated, while patients with low-grade PCa could undergo active surveillance due to its slowly growing feature. Therefore, differentiating high-grade and low-grade PCa is an urgent clinical need. By integrating stimulated Raman scattering microscopy and confocal Raman spectroscopy, our previous study found the aberrant cholesteryl ester (CE) accumulation in human PCa tissues. However, no significant difference in CE accumulation between the low-grade and high-grade PCa was found, primarily because the previous study only analyzed the composition of manually selected lipid droplets (LDs) without quantitative analysis of the whole field of view. Here, we employed hyperspectral stimulated Raman scattering (HSRS) microscopy to test the hypothesis of CE as a marker for differentiation of low-grade and high-grade human PCa. First, lipid, lipofuscin, and protein were quantitatively mapped in human prostate tissues based on HSRS imaging of C–H vibrational region and multivariate curve resolution analysis. Then, within the lipid channel, CE percentage and unsaturation level of LDs were quantitatively mapped according to the height ratio between Raman bands at 2870 and 2850 cm−1, and between Raman bands at 3006 and 2850 cm−1, respectively. In total of 6 normal prostate tissues, 9 low-grade and 9 high-grade PCa tissues from patients, we found lipofuscin accumulation in all the normal prostate but none in PCa. While all the high-grade PCa tissues had LD accumulation, only 3 low-grade PCa tissues had LD accumulation. Notably, among all the PCa tissues with LD accumulation, no significant difference in LD amount was found between low-grade and high-grade PCa. Fortunately, both CE percentage and unsaturation level of the LDs were significantly different between low-grade and high-grade PCa. Furthermore, it was shown that CE percentage could differentiate low-grade and high-grade PCa with high sensitivity and specificity. Taken together, our study may provide a new opportunity towards more accurate PCa diagnosis.
Export citation and abstract BibTeX RIS

Original content from this work may be used under the terms of the Creative Commons Attribution 4.0 license. Any further distribution of this work must maintain attribution to the author(s) and the title of the work, journal citation and DOI.
1. Introduction
Current diagnosis of aggressive human prostate cancer (PCa) still highly relies on the histopathology. However, the subjective nature of histopathology leads to inevitable discordance among pathologists. Especially for the differentiation between Gleason score 6 (low-grade) and 7 (high-grade), the inter-observer discordance can be up to 40% [1]. Low-grade PCa are slowly growing, which can be left alone without any treatment, and only the high-grade ones require effective treatment. Therefore, there is an urgent clinical need for differentiating high and low grade PCa.
Altered lipid metabolism has been well-recognized as a hallmark of cancer [2]. Intracellularly, excess lipids from de novo synthesis and uptake are stored in lipid droplets (LDs) [3]. Moreover, LD accumulation has been found in many types of human cancers, including brain cancer, breast cancer, colon cancer and others [4–7]. To understand the role of LD in cancer progression, it is necessary to measure compositional information of individual LDs inside single cells. However, such information cannot be obtained by conventional methods, such as lipophilic dye staining, mass spectrometry and nuclear magnetic resonance spectroscopy.
Stimulated Raman scattering (SRS) microscopy enables rapid and sensitive imaging of biomolecules [8, 9]. Multi-color SRS microscopy was developed to achieve virtual histology for many types of cancers [10–14]. By integrating high-speed imaging capability of SRS microscopy and full spectral analysis capability of confocal Raman spectroscopy, our previous study analyzed individual LDs of interest in single cancer cells, and found aberrant cholesteryl ester (CE) accumulation in human PCa tissues [15]. This previous study shows the potential of CE as a marker for diagnosis of aggressive PCa. However, no significant difference in CE accumulation between the low-grade and high-grade PCa was found, primarily because this study only analyzed the composition of manually selected LDs without quantitative analysis of the whole field of view. To differentiate high-grade and low-grade PCa, it is necessary to quantitatively map CE distribution inside LDs of human PCa tissues.
In order to perform quantitative imaging of cholesterol in intact tissues, Wang et al developed a hyperspectral stimulated Raman scattering (HSRS) microscope based on the fingerprint vibrational signals [16]. However, the SRS signals in fingerprint region from LDs of cancer tissues are much weaker than those in C–H stretching region. Recently, Bae et al developed HSRS microscopy to identify different subtypes of glioblastoma pathologies [13]. Liao et al developed a HSRS microscope based on the C–H stretching vibrational signals to analyze lipid composition in LDs of single live cells [17]. By using this method, Li et al studied the lipid unsaturation level of LDs in ovarian cancer stem cells (CSCs) [18].
Here, we demonstrated quantitative mapping of CE percentage and unsaturation level of LDs in human prostate tissues by measuring C–H stretching Raman bands with a HSRS microscope. Thanks to high spectral resolution of our system, we found a characteristic cholesterol Raman band around 2870 cm−1 (which has been reported by [19]), and the height ratio between this cholesterol band and the CH2 stretching band around 2850 cm−1 linearly increased as the CE molar percentage increased in the total neutral lipids. In the meanwhile, when triglyceride (TG) and CE have the same unsaturation level (the number of C=C bonds on the fatty acid chains), the height ratio between the =CH bond band around 3006 cm−1 and the CH2 stretching band around 2850 cm−1 was inversely proportional to the molar percentage of CE present in the total neutral lipids. Thus, simply based on such height ratios, CE percentage and unsaturation level could be quantitatively mapped in PCa tissues. In total of 6 normal prostate tissues, 9 low-grade and 9 high-grade PCa tissues from patients, we found lipofuscin accumulation in all the normal prostate but none in PCa. While all the high-grade PCa tissues had LD accumulation, only 3 low-grade PCa tissues had LD accumulation. Notably, among all the PCa tissues with LD accumulation, no significant difference in LD amount was found between low-grade and high-grade PCa. Fortunately, both CE percentage and unsaturation level of the LDs were significantly different between low-grade and high-grade PCa. Furthermore, it was shown that CE percentage could differentiate low-grade and high-grade PCa with high sensitivity and specificity.
2. Materials and methods
2.1. HSRS microscope
Our HSRS microscope as described previously [20] employed a dual output pump and Stokes laser (InSight DeepSee, Spectra-Physics, CA) with a repetition rate at 80 MHz. The 120 fs tunable pump laser was tuned to 883 nm, and the other 220 fs Stokes laser was fixed with the wavelength of 1040 nm. The Stokes beam was modulated by an acousto-optical modulator (AOM, 1205-C, Isomet, VA) for heterodyne detection at 2.25 MHz. The spectral width of the 220 fs Stokes beam was narrowed down with a 4f pulse shaper. Through the optical modulator and the pulse shaper in the Stokes beam, full width at half maximum (FWHM) of the Stokes pulse was measured to be 2.3 ps by an autocorrelator. The Stokes laser power was 50 mW at 1040 nm. By controlling the slit width, a spectral FWHM width of the pump beam was measured to be ∼0.2 nm. The maximum pump beam power was measured to be 50 mW at 883 nm. The pump and Stokes beams were collinearly combined into a homebuilt laser scanning microscope with a pair of high NA objectives. A water immersion objective lens (UPlanSApo, Olympus, Japan) with numerical aperture of 1.2 excited the SRS signals of the sample with a focus beam. The signals were collected by an oil condenser (NA = 1.4). The SRS signals were detected by a photodiode (S3994-01, Hamamatsu, Japan) with a resonant circuit that selectively amplifies the signal at the specific optical modulation frequency by a digital lock-in amplifier (HF2LI, Zurich Instrument, Switzerland). The output analog voltage from the lock-in amplifier, which represents the SRS signal at the specific Raman shift between pump and Stokes beam, were acquired by a DAQ card (PCI-6251, National Instruments, TX). HSRS stack imaging was performed by varying Raman shift from 2800 to 3030 cm−1, which covers the C–H stretching region of lipids and proteins in the sample. The estimated the spectral resolution of our HSRS system is 2.1 cm−1. Each SRS image contained 400 × 400 pixels with the pixel dwell time of 20 μs per pixel for tissue imaging.
2.2. Chemicals preparation
Pure cholesteryl oleate (Sigma Grade, ⩾99%) and glyceryl trioleate (Sigma Grade, ⩾99%) were purchased from Sigma-Aldrich (St. Louis, MO). By solvent evaporation method, LD emulsions were prepared with cholesteryl oleate and glyceryl trioleate. Briefly, cholesteryl oleate and glyceryl trioleate were both dissolved at the same concentration acetone (10 mM). The cholesteryl oleate and glyceryl trioleate solutions were then mixed together at various volume ratios for imaging. The mixtures were added to deionized water at a volume ratio of 1:20. During magnetic stirring, LDs formed within 10 min. A drop of emulsion with TG and CE mixtures at various volume ratios was sandwiched between two glass coverslips and sealed right for imaging.
2.3. Human prostate tissues preparation
This study was approved by institutional review board. Frozen specimens of human prostate tissues derived from patients who underwent radical prostatectomy for PCa were obtained from Peking University First Hospital. These patients had not received hormone therapy before radical prostatectomy. For each tissue specimen, pairs of neighboring slices were prepared, with one slice remained unstained for spectroscopic imaging and the other stained with H&E. Pathological examination was made by genitourinary pathologists. The 20 μm thick tissue sections were sandwiched between two glass coverslips before HSRS imaging. The 24 tissue specimens were collected from 18 patients (9 low-grade PCa, 9 high-grade PCa, and 6 normal adjacent tissues).
2.4. MCR analysis
We used multivariate curve resolution (MCR) algorithm as described previously [20] to calculate lipid, protein and lipofuscin concentrations in figure 1. MCR is a bilinear model capable of decomposing a measured spectral image set D into concentration data profiles and spectra of input chemical components, represented by matrices C and ST , as below:

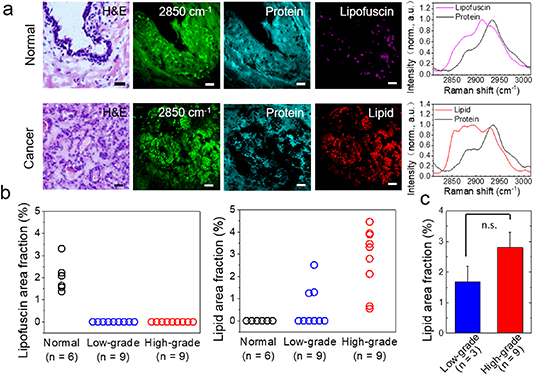
Figure 1. Hyperspectral SRS imaging and MCR analysis of human prostate cancer tissues. (a) Hyperspectral stack images was acquired of 50 images from 2820 to 3020 cm−1, with pixel dwell time of 10 µs. (b) Quantitation of lipofuscin area fraction and lipid area fraction in normal, low-grade and high-grade PCa tissues. (c) Student's t test (p > 0.05) of lipid area fraction (lipid area fraction > 0) between low-grade and high-grade PCa tissues. Scalar bar: 10 µm.
Download figure:
Standard image High-resolution imagehere, T means the transpose of matrix of S. E is the residual matrix or experimental error. The SRS spectral data matrix D is decomposed into the product of two smaller matrices C and S, C is the concentration matrix of each input component and S is the output spectra of all fitted components. The output concentration map of simulated chemical components at each pixel is represented to be percentage relative to the intensity of the MCR fitted spectrum. Given initial input of pure spectra from prior knowledge, an alternating least squares (ALS) algorithm calculates the concentration C and spectrum S by the equation iteratively. The results finally fit the data matrix D with the least relative error. Both concentration and spectra data profiles are served as constraints during the alternating least squares iteration.
2.5. CE percentage and unsaturation level analysis
Given that neutral lipids in LDs are predominantly triacylglycerol (TG) and CE, we conducted HSRS measurements of mixed emulsions containing cholestery oleate and glyceryl trioleate, as the standards of certain CE molar percentage, to calibrate the relation between CE percentage and Raman height ratio. The CE molar percentage was assigned as c, and so the TG molar percentage was (1 − c). The height ratio (r, I2870/I2850) between the Raman bands (2870 cm−1/2850 cm−1) was correlated with the CE molar percentage (c), as shown in the following equations:
where ITG2870 represents the peak height of the Raman band (2870 cm−1) for pure TG sample; ITG2850 represents the peak height of the Raman band (2850 cm−1) for pure TG sample;
ICE2870 represents the peak height of the Raman band (2870 cm−1) for pure CE sample; ICE2850 represents the peak height of the Raman band (2850 cm−1) for pure CE sample.
Based on the HSRS spectra of LD emulsion, the correlation between height ratio (r) and CE molar percentage (c) is expressed by the following equation:
where r represents the height ratio between the Raman bands (2870 cm−1/2850 cm−1) and c represents CE molar percentage. Thus, by simply using SRS images at the Raman bands 2870 and 2850 cm−1, CE percentage in LDs could be quantitatively mapped in PCa tissues.
Under the condition that TG and CE have only one C=C bond on each fatty acid chain (unsaturation level equals 1), the height ratio (r', I3006/I2850) between the Raman bands (3006 cm−1/2850 cm−1) can be fitted by a standard curve, as below:

where r' represents the height ratio between the Raman bands (3006 cm−1/2850 cm−1) and c represents CE molar percentage. The unsaturation level of LDs (the average number of C=C bonds on each fatty acid chain) in tissues was then calculated by the following equations:

where c represents CE molar percentage calculated by equation (4), and rtissue represents the height ratio of the Raman bands (3006 cm−1/2850 cm−1) of LDs in tissues hyperspectral SRS images.
2.6. LDs area fraction analysis
By using 'Threshold' module at ImageJ, LDs in the tissues can be segmented due to their higher local signal intensities compared to other tissue compartments. Then, by using 'Analyze Particles' module at ImageJ, area fraction of LDs of total image area can be measured.
2.7. Statistical analysis
Student's t test was used for comparisons between groups, and p < 0.05 was considered statistically significant. The low-grade and high-grade classification for PCa tissues was evaluated with a binary class receiver operating characteristic (ROC) analysis. The area under the ROC curve (AUC) evaluates the ability of a binary classification model to distinguish two categories with ranging from 0 to 1.
3. Results
We firstly demonstrated that HSRS imaging and MCR analysis were capable of label-free quantitative analysis of lipid composition and lipid area fraction in human PCa tissues in situ, including low-grade PCa (n = 9) and high-grade PCa (n = 9), and normal adjacent tissues (n = 6). We performed HSRS imaging of human prostate tissues at C–H stretching region (2800–3030 cm−1). As shown in figure 1(a), substantial HSRS signals increased from the lipid-rich cell membranes and intracellular LDs. Meanwhile, weak HSRS signals in tissues also were derived from the lipid-poor cell nuclei. Morphologically, SRS images at 2850 cm−1 provided information very similar to that of H&E staining images from the neighboring tissue slices.
The obtained HSRS image stacks were analyzed with above mentioned MCR algorithm. Based on the spectra of lipid, protein, and lipofuscin (a mixture of proteins, lipids, and pigments), MCR algorithm decomposed the stacks into concentration maps of each composition (figure 1(a)). Lipofuscin has a unique frequency vibration (2915 cm−1) between the vibration frequency of protein CH3 and lipid CH2. As shown in figure 1(b), only lipofuscin but no LDs were found in normal prostate tissues, while only LDs but no lipofuscin were found in PCa tissues. Moreover, lipid area fraction was found to be significantly greater in high-grade PCa than that in low-grade PCa. Unfortunately, if ruling out the undetectable cases in low-grade PCa (6 out of 9), no significant difference was found between the rest low-grade cases and the high-grade ones (figure 1(c)). This makes difficult to differentiate high-grade PCa from low-grade PCa solely relying on the LDs fraction described in section 2.6. Thus, there is a need to further quantitatively map lipid composition of LDs in PCa tissues in situ.
In order to quantitatively map the lipid composition in LDs, we conducted HSRS experiments of C–H region in CE–TG mixture emulsions of different CE molar percentages. As shown in figure 2(a), The C–H stretching region covers CH2 stretching band for all lipids (2850 cm−1), characteristic band for cholesterol (2870 cm−1), and =CH stretching band for unsaturation level (3006 cm−1). As shown in figure 2(b), we found that the experimental data of height ratio I2870/I2850 matched well with the theoretical curve as described in equation (4).
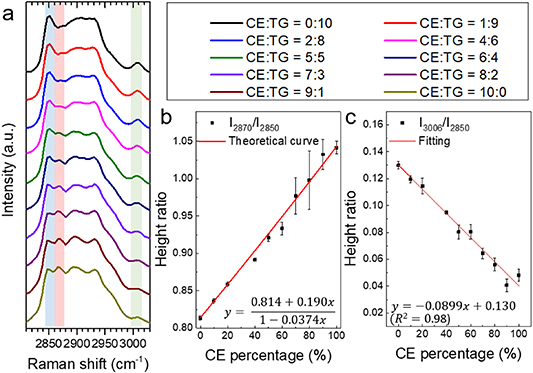
Figure 2. Development of method for quantification of CE percentage and lipid unsaturation level in neutral lipids. (a) Raman spectra of CE-triacylglycerol (TG) emulsions with eight different CE:TG molar ratios, ranging from 0:10 to 10:0. CE–TG emulsions are mixtures of cholesteryl oleate and glyceryl trioleate, and are used as the standards of certain CE molar percentage. Spectral intensity shown in (a) was normalized by the peak at 2850 cm−1. (b), (c) Calibration curve for quantification of CE percentage out of total neutral lipid, was generated by linear fitting of height ratio at the peak of (2870 cm−1/2850 cm−1) and (3006 cm−1/2850 cm−1).
Download figure:
Standard image High-resolution imageAs shown in figure 2(c), the height ratio I3006/I2850 was negatively correlated with the CE molar percentage, which was linearly fitted as the equation (5). This finding suggests that, if LDs contain significant amount of CEs, the height ratio I3006/I2850 will not only be affected by unsaturation level but also the CE percentage as well. In figure 2(c), the fitted curve showed neutral lipids with monosaturate, the upper side of the fitted curve indicated neutral lipids with polyunsaturated fatty acid chains, and the lower side indicated neutral lipids with saturated fatty acid chains.
According to the quantitative analysis method describe above, CE percentage and unsaturation level of LDs were then quantitatively mapped in PCa tissues by simply using SRS images at the Raman bands 2870, 2850, and 3006 cm−1. The molar percentage of CE was calculated with the height ratio I2870/I2850 of each pixel inside LDs areas by equation (4). The unsaturation level of lipids was calculated with the height ratio (3006 cm−1/2850 cm−1) of each pixel inside LDs areas was least squares fitted with by equations (5) and (6). As shown in figures 3(a) and (c), CEs and unsaturation lipids were highly abundant in the LDs in PCa tissues.
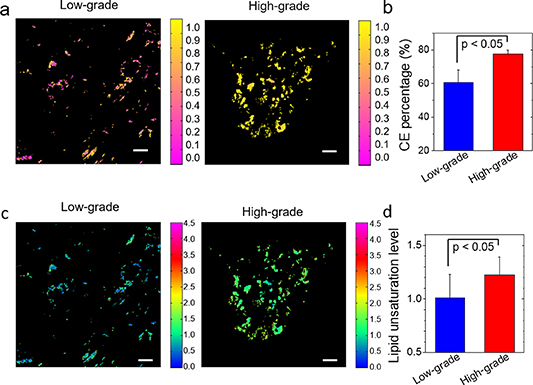
Figure 3. Quantitative mapping and analysis of CE percentage and unsaturation level in human prostate cancer tissues. (a) Quantitative map of CE molar percentage in low-grade and high-grade PCa tissues. (b) Student's t test (p < 0.05) of CE percentage between low-grade and high-grade PCa tissues. (c) Quantitative map of unsaturation level in low-grade and high-grade PCa tissues. (d) Student's t test (p < 0.05) of unsaturation level between low-grade and high-grade PCa tissues. Scalar bar: 10 µm.
Download figure:
Standard image High-resolution imageAs shown in figure 3(a), the distribution of CEs was heterogeneous, especially in low-grade PCa. Statistical analysis further showed that CE molar percentage was significantly higher in high-grade PCa compared to low-grade PCa (figure 3(b)). In addition, the amount of CEs in high-grade PCa was almost twice as much as the one in low-grade PCa. In addition, the unsaturation level of lipids was significantly higher in high-grade PCa compared with low-grade PCa (figure 3(d)).
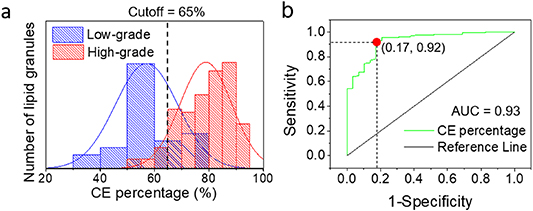
Considering that the difference in CE molar percentage was more significant, CE molar percentage was finally used to achieve differentiation of low-grade PCa and high-grade PCa with higher specificity and sensitivity. As shown in figure 4, receiver operating characteristic curve (ROC) analysis showed that the area under classification (AUC) could be as good as 0.93 using CE percentage as the marker to distinguish low-grade and high-grade PCa. When setting the cutoff of CE percentage at 65%, 92% sensitivity and 83% specificity could be achieved.
Figure 4. Differentiation quantitative mapping and analysis of CE level in human prostate cancer tissues. (a) Low-grade (n = 9) and high-grade (n = 9) PCa tissues analysis of CE molar percentage show to be differentiated by the threshold rate (cutoff = 0.65). (b) High-grade PCa and low-grade PCa classification with the area under classification (AUC = 0.93) by simulated ROC.
Download figure:
Standard image High-resolution image
4. Discussion
First of all, this work demonstrates that CE percentage and unsaturation level of LDs in human prostate tissues can be quantitatively mapped by measuring C–H stretching Raman bands with a HSRS microscope. Different with MCR based quantitative methods, Fu et al [21] used the height ratio between Raman bands around 3015 and 2965 cm−1 to quantify CE percentage in LDs. This simplified process enables quantitative chemical imaging of CE and lipid unsaturation by multi-color picosecond SRS microscope, which would be a easier version of imaging setup for biomedical applications. Nevertheless, we notice that the height of the Raman band around 3015 cm−1 is affected by both CE percentage in LDs (as shown in figure 2) and unsaturation level (=CH stretching, same as 3006 cm−1 in our system) of LDs, it would be more accurate to use the height ratio between Raman bands around 2870 cm−1 (specific cholesterol band) and 2850 cm−1 (CH2 stretching of total lipids) to quantify CE percentage in LDs in intact cancer tissues, especially when unsaturation level varies between CE and TG in LDs.
Secondly, our results suggest the potential of CE as a marker to differentiate low-grade PCa and high-grade PCa. Since the introduction of prostate specific antigen (PSA) screening, PCa has become the most widely diagnosed non-skin cancer in men in the United States [22]. A controversy exits about the usefulness of PSA screening due to high false positive rate. Histopathology works as a gold standard for differentiating low-grade and high-grade PCa. However, the subjective nature of histopathology leads to inevitable discordance among pathologists. Especially for the differentiation between Gleason score 6 (low-grade) and 7 (high-grade), the inter-observer discordance can be up to 40% [1]. Since only the high-grade PCa requires effective treatment while low-grade PCa can be left alone without any treatment, there is an need for an objective and accurate method to differentiate low-grade and high-grade PCa. It has been reported that aberrant CE accumulation occurs in many types of human cancers, including PCa, brain cancer, pancreatic cancer, liver cancer and others [3, 4, 7, 15]. In this study, our data shows that although no significant difference in LD amount was found between low-grade and high-grade PCa among all the PCa tissues with LD accumulation, both CE percentage and unsaturation level of the LDs were significantly different between low-grade and high-grade PCa. Furthermore, CE percentage could be used to differentiate low-grade and high-grade PCa with high sensitivity, high specificity, and big AUC from ROC analysis.
Third, the unsaturation level of lipids was significantly greater in high-grade PCa tissues compared with the low-grade PCa. Our data about the correlation between height ratio I3006/I2850 and CE percentage suggests that both CE percentage and lipid unsaturation level affects the height ratio I3006/I2850. Based on our calibration curve, we found that the LDs in low-grade PCa contained primarily monosaturated fatty acid chains, while the LDs in high-grade PCa contained more polyunsaturated fatty acid chains. Previously, Pan et al found an increase in unsaturated fatty acids in isolated LDs from cancer cells [23]. Li et al found significantly increased level of unsaturated lipids in CSCs compared with non-CSCs [18]. Thus, it is possible that increased lipid unsaturation is also a metabolic marker for advanced PCa and a potential target for PCa therapy.
Acknowledgments
This work was supported by the National Natural Science Foundation of China (No. 62027824 and No. 81501516 to S Yue), the Open Project Program of Wuhan National Laboratory for Optoelectronics (No. 2018WNLOKF026 to S Yue), the Fundamental Research Funds for the Central Universities (No. YWF-21-BJ-J-549 to S Yue), and the 'Excellent Hundred Talents' Program start-up fund from Beihang University (to S Yue). P W acknowledges support from the National Key Research and Development Program of China (2016YFA0201403), the National Natural Science Foundation of China (62075076).
Data availability statement
The data that support the findings of this study are available upon reasonable request from the authors.