

Abstract
Reliability and a long maintenance interval are major requirements for the industrial use of an extreme ultraviolet (EUV) source. In this paper we present results on the influence of the electrode erosion on the EUV generation and its lifetime limiting characteristics. The geometry of the electrodes and their influence on the gas pressure distribution within the electrode system have been found to be the key variables to characterize the regime of operation. This better understanding allows for an optimization of device parameters (e.g. gas flow or pulse energy) to counteract the erosion process, in order to increase the maintenance interval and EUV output. The EUV source under investigation is based on a hollow cathode triggered pinch plasma. A new trigger concept is introduced that enables free adjustment of the gas pressure during operation, thus enabling the operation with a high conversion efficiency of up to >0.7 %/2πsr at 13.5 nm and 2% bandwidth. The efficiency for the peak brilliance is up to ~2.6 W kW−1 mm−2sr−1 while the maximum electrical input power of the system is 15 kW.
Export citation and abstract BibTeX RIS
1. Introduction
Laboratory scale EUV sources based on a discharge produced plasma (DPP) are widely-used for research and development projects in the field of EUV lithography (EUVL). Typical applications are optics lifetime- and contamination studies [1, 2], exposure tools [3], development of metrology [4] or defect inspection [5] and also in tools like AIMS [6]. The source concept under investigation is based on a hollow cathode triggered (HCT) pinch plasma and is already in use for a variety of applications. With the ability of using and mixing different working gases, the source offers a wide spectral range of emission from 2 to 20 nm [7] and such can be an alternative light source for experiments, often to be conducted at synchrotron facilities e.g. measurements of the x-ray magnetic circular dichroism (XMCD) [8], photoemission electron microscopy (PEEM) [9] or soft x-ray microscopy [10].
The main challenge for a successful implementation of DPP sources in industrial metrology applications is to guarantee for a long maintenance interval limited due to a loss in brilliance and output power. While erosion affects the electrode geometry manifested by volumetric loss, the underlying physics leading to the drop in efficiency is not well understood. This work aims for an increased maintenance interval of the EUV source by separating the electrode erosion from the source's performance through a better understanding of the underlying processes and taking actions in source parameter settings to make the EUV output less sensitive to electrode deformation. In the following experiments we study the effect of the electrode geometry on the working gas pressure distribution within the electrode system and on the EUV generating process. For this purpose the source has been characterized for different electrode geometries and over wide gas flow ranges in terms of the absolute emission at 13.5 nm (2% b.w.) as well as the spatial and spectral distribution of the EUV light.
2. Experimental set-up
The EUV source that has been used for the experiments is equipped with a storage capacity and an electrode system as schematically shown in figure 1. The discharge system consists of a hollow cathode in pseudospark arrangement with an intermediate electrode (IE) and a grounded anode. The storage capacity is directly connected to the cathode and anode insuring a low overall inductivity of less than 20 nH. The pulse energy is determined by the charging voltage of the storage capacity. The discharge current between cathode and anode generates a magnetically compressed and highly ionized pinch plasma that emits the extreme ultraviolet radiation. The discharge current pulse is mainly defined by the LC-circuit of electrode system, with C being the storage capacity. For the present system the peak current is around 10 kA. The intermediate electrode and the trigger electrodes within the hollow cathode are used in the passive/active trigger mechanism. The passive triggering uses a blocking potential to inhibit early discharges during charging of the storage capacity to about −2 kV (figure 2). The concept of a blocking potential and its implementation is described e.g. in [11–13].
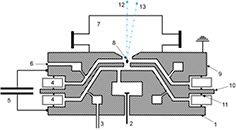
Figure 1. Schematic overview of the electrode system: (1) cathode, (2) trigger electrode, (3) gas inlet, (4) insulators, (5) storage capacity, (6) port for anode pressure measurement, (7) vacuum vessel, (8) pinch plasma, (9) anode, (10) intermediate electrode, (11) O-ring sealing (4×), (12) emission on optical axis towards camera/spectrometer, (13) emission 10° to the optical axis towards energy monitor.
Download figure:
Standard image High-resolution image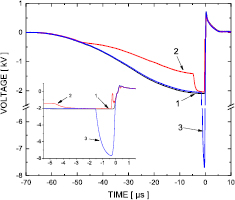
Figure 2. Voltage diagram showing the cathode voltage (1), the blocking potential (2) and the active trigger pulse (3). The inset shows the curves close to the voltage breakdown in detail.
Download figure:
Standard image High-resolution imageThe active triggering applies a negative high-voltage pulse to the trigger electrodes which initiates the discharge. Voltage waveforms for the cathode and the trigger potentials are shown in figure 2. The combination of both trigger techniques allows for operation of the source in a large Xenon pressure range. In this set-up the pressure corresponds to a Xenon gas flow through the electrode system from about 20 sccm to more than 100 sccm. The cathode features an axial three-hole design, which is indicated by one hole in figure 1, for the sake of simplicity. It is made from a tungsten alloy while anode and IE are made from molybdenum. The initial diameter of the intermediate electrode (IE) and anode are 8 mm and 10 mm respectively. The gap distances of cathode to IE and IE to anode are about 3 mm. To assure the comparability of the presented results at different settings, the source was operated at constant input power with a frequency of 1 kHz and a pulse energy of 3.7 J.
The electrode system is attached to a vacuum vessel with a turbo molecular pump (1200 l s−1) which leads to a pressure drop to about 0.1 Pa within the vessel during operation and base pressure of <10−4 Pa. The vessel pressure is measured with a capacitive and a cold-cathode pressure gauge in the vicinity of the energy monitor.
The EUV pulse energy is measured using an energy monitor for the 13.5 nm radiation in a bandwidth of 2%. It consists of two flat Mo/Si multilayer mirrors and a Zr-coated photodiode. The energy monitor is cross-calibrated to an energy monitor that has been calibrated at the Physikalisch Technische Bundesanstalt (PTB). It is attached in an angle of 10° to the optical axis measuring the EUV pulse energy simultaneously to the acquired spatial profiles and spectra in on-axis direction. The EUV pulse energy is calculated under consideration of the self-absorption between diode and pinch plasma, which is always less than 10%, based on the vessel pressure and the xenon absorption at 13.5 nm [14]. The conversion efficiency CE is calculated by dividing the EUV pulse energy by the electrical pulse energy. The EUV power is calculated by multiplying the averaged EUV pulse energy with the repetition rate. The spatial profile of the EUV emitting plasma is obtained with an inband camera [7]. The inband camera consists of an entrance aperture, a Zr-filter, one flat and one spherical Mo/Si multilayer mirror, generating an image of the pinch plasma on the sensor surface. To detect the EUV light, a converter coating has been applied to the sensor of a modified industrial CMOS camera system. The camera is focused in the gap between intermediate electrode and anode, while the depth of focus is about 2 cm covering the complete discharge region with a spatial resolution of approximately 40 µm. The magnification is 0.33 with a total optical track length of ~1.34 m and a distance of ~0.33 m between the spherical mirror and the detector. The brilliance profile L(x, y) is obtained by normalizing the 2D integral of the image in a radius of 3 mm around the pinch plasma to equal the measured inband EUV power. The emission spectra have been recorded using a grazing incidence flat-field spectrograph with a 1200 l mm−1 grating. The spectrograph was connected along the optical axis. The wavelength dependent quantum efficiency of the spectrograph was determined based on data from literature for the grating [15] and the CCD [16]. The absolute scale for the emission spectra is calculated by matching the integral of the intensity at (13.5 ± 0.135) nm to the measured EUV inband emission from the energy monitor. The integration times for the measurements with the inband camera and the spectrograph where 50–100 ms and 30 ms respectively.
The Xenon gas is let into the gap between the cathode and the intermediate electrode through radially distributed holes, as shown schematically in figure 1. A capacitive pressure sensor (not shown) is attached to a gap between anode and intermediate electrode. This pressure is called anode pressure PAn within this paper. For reference measurements, a second capacitive pressure sensor has been installed in place of a trigger electrode, measuring the pressure within the hollow cathode. This pressure is called cathode pressure Pcat within this paper. We will only discuss pressures measured with the source being switched off and assume a temperature of 300 K for estimation of the working gas number density.
The pressure gradient in the electrode system is strongly dependent on the geometry of the intermediate electrode and anode which changes during operation as they are effected by erosion. To investigate the effects of erosion, combinations of intermediate electrodes and anodes with varying degree of degradation have been tested. The electrodes where collected from various long-term runs that stressed them at 1.5 kHz with pulse energies of ~4 J. Figure 3 schematically shows the electrodes close to the emitting plasma and the alteration of the shape due to erosion. The anodes have been characterized by their minimum diameter DAn and the intermediate electrodes (IE) by their front diameter DIE, measured about 1 mm beneath their anode-facing surface, in order to get a simplified parameter set to quantify the electrode erosion.
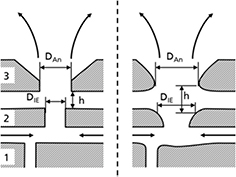
Figure 3. Enlarged discharge region of the electrode system showing (1) cathode, (2) intermediate electrode, (3) anode and indications for the measurements of the anode and IE diameters and the distance h. A new electrode system (left) is shown next to a used one (right).
Download figure:
Standard image High-resolution imageWith the corresponding effective height h a neutral gas particle number NAnode in the volume of a cylinder with mean radius rm can be defined as:

These parameters where selected as the EUV radiation is generated mainly within this volume, as can be concluded from off-axis EUV images of the plasma, which are not reported here. NAnode is calculated under the assumption of a homogeneous pressure distribution, ignoring the pressure gradient from gas inlet to the chamber. Because of this pressure gradient, NAnode from equation (1) is a lower limit estimation of the number of ions in the electrode volume attributed to the pinch plasma. A detailed discussion on this topic is out of scope of this paper. The tested electrodes have diameters of 10 mm to 16.2 mm for the anode and 8 mm to 13.5 mm for the intermediate electrode with corresponding heights of 3.5 mm to 5.5 mm. Using different combinations of electrodes and anodes as well as Xe-flows of 10–100 sccm with the new active/passive triggering, the EUV generation can be studied over more than one order of magnitude of the anode particle number NAnode. The cathode has three holes, instead of usually one central hole known from the pseudospark discharge. The use of a multi borehole design allows for distributing the current over a larger area of the cathode surface in comparison to only a single hole. Thus the erosion which arises from the non-avoidable cathode spot origin is distributed over a larger area which allows for a longer use of this component. In preceding experiments, exchanging a new cathode to one that has previously been used for more than 500 Mshot resulted in a decrease of conversion efficiency of less than 5%. Thus the condition of the used cathodes with much less pulses are neglected within this paper.
3. Results
3.1. Gas pressure
As the working gas flows through the electrode system from cathode to anode into the vacuum chamber, the backpressure within the electrode system is inevitably effected by the electrode shape. As an example for this effect, figure 4 shows the anode and cathode pressure at a gas flow of 40 sccm when exchanging the new intermediate electrode and anode with ones that have been used for 220 Mshot. Both pressures show a drop of about 3 Pa as an effect of the higher throughput caused by the increase of diameters from 10 mm to 12.4 mm for the anode and 8 mm to 11.5 mm at the front of the intermediate electrode. In the used range of operation, the measured pressures were confirmed by measurements to have a linear relation to the gas flow. The impact of this pressure behavior due to erosion on the EUV generation will be discussed below.
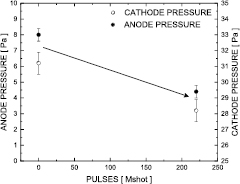
Figure 4. Pressure measured at anode and cathode for new and used electrodes at a flow of 40 sccm Xenon. The arrow indicates the decrease of pressure during operation.
Download figure:
Standard image High-resolution imageFor the upcoming discussion of the results we choose the parameter  as order parameter for the comparison of the measured results on EUV emission. This parameter is a measure for the neutral gas line-density along the pinch plasma axis while rm can be seen as a measure for the starting radius of the pinch process. The parameter is closely related to the number of involved particles for the EUV generation (by multiplying with the height, h). Therefore, it allows for better judgement of intrinsic parameters related to a single ion and thus the discovery of similarities of the dynamics within the parameter range for the system.
Figure 5 shows a false color diagram of  at 40 sccm Xenon for different combinations of electrodes with constant gap distance. The black dots are marking the combinations where measurements of pressure and the EUV emission have been performed. Generally, the wear of the anode leads to a decrease of anode pressure, the wear of the intermediate electrode leads to an increase of anode pressure. Consequently, using the data shown in figure 4, a compensation of effects is achieved when maintaining a constant value for
  . Still, due to the additional increase of effective height and thus volume, NAnode is increased by about 20% (not shown).

Figure 5. Color map of  as a function of the anode versus IE front diameter at 40 sccm xenon. Black dots mark the combinations of electrodes, where measurements were performed.
Download figure:
Standard image High-resolution image3.2. Efficiency scaling
The influence of electrode erosion on EUV inband generation has been investigated looking at different combinations of anodes and intermediate electrodes, varying DIE, DAn and h. Figure 6(a) shows the derived 13.5 nm inband conversion efficiency plotted against the respective  at gas flows in the range between 10 sccm to up to 100 sccm.
  is confirmed to be a good reference value since all measurements show a maximum of the emission around
  = 100 mm2 Pa corresponding to a NAnode of (3–4) × 1014 and a left and right wing with a similarly decreasing efficiency. Generally, the left wing of the measurements corresponds to combinations of small DIE combined with large DAn and the right wing to large DIE combined with small DAn. Both extreme combinations are not optimal, as high efficiencies are not accessible through reasonable gas flow adjustments. The points highlighted with full black dots correspond to measurements using different intermediate electrodes but the same new anode (Dan = 10 mm). These data points fall close together which emphasizes that a change in DIE can be compensated by the gas flow without having a strong influence on the conversion efficiency.

Figure 6. Conversion efficiency (a) and number of inband photons per ion and pulse (b) plotted against the corresponding  . Each symbol corresponds to a combination of an anode and intermediate electrode, examined using flows of ~20–100 sccm. Full black dots correspond to measurements with DAn = 10 mm.
Download figure:
Standard image High-resolution imageTo get a better understanding of these processes occurring in the pinch plasma, the 4π-emissivity per ion is estimated. For this, NAnode is assumed to equal the number of ions compressed in the pinch plasma. Figure 6(b) shows the number of emitted (2% inband at 13.5 nm) photons per xenon ion and pulse plotted against  . All measurements point to a maximum emissivity around 80 mm2 Pa which is a bit lower than the typical settings for maximum CE in figure 6(a).
Measurements with  > 90 mm2 Pa at the lowest feasible gas flow show no local maximum (e.g. the measurements with the new anode indicated by the full dots). The dependence on the anode is clearly visible as these measurements fall together on a single curve. The highest emissivity of >14 inband photons in 4π per ion at ~70 mm2 Pa was achieved with DAn = 16.2 mm, DIE = 8 mm and a gas flow of 40 sccm.
To get a better understanding of the underlying physics leading to the behavior seen in figures 6(a) and (b), more information about the plasma is needed. In the following section we analyze the emission spatially as well as spectrally in reference to  .
.
3.3. Spatial emission profile
Figure 7(a) shows the radial emission profiles at 13.5 nm for three combinations of anode and IE, obtained by a line scan L(x,y = 0). The combinations are DIE = 8 mm; DAn = 10 mm (A), DIE = 8 mm; DAn = 16.2 mm (B) and DIE = 13 mm; DAn = 16.2 mm (C). The measurements are taken from a close region of interest of  ≈ 150 mm2 Pa (A), 100 mm2 Pa (B) and 110 mm2 Pa (C) at 35 sccm, 60 sccm and 30 sccm, respectively. They have a common conversion efficiency of ≈0.55 %/2πsr. Still, the impact on peak brilliance is clearly visible, dropping from 9.6 W mm−2sr−1 (A) over 7.3 W mm−2sr−1 (B) down to 3.3 W mm−2sr−1 (C), while the pinch diameter increases from 260 µm (A), 380 µm (B) to 770 µm (C) FWHM.
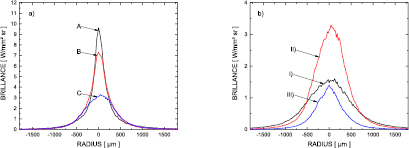
Figure 7. Line scans of the brilliance profile obtained at (a)  ≈ 110 mm2 Pa and CE ≈ 0.55 %/2πsr for combinations A, B and C; and (b) at
  about (I) 70 mm2 Pa, (II) 110 mm2 Pa and (III) 205 mm2 Pa for combination C. The combinations are: A: DIE = 8 mm; DAn = 10 mm, B: DIE = 8 mm; DAn = 16.2 mm; C: DIE = 13 mm; DAn = 16.2 mm.
Download figure:
Standard image High-resolution imageFurther measurements with the type C combination were chosen to illustrate the influence of the gas flow on the EUV generation on the left and right wing of figure 6(a), since the most pronounced effect on the emission spectra was also obtained with these electrodes. The spatial distribution of the emission is plotted in figure 7(b) for  of about 70 mm2 Pa, 110 mm2 Pa and 205 mm2 Pa. It shows a decreasing pinch diameter from 1100 µm, 770 µm down to 590 µm FWHM with increasing gas flow. The CE is 0.49 %/2πsr, 0.53 %/2πsr and 0.20 %/2πsr, respectively.
3.4. Spectral emission characteristics
Figure 8 shows the respective spectra for the electrode type C combination as discussed with the brilliance profiles in figure 7(b) and the spectrum belonging to the emission profile from figure 7(a) with the type B combination for comparison. Certain regions in a xenon emission spectra can typically be attributed to individual degrees of ionization. Distinct features, e.g. the peaks at 16.2 nm and 16.5 nm are emitted from Xe8+ ions. Furthermore the emission around 15 nm, 13.5 nm, 12.4 nm and 11.3 nm mainly originates from Xe9+, Xe10+, Xe11+ and Xe12+ ions respectively [17].

Figure 8. Flatfield spectra obtained with the combinations B (DIE = 8 mm; DAn = 16.2 mm) and C (DIE = 13 mm; DAn = 16.2 mm) at different gas flows.
Download figure:
Standard image High-resolution image
Influences of the gas flow on the spectral emission are clearly visible (figure 8, combination C) with an overall tendency of stronger emission at longer wavelength with increasing gas flow.
The xenon plasma is known to have a high self-absorption for the radiation around 11 nm, emitted from the dense center of the pinch [18]. Therefore the plasma density has a strong influence on the optical density and the emission. The high emission around 11 nm in the 70 mm2 Pa case (figure 8, combination C) in combination with the large pinch diameter (figure 7(b)), lead to the assumption of a hotter and optically thinner plasma for the 11 nm contribution.
With increasing gas flow the density rises and the plasma temperature and diameter decrease. These conclusions are based on the observed spatial emission profiles and the tendency of pronounced emission at longer wavelength, i.e. lower ionization levels with increasing flow. Being colder and increasingly opaque, the 11 nm emission almost vanishes at high gas flows. With the lower plasma temperature lower degrees of ionization are excited more efficiently, leading to a higher emission at longer wavelengths.
The measurements from figure 7(a) can be reduced to an investigation of the influence of the starting radius of the pinch phase. While starting with a similar neutral gas line density, apparently a strong compression cannot be achieved with large electrodes at this pulse energy.
With the small starting radius, the B-type combination at 60 sccm yields an overall high emission (figure 8). Here, the gas flow has no significant influence on the emission spectrum and power between 40 sccm and 70 sccm (not shown) in contrast to the C-type combination. The density and temperature of the plasma is expected to be much higher, yet the 11 nm emission is presumably restricted due to the optical density.
4. Discussion
Measurements in the wide pressure or gas flow range as shown above have not been performed before on this kind of discharge based EUV source and are only possible by the use of the new active/passive triggering. The results will be rated for different aspects.
4.1. EUV decrease with restricted access to gas flow settings
Equipped only with passive triggering, the gas flow has to be increased to compensate for the erosion and thus the drop in pressure, in order to force a self-breakdown of the cathode voltage by keeping the cathode and also the hollow cathode pressure at a constant level. Under these conditions NAnode will be around 4 × 10¹⁴ ( ≈ 170 mm2 Pa) with new electrodes and up to 9 × 10¹⁴ (
 ≈ 250 mm2 Pa) with used electrodes. The path depicted away from an optimum
  in figures 6(a) and (b), is symbolic for the drop in efficiency from ~0.45 %/2πsr down to ~0.25 %/2πsr of the passively triggered systems.
4.2. Dominant heating mechanism
Based on the shown measurements, the EUV emission can be traced back to an Ohmic heating of the pinch plasma balanced by radiation cooling as will be shown below.
With NAnode ~ 3.9 × 10¹⁴ at 30 sccm, the conversion efficiency of broadband EUV emission can be estimated in this case to be CE10–18 nm ≈ 16 %/4πsr by integrating the spectrum from 10–18 nm. The respective emission in terms of photons is in this case of about 4.1 × 10¹⁶ Photons/4πsr. Assuming that NAnode describes the number of ions involved in the EUV emitting process every ion is emitting about 100 EUV photons on average. With a typical emission duration [17] of about 50 ns a peak emission power of PEUV = 10–15 MW/4πsr can be estimated. A more detailed discussion would require to take the individual pulse duration of each parameter set. For the sake of simplicity and getting a rough estimation of the typical time scales we will restrict to a single value for the pulse duration. Thus, the time constant for the photon emission from a single ion of τem ~ 0.5 ns (=50 ns/100) can be compared to the electron–ion collisional excitation which can be estimated by [19]:
We estimate the electron density to be ne =  * NAnode/Vpinch ≈ 1 × 1019 cm−3. For the sake of simplicity we assume a pinch with cylindrical geometry and
  = 10, NAnode = 4 × 10¹⁴, Vpinch = πhR2, h = 3.5 mm and R = 200 µm. Furthermore, we use an oscillator strength ful = 0.1 [18], an excitation energy ΔE = 92 eV and electron temperature of Te = 50 eV [17]. The determined time constant τcoll = 0.7 ns is very close to τem. This supports the assumption of a balance of excitation and radiation. The source of power for the excitation process is Ohmic heating, which is supported by the following consideration. In this approach we assume that the complete pinch current of about 10 kA is used to heat the pinch plasma. The electrical power is transferred by heating up the electrons and further collisional excitation of ions into EUV radiation. The heating power POhm can be estimated with the values used above and the Coulomb logarithm lnΛ = 5.2 [20], by application of the Spitzer conductivity σ [21]:

The evaluated POhm = 12 MW is in agreement with the estimated values for PEUV and thus is in agreement to the Ohmic heating approach.
4.3. Perspectives for further optimization of conversion efficiency
In case of a mismatched system (e.g. too high gas pressure), side effects as bypass currents may increase severely and thus would reduce the available heating power [17]. The origin of these currents lie in the ionization of uncompressed gas within the electrode system induced by the EUV emission itself. Within the Ohmic heating approach, the increase of bypass currents may be seen as the cause of the rather short EUV emission of around 50 ns that declines already ahead of the maximum discharge current [17] with a typical pulse length of more than 200 ns. Reducing this self-canceling effect can be seen as key strategy towards higher conversion efficiencies.
The experimentally observed line density for the optimum EUV emission of the given setup is connected with certain plasma dynamics to achieve these optimum conditions. Aspects of these plasma dynamics include magnetohydrodynamics, (Ohmic) heating, excitation and photon emission processes. Looking at the emission profiles and the EUV emission spectra the root causes for the decrease at lower and higher line densities can be identified in a qualitative manner. At low densities the efficiency drop can be referred to less excitation processes, whereas high line densities will lead to a lower electron temperature in addition to an increase of bypass currents. The observed similarity of EUV emission with respect to this line density parameter support the idea of similar plasma dynamics when keeping this parameter constant.
5. Conclusions and outlook
The influence of the electrode erosion, i.e. the change of electrode geometry due to volumetric loss, on the EUV emission in a gas discharge source has been investigated in order to increase the long term stability. This was achieved by defining counter-measures in the source settings, especially the working gas flow.
In particular, the working gas line density in the vicinity of the pinch plasma is demonstrated to characterize the EUV generation. Being based on the electrode dimensions and the anode pressure, it takes the interaction between gas flow and geometry into account and thus, can be regarded as a valuable figure of merit to quantify the status of the source with respect to electrode wear.
The deeper understanding and quantitative base for the relation between electrode geometry, gas flow and EUV emission is the key knowledge needed for the design of next generation electrode systems. It describes source parameters that can be used, to keep the EUV output at a constant level during operation. It also allows for the direct evaluation of an electrode system and its parameters of operation and such aids as design rule for electrode systems featuring a conversion efficiency of up to 0.7 %/2πsr, for example.
Based on the observed number of around 100 EUV photons per ion and pulse, the light generation can be estimated from a balance of Ohmic heating, collisional excitation and emission. The emission was evaluated to be up to 14 inband EUV photons per pulse and ion. The electron–ion collisional excitation and Ohmic heating have been identified as driving elements for the EUV generation. For the limitation of this process the occurrence of bypass currents induced by the ionization of ambient gas by EUV photons is proposed. Studying and diminishing this effect will be one of the main tasks for the upcoming development on increasing the conversion efficiency of this kind of EUV source.
The scalability of the EUV emission and peak brilliance for the concept under consideration has been shown with frequencies up to 2.8 kHz [22] and pulse energies up to 6.1 J [23]. With a matched electrode design based on the experimental results shown in this paper with a CE up to 0.7 %/2πsr this also gives access to an EUV power of more than 100 W/2πsr at 13.5 nm and 2% bandwidth. Further long-term experiments to increase the maintenance interval are currently being conducted employing an electrode design already foreseeing the effects of erosion.
Acknowledgment
Parts of this work have been supported by the Federal Ministry of Economic Affairs and Energy on basis of a decision of the German Bundestag.