

Abstract
This paper presents two novel large-stroke XY micropositioning stages that are fabricated completely using four-dimensional (4D) printed polylactic acid (PLA). The proposed designs do not require manual training to perform actuation. Instead, printing speed is used to achieve shape programming and manipulate the deformation and shrinking levels of the PLA microactuators that control the microstage. A relationship between the printing speed, number of layers, and deformation value is formulated to model the performance of the microactuators based on these variables. The same approach is then used to develop the two proposed designs in this work. One-way actuations in the x- and y-axes are achieved using PLA actuators that are printed at speeds in the range of 40–80 mm s−1, while the rest of the structure (passive part) is printed at a speed of 10 mm s−1 to minimize unwanted deformations. The microactuators are activated by immersing the designs in hot water at 85 °C. The maximum values of the x- and y-actuations are achieved when using the highest printing speed for the microactuators. Design 1 offers actuation values of 1.99 and 1.40 mm along the x- and y-axes, respectively, while these values are 1.76 and 2.30 mm when using Design 2. The proposed designs offer a cost-effective batch fabrication solution for micropositioning applications, where the weight of the PLA required for Design 1 and Design 2 is 48.37 g and 12.61 g, respectively, which respectively costs $0.65 and $0.17. The performance of the x- and y-axes actuations show repeatable results with standard deviation values of 0.062 and 0.050 for Designs 1, and 0.054 and 0.047 for Design 2, respectively. Moreover, the standard deviation of the reproducibility of the x- and y-axes actuations are 0.064 and 0.051 for Designs 1, and 0.054 and 0.048 for Design 2, respectively. In addition, the designs offer a promising performance compared to the currently available large-stroke micropositioning stages in terms of the simplicity of the fabrication process and the area ratio.
Export citation and abstract BibTeX RIS
1. Introduction
Micropositioning stages have been widely applied in various applications, such as optical fibers alignment [1], scanning force microscopy [2], cells manipulation [3], and precision manufacturing [4]. Such devices offer the ability to control the position of an object with a micrometer or sub-micrometer resolution. Traditionally, microstages have been realized as macroscale devices, but advances in microelectromechanical systems (MEMSs) fabrication techniques have allowed for the development of microscale microstages. Several actuation mechanisms have been utilized to drive MEMS-based micropositioning stages, such as shape memory alloy [5], piezoelectric [6], electrostatic [7], electromagnetic [8], electrothermal [9], and electroactive polymers [10]. However, micropositioning stages that utilize such actuation methods (piezoelectric actuation in most high-precision cases) require a complex and expensive fabrication process that is not suitable for batch fabrication [11, 12]. In addition, in several applications, micropositioning stages are required to perform large-stroke manipulations [13, 14], which is a challenging task that requires displacement amplification when using the aforementioned actuation approaches [15, 16]. Such issues can be addressed using four-dimensional (4D) printing to develop the entire micropositioning stage without requiring additional assembly steps.
4D printing is a revolutionized field stemming from three-dimensional (3D) printing, combining the prototyping freedom and complexity of 3D printing with the attractive characteristics of smart materials. This process allows the printed structure to change its shape over time depending on how the structure is modeled and the interaction mechanism between the smart materials of the structure and stimuli [17]. Therefore, these structures have the potential of implementing self-assembling and self-repairing into a fully functioning structure after some time when activated by external stimuli. 4D printed structures provide various advantages over traditional 3D printed ones, such as having the actuation unit embedded into the material itself leading to a significant volume reduction of the overall structure [18]. The shape-shifting capability is achieved using the shape memory effect (SME) found in smart materials. These smart materials are responsible for processing the applied stimuli and performing the actuation or shape-changing functionality that results in the overall change in the structure. 4D printed structures generally consist of an appropriate distribution of parts that do not change shape over time even when exposed to external stimuli, known as passive parts, and stimuli-responsive parts, known as active parts. The passive parts can be printed using the same smarts materials used for the active parts, but in this case, the passive parts do not include residual stress. This combination allows for a fully functional moveable structure to be fabricated in a single print [19].
The SME of shape memory polymers (SMPs) involves two processes, the programming process, and the recovery process. During the printing process, the printed part is programmed to be in the temporary shape, while the permanent shape is achieved when the part is exposed to an appropriate stimulus [20]. SME can be classified as one-way, two-way, and three-way shape memory [21]. In one-way shape memory, irreversibility is an issue once the part has recovered its original shape and a new programming process is required to reform the temporary shape. In two-way and three-way shape memory, the programming process only needs to be done once, causing the shape to be altered in a reversible manner. The SME of SMPs can be triggered by a variety of stimuli or even multiple stimuli simultaneously depending on the materials used [22], with the most common being heat. These materials use the glass transition temperature of the polymer, such as the polylactic acid (PLA), where it becomes in a rubbery state allowing it to be deformed relatively freely. These structures are programmed under temperature, which could be below or above the glass transition temperature, and then cooled down to be at a temporary shape [23]. The material then returns to its original shape due to a difference in the stress induced during the programming phase when its temperature is raised above its glass transition temperature [24, 25]. Other stimuli in 4D printing include swelling in solution mediums, where materials, such as hydrogels expand due to their hydrophily. However, these materials have slow responses as the materials must be dried to return to their original shape [26]. Light is also a typical stimulus for remote induction, which influences the polymer's form. Light with different wavelengths can trigger the change in the shape of the polymer [27]. Other stimuli include electrical induction [28], and magneto-responsive SME [29].
Fused deposition modeling (FDM) is the most popular 3D printing technique, which involves the extrusion of a continuous filament, usually a thermoplastic polymer. The filament is heated at the nozzle during the extrusion to a temperature above the melting temperature, which causes it to be in a semi-liquid state before being deposited onto the printing platform or on top of previously printed layers of the structure [18]. The printing of the material with a specific setting can be used to store strain in the structures, allowing the programming of the structures within the printing method [20]. Although printed at the same speed and temperature, each layer has different magnitudes of pre-strain as all layers before the final layer are partially reheated due to the extrusion of subsequent layers. This extra heat reduces the pre-strain value. Since the final layer is reheated the least compared to the first layer. It is expected that the pre-strain value is proportional to the number of layers. This difference in pre-strain value along the layers results in a bending shape-shifting behavior as the interface area between the layers must remain the same. There are several printing parameters that affect the pre-strain values in the printed layers, such as the printing speed, printing temperature, printing path orientation, and the number of layers [30, 31]. A higher printing speed provides more mechanical loading and thus induces a higher pre-strain value compared to a lower printing speed. The printing path orientation determines the direction of the pre-strain stored in the layer. Thus, printing each layer with a 0° raster angle ensures a higher pre-strain in the same direction of the actuation. On the other hand, higher printing temperature values provide lower mechanical loading, which reduces the pre-strain value. In addition, increasing the number of layers causes the ratio of the total pre-strain level to the number of layers to decrease.
Motivated by the aforementioned features of 4D printing, this work utilizes the FDM technique to print PLA large-stroke XY micropositioning stages. This approach reduces the complexity, time, and cost of the fabrication process of such micropositioning stages. The developed microstages demonstrated promising positioning results when activated using temperature. The main contributions of this paper, when compared to existing literature, are:
- To the best of the authors' knowledge, this is the first work that presents XY 4D-printed large-stroke PLA micropositioning stages. The proposed approach does not require manual training to achieve shape programming. Instead, printing parameters are used to achieve the desired shapes.
- The two designs proposed in this paper are novel and offer the ability to achieve large working range values compared to their design areas.
- The proposed micropositioning stages have the ability to operate when submerged in water since they do not include parts that can rust or require electricity.
The remainder of the paper presents the designs and discusses their working principle. Then, finite element analysis (FEA) is used to simulate the actuation of the microstages. Lastly, several experiments are performed to investigate the thermomechanical performance of the developed micropositioning stages.
2. Design and working principle
2.1. Microactuators design
In this work, each proposed micropositioning stage is completely printed using a single material, which is PLA. However, each stage includes actuation parts to move the stage, and passive parts to form the complete structure of the device. Such a behavior can be achieved by changing the printing speed (SP) of each part to eliminate the need for manual shape programming. The passive parts are printed at low speed while the active actuators are printed at higher speed values. Each 4D printed microactuator has a bending shape-shifting behavior during its shape recovery process, as shown in figure 1(a). The PLA microactuator was designed with length, width, and height values of 30 mm × 1.6 mm × 1 mm, respectively. After activation, the outer length (A1), opening length (A2), and depth of curvature (A3) were measured to characterize the actuation performance. The microactuator was printed using ten layers of PLA, where the height of each layer is 0.1 mm. The deformation behavior is caused by the pre-strain that is induced during the printing process, where the PLA filament is deposited along the x-axis, as illustrated in figure 1(b). This pre-strain is unbalanced along the z-axis, where the nth layer has a greater pre-strain compared to the first layer, causing the actuator to have an upward bending. The bending occurs when the beam is heated above the glass transition temperature (Tg). As the temperature approaches Tg, the actuator softens and relaxes the constrain on the memorized pre-strain, where the pre-strain is released non-uniformly.
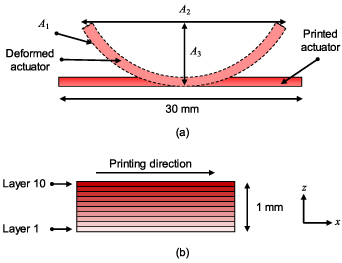
Figure 1. Working principle of the microactuator (not to scale). (a) Side view of the actuator before and after activation. (b) Cross-sectional view of the actuator showing the printed PLA layers.
Download figure:
Standard image High-resolution image2.2. Recovered shape prediction
In order to accurately design the microstages and study their performance, it is essential to investigate the effect of the printing speed on the PLA. Since no manual shape training is performed, then it is desired to control the actuation performance based on the printing speed. Thus, to obtain the recovered shape, the printed structure is heated at a temperature value higher than the Tg. From the recovered shape, the pre-strain induced in each layer can be calculated by considering each layer as a linear contraction, where each layer's contraction contributes to the bending of the actuator. The contraction is replicated by adjusting the coefficient of thermal expansion, which is done so based on the following equation [32]:
where n is the number of the current layer, αn is the coefficient of thermal expansion of the nth layer, L0 is the initial length of the actuator, and ΔLn is the change in length of the nth layer, and ΔT is the change in the temperature. The coefficient of thermal expansion of each layer is calculated for printing speed values of 10, 20, 40, and 70 mm s−1 to cover a wide range of predictive values, allowing the full range of printing speeds to be modeled. This was done by measuring the lengths of the top and bottom layers. Then, since the height of each layer is known (0.1 mm), it was possible to estimate the length and parameters of each layer based on arcs relationships with reference to the top and bottom layers. Table 1 presents the coefficient of thermal expansion values that are calculated using the recovered shape measurements. These measurements were acquired experimentally using the aforementioned printing settings (refer to section 4). The negative values of the coefficient of thermal expansion indicate that each layer contracts with the increase in temperature.
Table 1. Calculated coefficient of thermal expansion values for different layers at different printing speeds.
| Printing speed (mm s−1) | ||||
|---|---|---|---|---|
| CTE (1 °C−1) × 10−3 | 10 | 20 | 40 | 70 |
| α10 | −1.300 | −2.000 | −3.800 | −6.500 |
| α9 | −1.258 | −1.946 | −3.705 | −6.403 |
| α8 | −1.217 | −1.892 | −3.610 | −6.305 |
| α7 | −1.175 | −1.838 | −3.515 | −6.208 |
| α6 | −1.134 | −1.784 | −3.420 | −6.110 |
| α5 | −1.092 | −1.730 | −3.325 | −6.013 |
| α4 | −1.050 | −1.676 | −3.230 | −5.915 |
| α3 | −1.009 | −1.622 | −3.135 | −5.818 |
| α2 | −0.967 | −1.568 | −3.040 | −5.720 |
| α1 | −0.926 | −1.514 | −2.945 | −5.623 |
The coefficient of thermal expansion of each layer seems to have an almost linear relationship with the printing speed, where the R-squared value is 0.9677. Thus, it is possible to formulate an equation that relates these parameters using polynomial surface fitting so that the coefficient of thermal expansion of the nth layer can be represented as follows:
Equation (2) can accurately replicate the experimental results with an R-squared value of 0.9965. In addition, the equation can be further extended to cover a wider range of printing speed values and the number of layers, if needed. This can be clearly seen in figure 2, which presents the value of the coefficient of thermal expansion of different PLA layers when printed at speeds ranging from 10 to 80 mm s−1. Moreover, these results can be further validated by printing microactuators at different speed values and comparing them with the predicted results, which is demonstrated in the following sections. The developed equation can then be used to model the micropositioning stages in this case. This approach was reported to be reliable when modeling complex structures [20, 25].
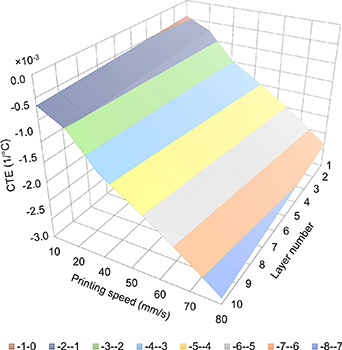
Figure 2. Calculated CTE of the PLA against the printing speed and number of layers.
Download figure:
Standard image High-resolution image2.3. Micropositioning stages designs
This study presents two micropositioning stages with different designs. Each design includes a microstage with dimensions of 10 mm × 10 mm × 2 mm, where its position is controlled by the actuators presented in the previous section (30 mm × 1.6 mm × 1 mm). Figure 3 presents the two designs proposed in this study, where the grey and red parts represent the passive and active (microactuators) elements of the designs, respectively. Both designs are fabricated completely using PLA while the difference in colors is used to illustrate the working principle. The passive parts were printed at a speed of 10 mm s−1, while the actuators were printed at a speed of either 40, 50, 60, 70, or 80 mm s−1. Thus, each design was fabricated using five different printing settings to investigate the effect of the printing speed of the microactuators on the performance of the designs. Based on the aforementioned observations, it is expected that designs with microactuators printed at higher speed values will offer higher actuation ranges.
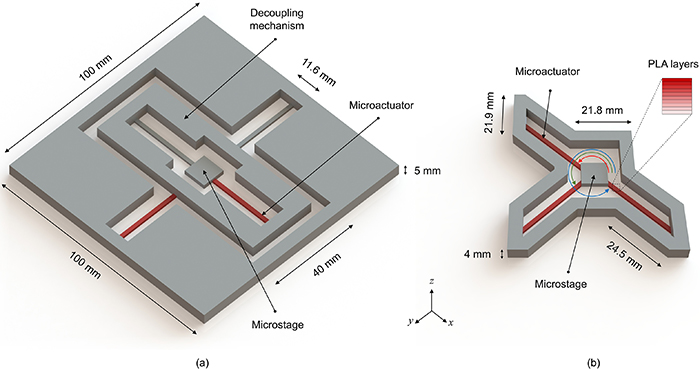
Figure 3. 3D views of (a) Design 1, and (b) Design 2. The red parts represent the microactuators, while the grey parts represent the passive elements of the micropositioning stages. The red, green, and blue arcs represent angles of 135°, 225°, and 315°, respectively.
Download figure:
Standard image High-resolution imageDesign 1 utilizes two identical microactuators to control the position of the microstage in the x- and y-directions. The two ends of the x-axis microactuator are fixed between the frame of the decoupling mechanism and the microstage. In addition, a passive supporting beam is fixed using the same way at the opposite side of the x-axis microactuator. This arrangement eliminates the bending of the microactuator towards the z-axis causing the actuator to shrink and pull the microstage along the x-axis. In addition, the beam on the opposite side ensures that the microstage does not rotate around the y-axis. The same concept is used for the y-axis microactuator, which is fixed between the outer frame of the device and the frame of the decoupling mechanism. The purpose of the decoupling mechanism is to eliminate the rotation of the microstage around the z-axis, which was observed in an initial prototype that did not include this mechanism. Such an unwanted rotation might be caused by the imperfection of the printing process. This mechanism increases the size of the device, but it also demonstrates that the microactuators have the ability to move objects with bigger mass values. The dimensions of Design 1 were selected so that the unwanted deformation is minimized. The height of the structure was selected to be 5 mm to reduce warping and deformation towards the z-axis. In addition, the height of the microactuators was set to 1 mm to achieve satisfactory deformation based on previous experience where the ratio between the length to the height of the actuator affects the deformation positively.
To overcome the aforementioned issues, Design 2 utilizes an asymmetrical star-like shape that has three identical microactuators that are connected to the microstage at angles of 135°, 225°, and 315°, causing the microactuators to form two isosceles right triangles. This asymmetrical shape was chosen to illustrate the effect of the shape of the device on the deformation, where the bending of the outer border can increase or decrease the actuation in a certain direction, as demonstrated in the following sections. The microactuators are placed in this arrangement to ensure that the microstage does not experience a rotational movement along the z-axis. Since each microactuator generates the same force value, resolving the force component results in a negative movement in the x- and y-directions. Since the forces are at an angle of 45°, the x- and y-components of the force are equal in magnitude, which eliminates the rotation of the microstage. In addition, Design 2 requires a structure with less height compared to Design 1 to minimize unwanted deformation towards the z-axis. Reducing the surface area of the passive parts offers the ability to reduce the edges warping, while the corners of the design reduce the deformation along the x- and y-axes. When comparing the two designs, it can be seen that Design 1 (100 mm × 100 mm × 5 mm) is significantly bigger than Design 2 (75 mm × 62.4 mm × 4 mm). In fact, the difference is more apparent when comparing the maximum equivalent volume taken by each structure (assuming a 100% infill ratio), which are 36.59 cm3 and 6.86 cm3 for Designs 1 and 2, respectively. Such a difference means that Design 2 is more suitable for compact applications and offers a reduction in the fabrication time and required material. However, it should be noted that Design 1 offers a higher degree of control of the x and y-axes actuations. Further comparisons are carried out in the following section using FEA and experiments.
3. FEA
Numerical simulations of 3D models of the microactuators, Design 1, and Design 2 were carried out using COMSOL Multiphysics®. Heat Transfer in Solids and Solid Mechanics physics were utilized and coupled using Multiphysics Thermal Expansion. In the simulation model, Heat Transfer in Solids was implemented under the assumption that there was no thermal loss to the surroundings. The temperature of the heat source was set to 85 °C to match the experimentally measured temperature, as discussed in the following section. Then, the heat was transferred gradually to the PLA by convection, according to the formula of the heat transfer rate ( ):
):

where h is the heat transfer coefficient, A is the surface area where the heat transfer occurs, and T2 and T1 are the temperature values of the surrounding water and the PLA, respectively [33]. The original location of a material particle can be represented by the coordinates X. At a certain time (t), the particle has moved to a new location, x = x(X,t). Therefore, the vector pointing from the original location of a point in the body to its new location is the displacement vector, u = u(X,t). Thus, the deformation gradient (F) can be defined as:
where I is the identity tensor. The displacement, the second Piola–Kirchhoff stress tensor (S), and the elastic strain tensor ( el) can be related by a linear momentum balance equation and a stress–strain equation, as follows:

where ρ is the density, ∇· is the divergence, fv is the volumetric force, and C is the elasticity tensor. As the temperature changes, a change in volume occurs, which can be represented as a thermal strain (th) that is given as:

where T is the current temperature, and Tref is the reference temperature [34]. The stress–strain relationship can be further derived by considering the glassy and rubbery phases of the material, as presented in [20, 34].
Mesh sensitivity analysis was carried out to ensure that the results of the simulation are independent of the mesh densities. This was done by refining the model mesh until the change in the simulation result was less than 2%. An advanced multi-level multi-discretization PARDISO solver was utilized to minimize the numerical error that arises from the discretization process. The material properties of the PLA were set based on the dynamic mechanical analysis (DMA) results (see section 5.1) and the general properties presented in table 2.
Table 2. Material properties of the PLA.
| Properties | Values |
|---|---|
| Density | 1240 kg m− 3 |
| Poisson ratio | 0.36 |
| Thermal conductivity | 0.13 W m−1 K−1 |
| Specific heat capacity | 1800 J kg−1 K−1 |
The simulation process started by analyzing the thermomechanical performance of the microactuators using different printing speeds. Then, Design 1 and Design 2 were analyzed and optimized based on the same process followed in the previous step. Figure 4 shows selected FEA results of the microactuator, Design 1, and Design 2 when using a printing speed of 80 mm s−1 for the actuators, while the passive parts were printed at a speed of 10 mm s−1. Figure 4(a) shows a side view of the deformation behavior of the microactuator when its two ends are free to deform. It can be seen that the maximum displacement towards that z-axis was around 6.96 mm. Figures 4(b) and (c) show top views of Design 1 and Design 2, respectively. It can be seen that the two designs were able to move the microstage along the x- and y-axes. The microstage in Design 1 moves towards the positive side of the x-axis and negative side of the y-axis while it moves towards the negative sides of both axes in Design 2. To simplify the comparisons between the two designs, we will consider the absolute values of the displacements. The maximum displacement values in the x- and y-directions were respectively 1.99 mm and 1.41 mm for Design 1, and 1.89 mm and 2.37 mm for Design 2. It should be noted that the maximum values shown in figures 4(b) and (c), which are 2.44 and 3.03 mm, represent the total magnitude of the x- and y-components of the displacement.
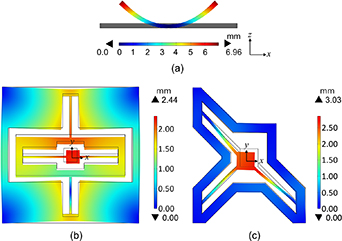
Figure 4. FEA results of (a) side view of the microactuator, (b) top view of Design 1, and (c) top view of Design 2. The printing speeds are 10 and 80 mm s−1 for the passive and active parts, respectively.
Download figure:
Standard image High-resolution imageIn Design 1, the displacement in the x-direction is higher than that in the y-direction due to the fact that the actuation in the latter case requires pulling the decoupling mechanism, x-axis microactuator, supporting beams, and microstage. In addition, it can be noticed that the internal frame shows an unwanted deformation of 1.37 mm towards the center. In Design 2, as discussed previously, the asymmetrical shape of the design can affect the displacement along the x- and y-axes. In this case, the outer frame deforms slightly along both axes, with a maximum deformation of 0.27 mm. However, this deformation is not uniform in terms of magnitude and direction. It can be seen that the frame deforms towards the inside of the design in certain regions, while it deforms towards the outside in other regions. This varies the value of stress put on the ends of the microactuators causing them to actuate differently even though they are identical. The frame bends differently at different locations, causing different levels of stress on the microactuators attached to the frame. This stress counters the deformation of the microactuators at different locations with different values based on the deformation of the frame. This explains the difference in the values of actuations along the x- and y-axes in Design 2. Additional FEA results and comparisons with the experimental results are presented in section 5.
4. Fabrication process and experimental setup
3D computer-aided design models of the designs were created using SolidWorks software. Simplify3D slicer was used to generate G-code files for the 3D printer since this slicer offers a high level of control of the printing parameters. The printer used in this study is an FDM printer Ender 3 V2 (Creality, Shenzhen Creality 3D Technology Co., Ltd). The filament material is PLA (1.75 mm PLA Pro Filament 1.0 kg Gray, Flashforge, Flashforge 3D Technology, Co., Ltd, Zhejiang, China), which is rated for printing temperatures of 190 °C–220 °C. The printing temperature and build platform temperature were set to 200 °C and 45 °C, respectively. The filament was extruded through a 0.4 mm nozzle with a layer height of 0.1 mm. A raster angle of 45° and −45° was used for the passive parts to ensure that they are structurally stable, while a raster angle of 0° was used for the microactuators. As stated previously, the passive parts were printed at a speed of 10 mm s−1, while the actuators were printed at a speed of either 40, 50, 60, 70, or 80 mm s−1. After completing the printing process, the designs were left to cool down to room temperature and then removed from the print bed. The actuation performance was characterized by immersing the designs in a beaker filled with hot water of a temperature of 85 °C, which is higher than the Tg of PLA (∼65 °C). This is done to ensure that a full release of the internal strain is achieved. Meanwhile, the temperature was maintained constant using a hotplate and monitored using a thermocouple to ensure equal heat flow to all the structure. In addition, the actuation was recorded using a camera for 60 s to ensure that the actuation reached a steady-state value. Then, the recorded video was analyzed using Tracker software, which is a video-analysis and modeling tool. The aforementioned steps are illustrated in figure 5. It should be noted that the fabrication and characterization steps are the same for the microactuators used for the deformation prediction, Design 1, and Design 2.
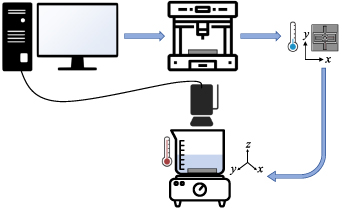
Figure 5. Fabrication process and experimental setup. Design 1 is used as an illustration example (not to scale).
Download figure:
Standard image High-resolution image5. Results and discussion
5.1. Material properties
In order to accurately measure the material properties of the PLA filament, DMA was carried out using a DMA machine (DMA 8000, Perkin Elmer, MA, USA). The DMA test was conducted using axial tensile clamping at a frequency of 1 Hz. The heating of the material in the heating chamber was set to increase from 30 °C to 100 °C at a rate of 5 °C per minute. The results of the DMA test are presented in figure 6. These results are essential for the FEA process and to find the temperature required to activate the microactuators so that they release their internal strain completely. The glass transition temperature can be determined by taking the definition of the tan δ, which is the ratio of loss modulus, E'', to storage modulus, E'. The storage modulus measures the energy stored in the material and represents the elastic portion. As the material transitions from the glassy phase to the rubbery phase, it becomes more flexible, and less energy is stored in the material since the molecules of the material move with the given force. Thus, the storage modulus decreases with the increase in temperature. The loss modulus measures the energy dissipated as heat from the material and represents the viscous portion. At Tg, the molecules of the material begin to move freely due to the increase in kinetic energy from the increase in temperature and the weakening of the molecular bond. However, the initial movement is difficult due to molecular friction, which is dissipated as heat. As the temperature is further increased, the molecular friction is reduced, and less energy is dissipated. Thus, the loss modulus initially increases with temperature and decreases afterward.
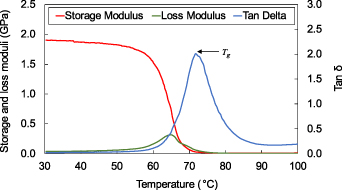
Figure 6. DMA results of the PLA sample.
Download figure:
Standard image High-resolution image5.2. 4D printing results
As discussed previously, the effect of the printing speed on the deformation of the microactuators has been investigated. Equation (2) was used to predict the values of the coefficient of thermal expansion of each layer in the microactuators. These predicted values were then used in the FEA studies. In addition, to validate equation (2), additional printing speeds were utilized. Printing speeds in the range of 10–80 mm s−1 were used in the simulation and experiments to perform the comparisons. The shape parameters (A1, A2, and A3) presented in section 2.1 were then calculated based on FEA results and compared with the experimental ones. Table 3 presents a selected comparison range when using printing speeds of 40, 50, 60, 70, and 80 mm s−1 since the deformation values are more significant at these values when compared to lower printing speeds. The shape parameters were measured and calculated after achieving the maximum deformation. The table shows that the simulated results agree well with the experimental results, with a maximum error of 0.13 mm among all tested variables.
Table 3. Comparisons between the experimental and simulated recovered-shape parameters at different printing speeds.
| Printing speed (mm s−1) | ||||||
|---|---|---|---|---|---|---|
| Shape parameters | 40 | 50 | 60 | 70 | 80 | |
| A1 (mm) | Exp. | 28.39 | 28.44 | 27.36 | 27.20 | 26.86 |
| Sim. | 28.40 | 28.36 | 27.46 | 27.32 | 26.82 | |
| A2 (mm) | Exp. | 25.88 | 25.16 | 23.47 | 22.37 | 21.30 |
| Sim. | 25.84 | 25.03 | 23.54 | 22.39 | 21.17 | |
| A3 (mm) | Exp. | 5.01 | 5.67 | 6.09 | 6.57 | 6.92 |
| Sim. | 5.04 | 5.70 | 6.03 | 6.64 | 6.96 | |
These results validate the possibility of implementing the proposed approach in the design process of the micropositioning stages. As mentioned previously, the passive parts of the stages were printed at 10 mm s−1, while the actuators were printed at speeds higher than that. In this analysis, we will continue presenting the results and comparisons based on the printing speeds presented in table 3.
Designs 1 and 2 were fabricated using the aforementioned printing speeds for the microactuators. Figure 7 presents the fabrication results of Design 1 when using different printing speeds for the microactuators. Figure 7(a) shows the initially printed shape of Design 1, which is the same initial shape when using any printing speed for the microactuators. Figures 7(b)–(f) show the maximum actuation results after activating Design 1 for 60 s in water with a temperature of 85 °C, where the printing speeds of the microactuators were 40, 50, 60, 70, and 80 mm s−1, respectively. It can be seen that in all cases, the microstages were actuated along the positive parts of the x-axis and negative parts of the y-axis. The shape recovery of each microactuator forces the microstage to be pulled along the axis that corresponds to that microactuator. On the other hand, the supporting beam that holds both the microactuator and microstage softens during the shape recovery process of the microactuator, affecting the performance of the designed microstage. Thus, the supporting beam must be resistant to the deformation that is induced by the microactuator. Therefore, the supporting beam is printed with an infill density of 30% and a standard raster angle of 45° and −45° to ensure minimal deformation. This arrangement ensures that the microstage exhibits a linear movement during the activation process.
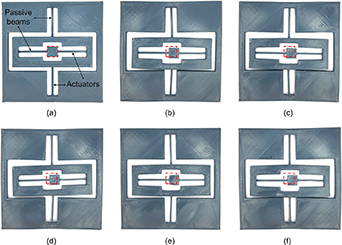
Figure 7. Printed samples of Design 1 showing (a) the initial structure before activation, and after activation when printing the microactuators at a speed of (b) 40, (c) 50, (d) 60, (e) 70, and (f) 80 mm s−1. The 10 mm × 10 mm red squares represent the original location of the microstage before activation.
Download figure:
Standard image High-resolution imageIt can be noted that the values of the x- and y-actuations increase gradually when using higher printing speeds for the microactuators. This is also noted when observing the location of the decoupling mechanism, which gets very close to the frame of the design (∼0.1 mm) when using a printing speed of 80 mm s−1. In addition, it can be noted that unwanted deformations occur at different parts of the design, especially at the decoupling mechanism parts. The deformations are not uniform in certain locations, which might be caused by the imperfection of the printing process. These deformations are caused by the shrinking of the microactuators, causing the structure to be pulled towards the center. This issue can be addressed by using internal heating elements using conductive traces, or local heating of the microactuators only using a hot air gun, for instance, which ensure a minimal heat transfer to the rest of the structure. Another possible approach is using screws to fix the frame of the design, which is an approach that is commonly used in micropositioning stages. However, this approach might not be suitable in certain applications that require fast batch-processing, or when the environment does not provide suitable fixing support for the microstage design. Thus, in this work, we propose optimizing the design in such a way that reduces the unwanted deformation of the structure without using additional parts.
Design 2 offers a solution for the aforementioned issues by greatly reducing the value of the unwanted structure deformation while using a smaller structure that achieves higher actuation values. Figure 8(a) shows the initially printed shape of Design 2, which is the same initial shape when using any printing speed for the microactuators. Figures 7(b)–(f) show the maximum actuation results after activating Design 2 for 60 s in water with a temperature of 85 °C, where the printing speeds used to print the microactuators were respectively 40, 50, 60, 70, and 80 mm s−1. It can be seen that the actuation occurs along the negative parts of the x- and y-axes. Design 2 has an asymmetrical star-like shape that utilizes three identical microactuators connected to the microstage at angles of 135°, 225°, and 315°, causing the microactuators to form two isosceles right triangles. This design does not utilize supporting beams like the ones used in Design 1. On the contrary, Design 2 utilizes the special arrangement of the microactuators to pull the microstage along the x- and y-axes while preventing it from rotating around the z-axis.
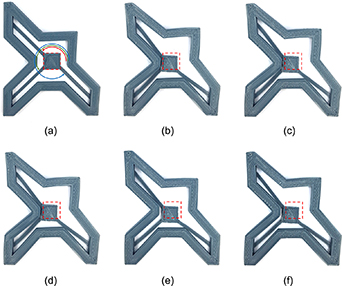
Figure 8. Printed samples of Design 2 showing (a) the initial structure before activation, and after activation when printing the microactuators at a speed of (b) 40, (c) 50, (d) 60, (e) 70, and (f) 80 mm s−1. The 10 mm × 10 mm red squares represent the original location of the microstage before activation. The red, green, and blue arcs represent angles of 135°, 225°, and 315°, respectively.
Download figure:
Standard image High-resolution imageThe x- and y-actuations of Design 2 increased when using higher printing speeds for the microactuators, as was observed in Design 1. On the other hand, the deformation of the frame showed an opposite behavior. While the x- and y-actuations are towards the negative sides of the x- and y-axes, the deformation of the frame occurs outwards away from the center of the design. In addition, the unwanted deformation seems to reduce when using a higher printing speed. This is more apparent when considering the edge of the frame at 180°. The deformation cannot be eliminated completely due to the shrinking behavior of the material. However, higher printing speeds cause the microactuators to shrink more, which pulls the frame from three points at 135°, 225°, and 315°. Pulling these points towards the center causes other parts of the frame, especially at 45° and 180°, to deform outwards. Thus, the deformation drawback can be reduced by using higher printing speeds for the microactuators. However, the performance of this design might be limited due to the restrictions caused by the shape of the frame. It can be seen that all microactuators touch the frame at maximum actuation when using all printing speeds except 70 and 80 mm s−1, where only two microactuators touch the frame (see figures 8(e) and (f)). This can be addressed by modifying the shape of the frame. However, there is a trade-off between modifying the shape of the frame to increase the actuation range, and the unwanted deformation of the frame.
The performance of the two designs can be further analyzed by investigating the temporal response when using different printing speeds for the microactuators. Figure 9 shows the actuation performance of Design 1 when activated for 60 s. The absolute values of displacement are used to simplify the comparisons between the two designs. The FEA results presented in figures 9(a) and (b) show a gradual increment in the x-axis actuation from 1.35 to 1.99 mm when increasing the printing speed from 40 to 80 mm s−1. The same behavior is observed when analyzing the y-axis actuation, where the actuation increased from 0.83 to 1.41 mm when increasing the printing speed from 40 to 80 mm s−1. The experimental results presented in figures 9(c) and (d) showed similar behavior and results. The final values of the actuations in the x- and y-axes from the experimental results agree well with the FEA results. However, there is a difference in the settling time of the responses. The FEA results reach steady-state values in around 10 s, while the experimental results require around 20 s to do so. This can be caused by the non-uniformity of the temperature distribution in the experimental results, modeling uncertainties, and the difference in the printing infill ratio between the simulation and experimental results.
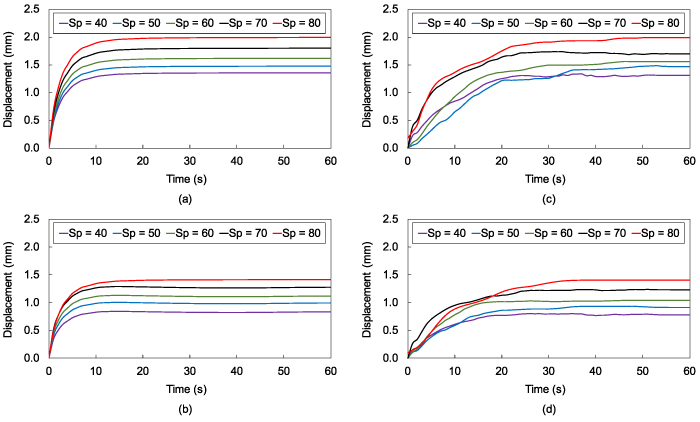
Figure 9. Actuation responses showing the microstage position in Design 1 at different printing speeds. FEA results of the actuation along the (a) x-axis (b) y-axis, and experimental results of the actuation along the (c) x-axis (d) y-axis.
Download figure:
Standard image High-resolution imageA similar behavior can be observed when analyzing the temporal responses of Design 2, as illustrated in figure 10. As stated previously, the direction of actuation in Design 2 is towards the negative sides of the x- and y-axes. The absolute values are used to simplify the comparisons between the two designs. The FEA results presented in figures 10(a) and (b) show that increasing the printing speed from 40 to 80 mm s−1 has increased the maximum actuation from 1.08 to 1.89 mm on the x-axis, and from 1.70 to 2.37 mm on the y-axis. Moreover, the experimental results in figures 10(c) and (d) agree well with the FEA results. In fact, the settling times of the experimental responses look comparable to the simulated ones. It can be seen that most experimental responses take around 15 s to reach steady-state values, while the FEA responses require around 10 s. This improvement in the experimental responses might be caused by the use of three microactuators that can overcome the initial opposing force of the frame faster when compared to Design 1. By analyzing figures 9 and 10, it can be indicated that increasing the printing speed by 10 mm s−1 has increased the value of the actuation by an average of 10.11% and 15.08% in the x- and y-directions, respectively, while Design 2 showed an average of increment by 14.16% and 8.59% in the x- and y-directions, respectively.
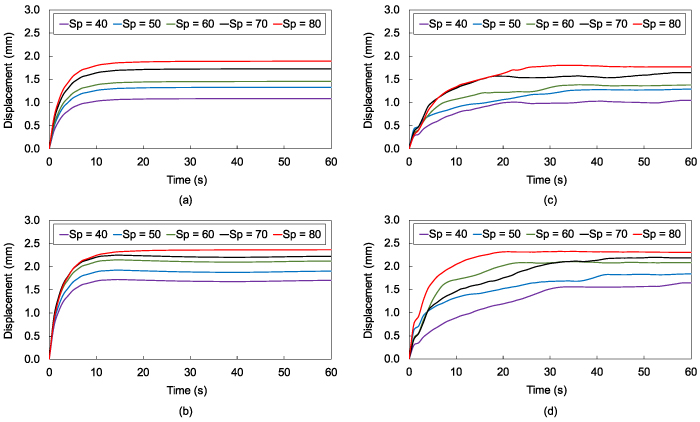
Figure 10. Actuation responses showing the microstage position in Design 2 at different printing speeds. FEA results of the actuation along the (a) x-axis (b) y-axis, and experimental results of the actuation along the (c) x-axis (d) y-axis.
Download figure:
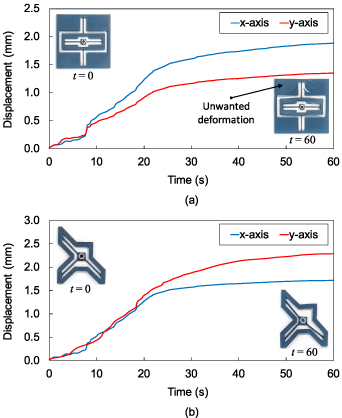
Standard image High-resolution imageAs a proof of concept, each design was used to manipulate the position of a hexagonal metal nut with a mass of 1 g. The microactuators of Designs 1 and 2 were printed at a speed of 80 mm s−1. Each design was immersed in water so that the water was the same height as the height of each design (5 mm and 4 mm for Designs 1 and 2, respectively). Figure 11 shows the displacement of the microstage of Design 1 and Design 2 with snapshots of the designs at the beginning and end of the test. Figure 11(a) shows that Design 1 was able to achieve a maximum displacement of 1.95 mm and 1.39 mm along the x- and y-axes, respectively. A slight unwanted deformation towards the z-axis was observed as the top left side rose above the water level, as shown in figure 11(a). Design 2 showed a maximum displacement of 1.73 mm and 2.29 mm along the x- and y-axes, respectively, as shown in figure 11(b). It can be seen that both designs required a longer time to achieve full displacement along the x- and y-axes. In addition, a slight reduction in the displacement along both axes was noted, where the average reduction of the displacement along both axes was 1.36% and 1.07% in Designs 1 and 2, respectively. This proves the ability of the proposed design to manipulate the position of small objects without a significant loss in the displacement range.
Figure 11. Actuation responses of the microstage position when moving a load along the x- and y-axes using: (a) Design 1, and (b) Design 2. The microactuators were printed at 80 mm s−1.
Download figure:
Standard image High-resolution image
The experimental performance of the proposed designs in this work is compared with previously reported XY large-stroke micropositioning stages, as shown in table 4. So far, this type of stage mainly uses voice coil motors, voice coil actuates, and various types of linear actuators [35–39]. These motors and actuators are bulky and require an expensive and complex fabrication process. Thus, attention must be paid when evaluating the performance of such designs since including the area of the actuators in the design area can greatly increase the total area of the design. On the other hand, our designs utilize microactuators that are printed using the same material of the whole structure of the devices. Thus, when considering the area ratio, which is the ratio of the design area to the working range, it can be indicated that our designs provide a promising performance compared to other micropositioning stages. In addition, the proposed designs offer a cost-effective batch fabrication solution for micropositioning applications, where the weight of the PLA required for Design 1 and Design 2 is 48.37 g and 12.61 g, respectively, which respectively costs $0.65 and $0.17. Moreover, the printing process requires using a 3D printer that is much cheaper than the fabrication facilities required to machine the reported micropositioning stages, such as computer numerical control machines and electrical discharge machines. The performance of the proposed designs can be further improved by optimizing the designs, printing additional fixing mechanisms, using fixing screws when needed, or using a printing material with a lower Tg value [40]. In addition, conductive PLA can be used as a printing material for the microactuators to offer the ability to perform actuation using Joule heating instead of hot water or hot air [41].
Table 4. Performance comparison of different XY large-stroke micropositioning stages.
| References | Design area (mm2) | Working range (mm × mm) | Area ratio | Actuators |
|---|---|---|---|---|
| [35] | 48 400 a | 4 × 4 | 3025 | VCAs |
| [36] | 59 536 a | 12.7 × 12.7 | 369.12 | VCMs |
| [37] | 17 689 a | 20 × 20 | 44.22 | VCMs |
| [38] | 196 249 a | 50 × 50 | 78.50 | VCAs |
| [39] | 56 896 a | 20 × 20 | 142.24 | Linear actuators |
| Design 1 | 10 000 | 1.99 × 1.40 | 3589.38 | 4D-printed PLA |
| Design 1 a | 10 000 | 1.95 × 1.39 | 3689.35 | 4D-printed PLA |
| Design 2 | 2457 a | 1.76 × 2.30 | 607.01 | 4D-printed PLA |
| Design 2 b | 2457 c | 1.73 × 2.29 | 683.16 | 4D-printed PLA |
6. Conclusion
Two novel large-stroke XY micropositioning stages were developed in this work. The devices were fabricated completely using 4D printed PLA. The design process started by investigating the actuation performance of PLA microactuators before integrating them into the proposed devices. This was done to formulate a predictive model for the deformation, which relies on having different a coefficient of thermal expansion for each layer of the microactuator. Such behavior was caused by the pre-strain of the filament, which is caused by stretching the filament during the printing process and the effect of the temperature of the current layer on the layers below it. The formulated model was able to replicate the experimental results with a high level of accuracy. Thus, it was possible to develop the proposed micropositioning designs and simulate their response based on the aforementioned findings. Actuations in the x- and y-axes were achieved using PLA actuators that were printed at speeds in the range of 40–80 mm s−1, while the rest of the structure (passive part) was printed at a speed of 10 mm s−1 to minimize unwanted deformations. The maximum values of the x- and y-actuations were achieved at 85 °C when using the highest printing speed for the microactuators. Design 1 achieved maximum actuations of 1.99 and 1.40 mm along the x- and y-axes, respectively, while these values were 1.76 and 2.30 mm when using Design 2. The proposed designs were able to achieve repeatable actuation performance along the x- and y-axes with standard deviation values of 0.062 and 0.050 for Designs 1, and 0.054 and 0.047 for Design 2, respectively. Furthermore, the standard deviation of the reproducibility of the x- and y-axes actuations were 0.064 and 0.051 for Designs 1, and 0.054 and 0.048 for Design 2, respectively. A maximum tolerance of 0.1 mm due to the limitations of the tracking method (using a camera and a tracking software). This characterization can be improved by using a displacement sensor with a higher resolution. The designs showed promising performance compared to the currently available large-stroke micropositioning stages in terms of the fabrication cost and complexity, as well as the area ratio. Future work may involve optimizing the designs to enhance the actuation performance and reduce unwanted deformation, using materials with lower glass transition temperatures, and using conductive SMPs to allow activation using Joule heating.
Acknowledgments
This work was supported by the Ministry of Higher Education Malaysia under the Fundamental Research Grant Scheme (FRGS/1/2019/TK05/UNIM/02/2), and the University of Nottingham Malaysia.
Data availability statement
The data that support the findings of this study are available upon reasonable request from the authors.