

Abstract
Fatigue is a major contributing factor to operational errors. Therefore, the validation of objective and sensitive indices to detect fatigue is critical to prevent accidents and catastrophes. Whereas tests based on saccadic velocity (SV) have become popular, their sensitivity in the military is not yet clear, since most research has been conducted in laboratory settings using not fully validated instruments. Field studies remain scarce, especially in extreme conditions such as real flights. Here, we investigated the effects of real, long flights on SV. We assessed five newly commissioned military helicopter pilots during their aviation training. Pilots flew Sikorsky S-76C helicopters, under instrumental flight rules, for more than 2 h (ca. 150 min). Eye movements were recorded before and after the flight with an eye tracker using a standard guided-saccade task. We also collected subjective ratings of fatigue. SV significantly decreased from the Pre-Flight to the Post-Flight session in all pilots by around 3% (range: 1–4%). Subjective ratings showed the same tendency. We provide conclusive evidence about the high sensitivity of fatigue tests based on SV in real flight conditions, even in small samples. This result might offer military medical departments a valid and useful biomarker of warfighter physiological state.
Export citation and abstract BibTeX RIS
1. Introduction
Military actions are complex in nature and, therefore, substantial attentional and cognitive demands are required in order to operate safely. Inadequate sleep and extended hours of duty are detrimental to operators' capacities, leading to decrements in task performance (Thomas and Russo 2007). Nevertheless, fatigue and sleepiness are common among military personnel, and they have been recognized as major contributing factors to operational errors (Akerstedt 2000). Indeed, fatigue is the most frequently cited physiological factor contributing to the occurrence of accidents in the military (Davenport 2012), costing hundreds of millions of dollars in lost equipment in addition to the incalculable value of lost human lives (Nunes and Cabon 2015). Despite decades of research showing that fatigue significantly degrades neurobehavioral performance and fundamental operative skills (Gawron 2015), warfighters—trying to gain tactical advantages over the enemy—still operate while fatigued (Caldwell et al 2004a, Previc et al 2009). For this reason, the development of a sensitive method to objectively monitor and detect fatigue among warfighters, and thus prevent catastrophic outcomes in operational environments, is an area of great interest to the military (Tennison and Moreno 2012, Di Stasi et al 2015a, 2016). Neuroergonomics (Mehta and Parasuraman 2013) might help to reduce fatigue-related accidents providing scientific-based recommendations for new work schedule regulations and individualized fatigue assessment tools (National Research Council 2009).
Since the late eighties, military (Schmidt et al 1979) and civil (Bahill and Stark 1975, Uri et al 1989) neuroscientists have focused their attention on the sensitivity of the saccadic velocity (SV, the fastest movement the human body can perform) to detect impaired cognitive states resulting from, for example, environmental conditions (e.g. space flight) (Uri et al 1989) or fatigue (e.g. reduced level of alertness) (Schmidt et al 1979). Because SV is not under voluntary control (i.e. we can decide to move our eyes, but we cannot control their speed (Galley 1989)), a fatigue assessment tool based on this non-invasive index has the potential to provide an accurate and unbiased measure of the operator's fatigue level (Di Stasi et al 2014a) and might help to reduce fatigue-related accidents. Although sensitive fatigue detectors already exist, most of them are based on the spontaneous eye-blink rate (e.g. dashboard-mounted devices, as the FaceLab system, or those built into the frame of the eye glasses, as Optalert) (see Dawson et al (2014) for a recent review). These instruments rely on the fact that, when fatigued, the eyes are closed more often and for longer periods of time (Stern et al 1994, Schleicher et al 2008, Benedetto et al 2011). It is important to note that these longer and more frequent eye closures increase the loss of visual information and cause a higher likelihood of errors (Di Stasi et al 2012, 2015b). A saccadic velocity-based fatigue system would not rely on the eye closure behavior beyond a pre-defined interval to set off an alarm, and would therefore be capable of detecting fatigue before it shows its effects on blinks and causes loss of visual information.
Even though several works have suggested that a fatigue detector based on SV variations is feasible, studies investigating the effects of fatigue and sleepiness on SV in military personnel—a population that is specifically trained to perform while fatigued (Weeks et al 2010)—are scarce (see table 1). Military training, as well as military occupational activities, produce quantifiable and specific effects on endocrine, neurologic and cognitive functions (Leggat and Smith 2007, Weeks et al 2010, Carden et al 2015) that influence, among other factors, resistance to fatigue (Flower 2012). Therefore, detecting the effects of fatigue in the military—compared to civilian settings—is extremely challenging (Weeks et al 2010).
Table 1. Schematic review of empirical studies involving military personnel (people trained to deal with fatigue) and analyzing saccadic velocity as a fatigue/sleepiness index. All studies were performed after 1995, year of commercialization of the first PMI fitness-for-duty/impairment screener (FIT, Pulse Medical Instruments Inc., Rockville, MD, USA).
| Authors | Year | Country | Participants | N | ED | h | Assessment tool | SV | |
|---|---|---|---|---|---|---|---|---|---|
| C | Arnold et al (2013) (R) | 2010 | US | Personnel from the naval aviation preflight indoctrination | 15S | SD | 25 | FIT2000 | ▼ |
| Chandler et al (2010) (R) | 2010 | ▼ | |||||||
| Arulanandam and Tsing (2009) (P) | 2009 | Singapore | Ship crew | 24S | WS | N/A | FIT2000 | ▼ |
|
| C | Caldwell et al (2004b) (R) | 2004 | US | F-117A pilots | 5S | SD | 37 | FIT | ▼ |
| Caldwell et al (2004a) (P) | 2004 | 10S | ▼ | ||||||
| Chandler (2011) (R) | 2011 | US | Military personnel | 24S | PSD |
N/A | FIT2000 | ▼ | |
| Chandler (2012) (R) | 2012 | US | Student naval flight officers | 31S | NS | N/A | FIT2000 | ♦ | |
| Di Stasi et al (2014b) (P) | 2014 | Spain | Military pilots and flight engineers | 12S | TOD | 3 | EyeLink1000 | ▼ | |
| Di Stasi et al (2016) (P) | 2016 | US | AH-1W S-cobra pilots | 26 | TOD | 2 | EyeLink II | ▼ | |
| C | Gould et al (2009) (P) | 2009 | Norway | Fast patrol boats military navigators | 5S | SD | 60 | FIT2000/EOG | ♦ |
| Hirvonen et al (2010) (P) | 2010 | 11S | ▼ | ||||||
| LeDuc et al (2005) (P) | 2005 | US | AH-64 apache pilots | 53S | TOD | N/A | FIT | ▼ | |
| McIntire et al (2013) (R) | 2013 | US | Active duty soldiers | 19S/Cv | TOD | N/A | Eye-Com | ▴ | |
| Miller et al (1998) (R) | 1998 | US | Coast guard crew | 8S | WS | N/A | FIT2000 | ▬ | |
| Miller et al (2003) (R) | 2003 | US | Navy submariners | 9S | WS | N/A | FIT2500 | ▬ | |
| Morad et al (2009) (P) | 2009 | Israel | Transportation unit drivers | 29S | NS | N/A | FIT2500 | ♦ | |
| Morris and Miller (1996) (P) | 1996 | US | Air force pilots | 9S/1Cv | PSD/TOD | 12 | EOG | ♦ | |
| Portman-Tiller (1998) (R) | 1998 | US | Naval aviation candidates | 9S | SD | 24 | FIT | ▬ | |
| Previc et al (2009) (P) | 2009 | US | Air force pilots | 10S | SD | 34 | Eye-trac 6000+ | ♦ | |
| Sievert et al (2011) (A) | 2011 | Germany | Infantry soldiers | 80S | SD | N/A | SmartEyeR | ▼ | |
| Tong et al (2014) (P) | 2014 | US | Military volunteers | 97S | SD | 26 | EyeLink1000 | ▼ | |
| Van Dongen et al (2006) (P) | 2006 | US | F-117 pilots | 10S | SD | 24 | FIT/EOG | ♦ |
Note: A = abstract; C = complementary reports; Cv = civilians; ED = experimental design; h = hours; N = sample size; N/A = not available; NS = normal sleep; P = scientific paper; PSD = partial sleep deprivation; R = report; S = soldiers; SD = sleep deprivation; SV = saccadic velocity; TOD = time-on-duty; WS = work schedule. ▼ (SV decreases), ▴ (SV increases), ▬ (no effect), ♦ (unable to retrieve valid results). aAfter 36 h in rotating schedule.b 4 h of sleep/each 24 h.
Most studies with military populations have investigated sleepiness caused by sleep deprivation. All of them, after implementing total or partial sleep deprivation protocols (ranging from 16 h to 60 h), pointed out to a clear decrement in SV (Caldwell et al 2004a, 2004b, Chandler et al 2010, Hirvonen et al 2010, Chandler 2011, Sievert et al 2011, Arnold et al 2013, Tong et al 2014). Studies focused on the effects of fatigue caused by more or less prolonged military operations tasks on SV are scarce and not conclusive. Only three of them found SV decrements after performing tasks lasting from 40 min to 3 h (LeDuc et al 2005, Di Stasi et al 2014b, 2016) (but see Morris and Miller (1996) and McIntire et al (2013)). Furthermore, the only study performed in real conditions, carried out by LeDuc et al (2005), used a not fully validated fatigue detector system (see section 4 for more details). Therefore, to date, no study has proved that SV is sensitive enough to detect fatigue variations in real military operations (Di Stasi et al 2016).
Time-on-flight (TOF) is one of the main causes leading to pilot fatigue (Caldwell 2012) because of alterations in pilot's arousal (Roca-Dorda et al 2006). Here, we tracked SV of newly commissioned pilots, using a standardized oculomotor test, before and after a real instrument-flight-rules (IFR) training flight of more than 2 h. Flying under IFR—i.e. without using external reference points to see where the aircraft is going—is one of the most demanding and risky tasks for the pilot (Hasbrook and Rasmussen 1970, Bennett and Schwirzke 1992, Hankins and Wilson 1998, Wilson 2002). Taking into account that the demands imposed by a task also modulate fatigue levels (Wickens and McCarley 2007), we hypothesized that, after more than 2 h of TOF, pilots would experience higher fatigue levels, compared to the Pre-Flight level, and that SV will reflect this effect. Our main aim was to present conclusive evidence on the validity and sensitivity of the SV as a fatigue biomarker for a warfighter.
2. Methods
2.1. Ethical approval
The experiment was approved by the Spanish Air Force General Air Warfare Command and carried out under the guidelines of the University of Granada's Institutional Review Board (IRB approval #866). We conducted the study in conformity with the Code of Ethics of the World Medical Association (WMA) (1964). We obtained written informed consent from each pilot prior to the start of the study.
2.2. Participants
Participants attended the 78th Air Wing, the Base of the Spanish Air Force Helicopter School, in Armilla (Granada, Spain) to carry out a mandatory course of instrumental flight. Five student pilots (all male) at the fifth (last) year of the basic cadet training volunteered to participate in the study. All pilots had normal vision and underwent a full physical examination prior to participating in the study. All pilots were right-handed and on flight status at the time, indicating recent good health. Mean age, height, and weight (±standard deviation, SD) were 27.6 ± 1.7 years, 180.4 ± 5.8 cm, and 79.6 ± 7.5 kg. Thus, any age-related influences on SV metrics (Bahill et al 1981, Abel et al 1983) were controlled for. They averaged (±SD) 107 ± 22 flight hours, range: 80–135 h, in all rotary-wing aircraft types. All were qualified to fly the Eurocopter EC 120 helicopter. They reported an average (±SD) 6.3 ± 0.4 h of sleep (range: 6–7) during the night previous to the evaluated flight.
Sample size calculation (using GPower v3.1.9.2) was based on recent published data from our laboratory (Di Stasi et al 2016) involving the same eye tracker technology and a similar population (i.e. US Marine Corps helicopter pilots (n = 15)) and similar task (i.e. ~120 min of simulated flight). To exceed the general convention of 80% power at the 5% level needed to conclude that a result is significant (Cohen 1992) for the main analyzed variable—i.e. saccadic peak velocity/magnitude relationship,—a minimum sample size of n = 5 was required.
Exclusion criteria included (1) low levels of arousal before the flight, (2) less than 6 h of sleep the prior night, and (3) evening-type chronotype. Before the experiment, each pilot filled in the Stanford Sleepiness Scale (Hoddes et al 1973) (SSS), for screening purposes. None of the pilots scored above 3 (had they done so, they would have been excluded from further testing (Di Stasi et al 2015a)). The SSS provides a global measure of alertness, ranging between 1 and 7. It contains seven statements ranging from 'Feeling active, vital, alert, or wide awake' (score 1) to 'No longer fighting sleep, sleep onset soon, having dream-like thoughts' (score 7). To control for the possible influence of chronotype on performance (synchrony effect) (Del Rio-Bermudez et al 2014), pilots also completed the reduced version of the morningness–eveningness questionnaire (MEQ) (Adan and Almirall 1991). All pilots were classified as 'neither type', according to their reported preferences in sleep–wake and activity levels (as indicated by their MEQ scores).
2.3. Study protocol and procedure
Approximately 30 min before the experiment, demographic data, including the age, sex, hand dominance, flight hours, as well as responses to sleep questions (previous sleep, chronotype, and levels of sleepiness) were recorded. Then, all pilots received a standard briefing on flight before the take-off and underwent an eye movement measuring session (Pre-Flight measuring session). Before the eye movements recording (see section 2.4), the pilots filled in an adapted version of the Borg rating of perceived exertion scale (BORG) (Borg 1998). The BORG indicates the level of perceived fatigue associated with a task. It consists of a numerical scale (ranging from 6 to 20) anchored by 'No fatigue at all' (score 6) to 'Maximal fatigue' (score 20) (Di Stasi et al 2013a, 2015a). Right after the Pre-Flight measuring session, the pilots started the IFR flight training. Pilots were required to fly the Sikorsky S-76C helicopter and complete a full IFR training flight lasting ~150 min. At the end of the flight, we recorded their eye movements and pilots filled in the BORG again (Post-Flight measuring session). The interval between the return to base and the start of the Post-Flight measuring session was ~10 min. Approximately, 3 h elapsed between the two measuring sessions. Each session lasted ~15 min.
2.4. Eye movement recordings and analyses
In a darkened and quiet room, we sampled pilots' eye movements binocularly at 500 Hz using the desktop configuration of the Eyelink 1000 eye tracking system (SR Research, Ontario, Canada). Pilots sat on a comfortable chair, while resting their forehead and chin on a head/chin support, ~70 cm away from a 21 inch CRT screen (864 × 1152 pixels, refresh rate 100 Hz) in which we displayed visual stimuli. We assessed eye movement metrics via a standardized guided-saccade task (modified from Di Stasi et al (2014b)). Pilots had to follow a jumping fixation stimulus (circle target) displayed on the screen (figures 1(B) and (C)). The stimulus jumps started from four randomly selected locations and had eight randomly selected sizes (between 2.5° and 20°) and three randomly selected directions (vertical, horizontal or diagonal).

Figure 1. Experimental setting. (A) Pilots carried out an instrument-flight-rules (IFR) training flight (~150 min), flying the Sikorsky S-76C helicopter. Pilots took off from the 78th air wing base (Armilla, Spain) to Seville, Spain (or Almeria, Spain) and, then, returned to base. Despite all flights were performed under IFR, the environmental conditions required to flight were: cloud ceiling at least 6000 ft above ground level, 4 miles visibility, and wind of less than 10 knots. (B) The experiment began (Pre-Flight measuring session) and finished (Post-Flight measuring session) filling in the BORG scale and doing the guided-saccade task (~15 min). (C) Sketch of the experimental setup with a pilot aligned with the center of the monitor located at ~70 cm from his eyes. The eye tracker is positioned below the monitor and in front of the pilot.
Download figure:
Standard image High-resolution imageTo analyze the SV, we first identified saccades using custom code (see Di Stasi et al (2013a) for more details). To investigate the potential effects of TOF on SV66, we fitted the saccadic peak velocity/magnitude relationship (known as the main sequence, for more information see Bahill et al (1975) and Di Stasi et al (2016)), using a nonlinear least squares method (MATLAB (Mathworks Inc., USA)), to a quotient of first-order polynomials of the form:

We estimated the area under the curve of the main sequence by analytically integrating the previous expression, using the fitted coefficients p1, p2, and q1 for each subject, for magnitudes in the range from 0 to 20° of visual angle (note we will use the terms 'area under the curve (AUC) of the saccadic peak velocity/magnitude relationship' and 'SV' interchangeably).
2.5. Experimental design and statistical analyses
The study followed a Pre/Post-Test design. The IFR training flight (i.e. the measuring session, Pre-Flight versus Post-Flight) was the within-subjects factor. The dependent variables were the eye movement metrics, as comprehensively described by the saccadic peak velocity/magnitude relationship (i.e. the main sequence). We also recorded the pilots' subjective rating of fatigue via a standardized questionnaire. We analyzed SV and subjective ratings calculating separate Wilcoxon Matched Pairs Test for each dependent variable. Thus, all collected data were analyzed by contrasting the data from each pilot, from before the IFR training flight (Pre-Flight), against the data from the same pilot acquired after the IFR training flight (Post-Flight). Significance levels were set at α < 0.05.
3. Results
We investigated the variation of SV on military pilots after real helicopter IFR training flight. The SV (i.e. the area under the curves of the saccadic peak velocity/magnitude relationship) decreased among all pilots from the Pre-Flight to the Post-Flight measuring session by an average around 3% (range: 1–4%). This decrease was statistically significant: Z (2.02), p = 0.043 (figure 2 and table 2). (Note we found similar results (see supplementary material (stacks.iop.org/PM/37/N62/mmedia)) using a different fit (figure S2) to our data (i.e. power law fit) or different data analysis (e.g. saccadic-bin analysis instead of the AUC analysis, figure S1).) Furthermore, the degree of perceived fatigue (see table 2) increased from the Pre-Flight to the Post-Flight measuring session, but not significantly, Z(1.28), p > 0.05 (figure 2 and table 2).
Table 2. The effects of time-on-flight on the saccadic velocity and BORG scale of fatigue.
| Oculomotor parameters | Pre-Flight | Post-Flight |
|---|---|---|
| M (SD) | M (SD) | |
| AUC value | ||
| Peak velocity/magnitude |
7986.57 (927.83) | 7780.94 (869.31) |
| Descriptive values | ||
| Magnitude (°) | 5.18 (0.85) | 4.80 (0.72) |
| Peak velocity (°/s) | 244.31 (41.27) | 225.43 (41.14) |
| Mean velocity (°/s) | 115.03 (14.65) | 108.02 (16.15) |
| Duration (ms) | 38.68 (3.49) | 36.96 (1.99) |
| Subjective assessment | Pre-Flight | Post-Flight |
|---|---|---|
| M (SD), range | M (SD), range | |
| BORG score range: 6–20 | 7.6 (0.9), 7–9 | 9.2 (2.0), 7–11 |
ap-values < 0.05. Note: AUC = area under the curve; BORG = Borg rating of perceived exertion scale; M = mean; ms = milliseconds; s = seconds; SD = standard deviation. Higher scores in the BORG indicate higher perceived mental fatigue. Average and standard deviation of the peak velocity/magnitude main sequence relationship, saccadic magnitude, peak velocity, mean velocity, and saccadic duration, as well as self-report calculated from all pilots (n = 5) before and after a real IFR training flight of ~150 min.

Figure 2. The effect of time-on-flight on the saccadic peak velocity/magnitude relationships. Five saccadic peak velocity/magnitude relationships (one panel for pilot). Pre-Flight measurement is represented in blue and Post-Flight measurement in red. Each dot represents one saccade. The curves (on log–log coordinates) are given by the quotient of first order polynomials that fits to the data from each measuring session. Inset: Individual scores for the Borg's perceived exertion scale (BORG). The bottom right graph indicates the average area under the curves (AUC) of the saccadic peak velocity/magnitude relationship across all pilots (n = 5) for the two measuring sessions. Error bars represent the SEM across subjects. Such differences across pilots have no effect on the statistics performed, but they magnify the error bars (for the interpretation of the SEM in repeated-measures designs, see Miller et al (2007) and Franz and Loftus (2012)). The superimposed dashed lines represent the trend for each pilot (#1–#5) across the two measuring sessions. AUC decreased from the Pre-Flight to the Post-Flight session for all pilots.
Download figure:
Standard image High-resolution image4. Discussion
Inadequate sleep and extended hours of duty are common among military personnel and might lead to operational errors. Thus, the ability to continuously and unobtrusively assess fatigue and, therefore, prevent accidents in military operations is one of the biggest challenges for modern armies (Miller et al 2007, Hasselquist et al 2010). Because SV is not under voluntary control, a fatigue index based on this metrics has the potential to provide an accurate and unbiased measure of warfighters' fatigue levels (Di Stasi et al 2013b). Based on two decades of research on SV and fatigue detection in the military (see an overview in table 1), our aim was to validate the utility of a saccadic-based index of pilot fatigue in real flight conditions using commercial high-level technology. We found that TOF (~150 min of real helicopter IFR training flight) decreased the SV by around 3%. This rate of change is roughly comparable to that obtained by Russo and colleagues (Russo et al 2003) when they assessed professional truck drivers after a 7 d period of partial sleep deprivation: a 5 h in-bed schedule led to a ~1% change in SV. Furthermore, after 7 d sleeping no more than 3 h, Russo et al found that the SV correlated to the number of simulated-driving accidents. In the aviation field, pioneer studies found that a deterioration of skilled performance might start after more than 2 h of simulated flying (Bartlett 1943). Future research should test if decrements in pilots' SV correlate with objective measures of task performance in real flights in order to determine the risk of an accident depending on the number of hours worked. Moreover, it would be interesting to include both military participants and civilians to compare the effects of the military training on fatigue levels. In our study, SV slowed even when pilots reported no statistically significant differences in subjective fatigue after the flight. This apparent dissociation between subjective and objective measures of fatigue might be related to the low sensitivity that self-reports present to detect fatigue levels, as well as social and motivational factors that can bias responses (Di Stasi et al 2011, 2013c).
To date, almost all previous studies have related SV decrements to inadequate sleep over long periods of time (laboratory-induced sleep restriction or different working schedules) or simulated missions (see table 1), with some inconsistent results (Miller et al 1998, Portman-Tiller 1998, Miller et al 2003, McIntire et al 2013). Most of these studies (63%) have used a commercial fatigue detector, the PMI Fitness-for-Duty/Impairment Screener (FIT, Pulse Medical Instruments Inc., Rockville, MD, US), an eye tracking system that provides not fully validated measures of fatigue (Watson et al 2006) (for more details on this system see Di Stasi et al (2016)). Furthermore, the only study that has assessed SV variations after real flights (LeDuc et al 2005)—reporting a decrement of SV in the post-flight tests—neglected two important confounding factors in its analysis: the flight expertise and data set size. Briefly, the analyses performed did not account for the pilots' flight hours (i.e. expert flight instructors and student pilots were not differentiated) and for the number of tests performed per each participant (i.e. data collected from each pilot was quite variable, ranging from 10 to 44 pre-tests/post-tests from different flights, with the expert flight instructors contributing the most data). As age modulates saccadic metrics (Bahill et al 1981, Abel et al 1983), pilot's expertise (in part related with age) (Kennedy et al 2010) as well as the amount of individual data collected (Guerrero-Mosquera et al 2010) could have biased the obtained results (Bahill et al 1981, Abel et al 1983). Here, we overcome these limitations and present conclusive evidence about the utility of SV as a warfighter-fatigue biomonitoring index. Note that SV revealed an increase of fatigue levels after a morning flight among not sleep-deprived, young, and physically fit military pilots. In these circumstances, one would not expect the effect of TOF to be large, and, in fact, one may not expect to find an effect at all. The value of extrapolating our results to real-operations contexts is what makes this confirmatory study highly remarkable, and makes a SV-based fatigue detector more necessary. Finally, the range of differences found here is similar to those found in previous published studies, where the effects of fatigue among surgeons (Di Stasi et al 2014a), the effects of time-on-task in simulated air traffic control interactions (Di Stasi et al 2013a), simulated time-on-driving (Di Stasi et al 2015b) and time-on-flight (Di Stasi et al 2016) were studied.
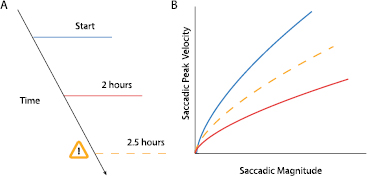
A recent review on SV applications (Di Stasi et al 2013b) provided a plausible theoretical framework to describe changes in SV due to time-on-duty using an arousal-based hypothesis (figure 3). The decrement of the arousal levels as the result of increased levels of time-on-duty (i.e. fatigue) (LeDuc et al 2005, Di Stasi et al 2014b, 2016) would decrease SV. In the same way, it is plausible to expect a rise in SV when arousal levels increase due to task features and/or increased effort (McIntire et al 2013, Di Stasi et al 2013a), something that happens when, for example, stressful/emergency events occur or self-select countermeasures (e.g. caffeinated drinks to enhance alertness) are taken (Smith et al 2003).
Figure 3. Schematic diagram of the effects of arousal variations on saccadic peak velocity. (A) Schematic time line. (B) Schematic saccadic peak velocity/magnitude relationships. (A) and (B) The different colors indicate consecutive temporal events: blue (start of the task), red (middle of the task); orange (stressful event at the end of the task that required to increase mental effort). Reduced levels of arousal (due to time on task) lead to slower saccades. Contrarily, increased levels of arousal (e.g. due to a stressful event) might lead to faster saccades.
Download figure:
Standard image High-resolution image
5. Conclusions
The current standard practice to determine fitness to fly consists on a purely subjective yes/no decision, taken by the pilot's commander prior to the flight (Caldwell et al 1997, Di Stasi et al 2016). Thus, an objective fatigue index, based on SV, would represent a first step towards assessing and managing fatigue-induced errors in an effective and objective manner. Because SV is sensitive to arousal variations, this metrics could be useful also to detect general arousal-driven impairments, for both sleep loss and drugs consumption (Di Stasi et al 2013b). Furthermore, as current pilot' helmets have started to incorporate eye tracker systems as standard instrumentation (e.g. F-35's helmet mounted display system, see Carroll et al (2013)), gaze-based research might help to develop reliable methodologies to monitor pilot's fitness-for-duty in real time during flights and consequently to increase operational safety (Di Stasi et al 2013d). The final aim would be developing assignment-specific SV profiles to help predict an individual's success at a particular mission. Therefore, the use of the SV as a biomarker for in-flight fitness-for-duty standards could have the advantage of providing scientific-based recommendations for each individualized fatigue assessment.
Acknowledgments
This study was funded by the CEMIX UGR-MADOC (Project PINS 201416 to CDP & LLDS). The sponsor or funding organization had no role in the design or conduct of this research.
CDP is supported by a UGR Postdoctoral Fellowship (2013 University of Granada Research Plan). Research by AC is funded by the Spanish Ministry of Economy and Competitiveness, Madrid, Spain (Grant PSI2012-39292). LLDS is supported by the Talentia Postdoc Program launched by the Andalusian Knowledge Agency, co-funded by the European Commission's 7th Framework Programme for Research and Technological Development—Marie Skłodowska-Curie actions and the Andalusian Department of Economy, Innovation, Science and Employment (COFUND—Grant Agreement no. 267226). Research by LLDS is funded by the BBVA Foundation, Madrid, Spain (Grant no. CJS‑PSI‑2267). The authors have no conflicts of interest to declare.
We thank Colonel Lorenzo Rebollo and Colonel Fernando Garcia Sanchez from the Spanish Army TRADOC, as well as, Colonel Rafael Alcantud from the Spanish Air Force for their assistance and help during the data collection. We thank Jose M Morales, MSc (Mind, Brain, and Behavior Research Center, University of Granada) for his help in data processing.