
Abstract
Non-contact photoplethysmography (PPG) provides multiple benefits over in-contact methods, but is not as tolerant to motion due to the lack of mechanical coupling between the subject and sensor. One limitation of non-contact photoplethysmography is discussed here, specifically looking at the topology and optical variations of the skin and how this impacts upon the ability to extract a photoplethysmogram when a subject moves horizontally across the field of view of the detector (a panning motion). When this occurs it is shown that whilst the general relationships between the speed of traversal, detection area and resultant signal quality can be found, the quality of signal in each individual case is determined by the properties of the area of skin chosen.
Export citation and abstract BibTeX RIS

Original content from this work may be used under the terms of the Creative Commons Attribution 3.0 licence. Any further distribution of this work must maintain attribution to the author(s) and the title of the work, journal citation and DOI.
1. Introduction
Photoplethysmography (PPG) is a well-known technique for extracting cardiac-synchronous pulsatile signals from subjects from which, for example, the heart-rate can be derived (Hayes and Smith 2001, Allen 2007, Grubb et al 2014). Two primary advantages of in-contact PPG are the instrumentation's low cost, and the relative resilience to motion artefacts due to the physical contact between the subject and the source/sensor that suppresses relative motion.
Non-contact (remote) photoplethysmography has recently become more popular (Humphreys 2007, Verkruysse et al 2008, Poh et al 2010, Kamshilin et al 2011) due to its comfort and convenience and minimisation of infection risk in medical applications.
Although it is possible to design a non-contact PPG sensor with a single element (Cennini et al 2010), cameras can achieve the same functionality. An advantage of a camera (i.e. a multi-pixel array) is that analyses of multiple locations can be taken simultaneously; to either detect a PPG from multiple subjects (Poh et al 2010), or analyse the distribution of the PPG signal over an area on a single subject (Humphreys 2007, Verkruysse et al 2008, Kamshilin et al 2011). One example of where imaging is used to detect PPGs at different locations is when analysing the quality of the blood supply (Kamshilin et al 2011) that would be time-consuming if a single sensor were to be continuously repositioned, and is a necessity when contact with the skin is not possible (such as with burn patients).
In all forms of photoplethysmography, but particularly when remote with no mechanical coupling, motion artefacts can corrupt the signal such that the pulsatile waveform is irrecoverable (although detecting the average heart-rate from a long section of a recording may still be possible (Poh et al 2010)). A, perhaps larger, concern is that an artefact may be falsely detected as a valid PPG 'pulse'. Hence, a greater understanding of the underlying causes of motion artefacts are required to better inform design decisions to reduce their effects. This paper discusses the effects of one such motion, namely panning (whereby the camera and subject move horizontally with respect to each other but their separation remains constant), and the limitations that it creates in detecting the PPG in a single element, either alone or as part of an array.
Whilst the PPG is known to be wavelength dependent, it is the intention of this paper to primarily explore the effects of motion, components of which will exist for all wavelengths, to a varying extent.
2. Methods
A camera was used in this study to emulate a single 'element' sensor whose size and position can be dynamically adjusted after the measurements have taken place. This allowed for multiple configurations to be tested on each dataset in order to make fair and quantifiable comparisons.
The camera used was a PCO PixelFly VGA, monochromatic 12-bit CCD scientific camera (PCO 2009), operated with a resolution of  pixels and at 50 frames per second (fps). The camera was positioned perpendicular to the surface of the subject-under-test, such that 100 mm × 75 mm of skin was visible within the frame (7500 mm2). Figure 1 illustrates the hardware set-up. Subjects were illuminated using the lighting within the room, essentially daylight supplemented by fluorescent lighting. The frame-rate was locked at 50 fps so that the mains lighting would appear at a constant intensity for the duration of the recording (the 50 Hz electrical supply results in 100 Hz optical pulsations). All video captures were saved as raw (loss-less) multi-image tiff files preserving the 12-bit pixel-depth.
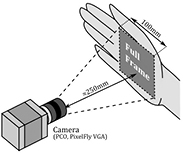
Figure 1. Experimental set-up showing the relative location of the camera to the subject.
Download figure:
Standard image High-resolution image2.1. Data collection
Six participants were recruited for the experiment (four male, two female, of mixed ethnicity, all older than 18 years), and the recordings (photographs and video) were repeated three times. Six regions of the skin were investigated. All participants, after being informed about what data was to be collected from them and the reasons for the study itself, consented to having anonymised data collected, analysed and published. The study was approved by the University of Nottingham's Research Ethics Committee (reference number: 2014–140).
2.2. Processing techniques
To extract a PPG from the data, a rectangular region of interest (ROI) was selected. The ROI size and position could be modified as a function of time in order to simulate panning. A single value was extracted from each frame of the video by averaging the monochromatic pixel values within the chosen window; these values were then processed and plotted as a time-varying signal. An example of a PPG from one subject with no simulated panning motion is shown in figure 2.
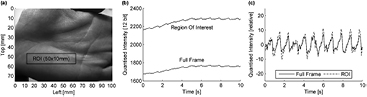
Figure 2. Two example PPGs obtained from the palm (b); one from the full frame, the other from the indicated ROI in (a). A 0.8 Hz to 8.0 Hz band-pass filter was used to improve clarity for illustrative purposes (c). (a) Sample frame from video. (b) Raw pixel data (12-bit). (c) Filtered PPG (0.8 Hz–8.0 Hz BPF).
Download figure:
Standard image High-resolution imageIn order to characterize the effect of a panning motion accurately, 10 s recordings, of 500 frames, were taken with the participants' hand held stationary (as far as was possible). Artificial motion was then digitally introduced by moving the ROI linearly across a single frame of the video (the first frame) at a chosen speed; a single frame was chosen, instead of all frames in the video, to prevent the inclusion of the PPG. A simple linear motion was chosen as this would allow for direct comparison between the spatial frequencies of the skin surface and the temporal frequencies of typical heart-rates.
Under these controlled conditions, two main components existed in the signal: the PPG, whose frequency and phase was assumed to be constant throughout the frame, and the changes in intensity within the image as a result of the panning motion meaning that different regions of skin filled the ROI. This assumption, regarding the phase of the PPG, was based on the lack of an observed phase shift over the recorded video frames, and that at 50 frames per second with a 100 mm frame width, a phase shift would only be visible if the pulse-wave-velocity (PWV) was slower than 5 ms−1 whereas typically, PWVs exceed this (Koivistoinen et al 2007). Due to the non-homogeneous nature of the skin, the variation due to the motion was not likely to be negligible.
3. Results
For an ROI of a single pixel scanned spatially (for a single image), or temporally (over all video frames), the output represents the monochromatic intensity variation of the skin at its highest spatial resolution. This is illustrated in figure 3 (solid line). It can be clearly seen that any artefact's amplitude for any significant motion would be greater than the obtained PPG amplitude (figure 2(c)).
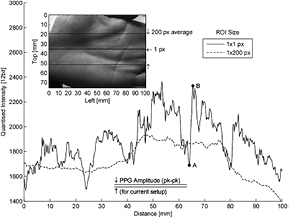
Figure 3. The variation in reflection of the palm, due to color and topology. The 200 pixels used in the average (dashed line) were taken from above and below the original pixel.
Download figure:
Standard image High-resolution image3.1. Subject composition and topology
The slow changes (low spatial frequencies) visible in figure 3 are due to the macro structure of the hand that is its general curvature and physical make-up. The higher spatial frequencies are due to the micro structures of the skin; the skin's cellular structure, its variation in pigmentation, and vascular networks beneath the surface will all contribute. This illustrates the difference in amplitude between a PPG (as obtained earlier, see figure 2(c)) and the variation in reflected intensity from the skin due to position. It is clear that the amplitude of the spatial variations would dominate if any motion occurred.
3.2. Additional components
When remotely detecting PPGs from participants, motion can manifest itself in two different but related ways. Firstly, 'random' movement that occurs naturally during activity will cause the established 'motion artefact' by adding an uncorrelated signal to that which is detected. However, a second component may exist that is correlated to the PPG: the optical ballistocardiogram (Ratan 2004). This signal is created when the pulsations of the heart cause a mechanical effect on the body due to the redistribution of blood, effectively displacing regions being tested by small (but potentially detectable) amounts; the mechanical effect is known as the ballistocardiogram (BCG) and is itself a method of extracting vital signs (Alametsä et al 2008). When optically measuring the skin, this displacement can manifest itself as a pulsatile signal similar to the PPG. It is evident in figure 3, for example, that a BCG could be produced with very little movement by observing a single pixel (the two points A and B are spaced apart in distance by less than 2 mm, yet have a difference in intensity that is an order of magnitude greater than the PPG). This BCG could, depending on the movement, either add or subtract to the actual photoplethysmographic signal. The large positive change in intensity from point A to point B can be negated by looking at (and averaging) multiple neighbouring pixels which have the opposite gradient. Whilst ballistocardiographic effects are not considered further in this document, an important message is that a clean PPG signal may have its origins in ballistocardiographic motion.
3.3. Effect of ROI velocity and area
The spatial frequency of the skin surface is not relevant when there is no motion present as the ROI will encompass the same pixels. However, as the motion (speed) is increased, the spatial variations (spatial frequency) are perceived as a temporal frequency scaled by the speed. For example, with a traversal velocity of 1 mm s−1, the graph in figure 4 could be interpreted as a temporal FFT; i.e. the horizontal 'cycles per mm' would become 'cycles per second' (Hz). If the traversal velocity were to double, the frequency components would scale by the same amount (a component originally at x Hz would stretch to 2x Hz, etc), moving the more dominant low-frequency components into a typical heart-rate range (figure 5).
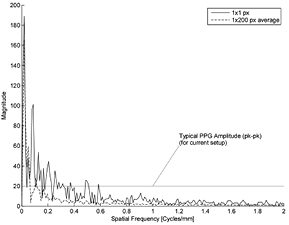
Figure 4. (DC removed) Spatial frequency components of the palm showing that lower frequencies (due to the macro structure, as stated earlier) dominate. Most higher spatial frequencies have magnitudes below the amplitude of the measured PPG.
Download figure:
Standard image High-resolution image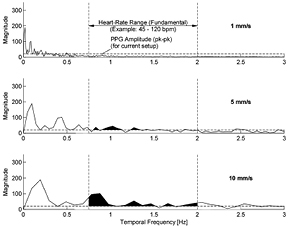
Figure 5. A demonstration of the effect of ROI traversal velocity on spatial frequency components. The shaded region represents the proportion of motion 'artefacts' that exceed the PPG amplitude and are within the given heart-rate range. Note that compared to figure 4, this graph's x-axis represents a temporal frequency: cycles per second (Hz).
Download figure:
Standard image High-resolution imageFrom this analysis, it is clear that the lower spatial frequency components (being more dominant) have a more significant effect on the PPG than the higher spatial frequency components. Increasing the ROI area and averaging the contained pixel values creates a simple low-pass spatial filter that removes the higher spatial frequency components (see figure 4). When motion is present, this filter appears as an equivalent temporal filter.
To reduce the effect of motion artefacts, therefore, either the area of the region under test must be increased, or the motion speed decreased. Although the latter is not often controllable, a relationship between the required area of the ROI for a desired PPG-to-artefact (signal-to-noise) ratio, and the motion velocity (for a panning motion) can be established. However, as each camera model (and type) will have different optical and electrical (noise) characteristics, using an absolute method of characterising the effect of motion on a signal quality would not provide a reproducible result. Because of this, a relative method of signal characterisation was used.
To compare the 'current' sample (of a specific area and speed) and the reference sample (the theoretical best area and speed), a standard correlation technique (Pearson) was deployed. In this case, the 'best case' scenario for obtaining a PPG (no motion, maximum possible area) was correlated with the baseline signal, but with a variation in one or both of the ROI area and traversal velocity. A direct comparison was then determined between the effects of the area and the ROI traversal velocity on the quality of the PPG as described by the correlation coefficient.
Three features of the plot in figure 6 are of particular interest. Firstly, the correlation in the 'area dimension' shows that a reduced ROI area results in a lower signal quality, as expected. It must be noted in this example, however, that the correlation values that exists when there is no motion present (speed = 0 mm s−1) still reduce for smaller areas. This is most likely due to the fact that a small amount of motion was present in the recordings.
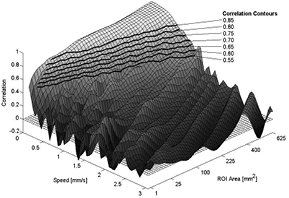
Figure 6. Correlation map of ROI speed versus area for the palm. ROI area axis increases quadratically.
Download figure:
Standard image High-resolution imageSecondly, not surprisingly, increasing the motion velocity for any given ROI area decreases the signal correlation. Although the relationship between the speed and the correlation is more complex than the previous relationship, the general trend follows a quadratic law (figure 7). The 'ripples' that are visible in figure 6 are due to the spatial frequency components in the sample not being uniformly distributed. In other words, some temporal frequency components that exist at a certain motion velocity have a detrimental effect on the PPG quality; hence local troughs. Conversely, some have similar properties to a PPG signal, effectively and erroneously 'enhancing' the calculated quality (the local peaks). A change in ROI area affects the quality predictably, however, due to the random nature of the skin's texture and structure, the relationship is less well defined for changes in velocity.
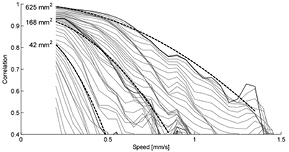
Figure 7. Illustration of the relationship between the ROI traversal velocity and the resulting deterioration of the PPG as a function of ROI area. Equations for the highlighted lines (v is traversal velocity): (top) 1.00–0.27 v2; (middle) 0.95–0.75 v2; (bottom) 0.90–2.10 v2.
Download figure:
Standard image High-resolution imageFinally, for a given correlation coefficient value, a relationship between the ROI area and velocity can be constructed. Initially, it would be reasonable to think that to compensate for an increase in ROI velocity; its area could be increased by a proportionate amount. However, there are clear limits; increasing the area of detection (for any region on a body) cannot indefinitely improve the PPG quality, since eventually, the larger structures of the body such as skin creases and the edge of the body will dominate and the quality will no longer increase. If, for example, due to an increase in area, the ROI were to extend near to or beyond the 'edge' of the subject's skin (where the optical normal will diverge from the camera's until the skin is no longer completely within the ROI), the quality will decrease.
3.4. ROI area-velocity relationship
For a given ROI area (A), the quality Q is negatively proportional to the square of the traversal velocity (V):  . This is clearly visible in figure 7. Although less clear in the figures, for a given traversal velocity, the quality is inversely (and negatively) proportional to the ROI area:
  (this is obtained from the coefficients of the curves in figure 7).
Thus an equation (1) can be constructed to link the area, velocity and resulting quality. Despite being linked to the correlation coefficient mentioned earlier, a negative quality value (Q) has no meaning and represents zero 'quality'.

where k is a constant dependant of the system.
With the assumption that the ability to extract a PPG from a signal containing artefacts is limited by the PPG-to-artefact ratio, the above equation can be used to calculate a relative area required to reduce a motion artefact by a fixed amount.
For example, in figure 7, if a 'quality' (correlation) of 0.8 is deemed satisfactory with an ROI velocity of 0.25 mm s−1 and area 42 mm2, then to counter a decrease in PPG-to-artefact ratio when the velocity increases by a factor of 2 to 0.5 mm s−1, the area would have to be increased to 168 mm2 (=42 mm ). If the velocity were to increase again by the same factor (to 1.0 mm s−1), then the area would need to be increased to 676 mm2 (=168 mm
 ); although this is not possible to achieve with the current set-up.
3.5. ROI location
All previous results have concentrated on a single region: the palm. Within the experiment, six regions were investigated. The following section analyses the difference in artefact susceptibility between the six regions.
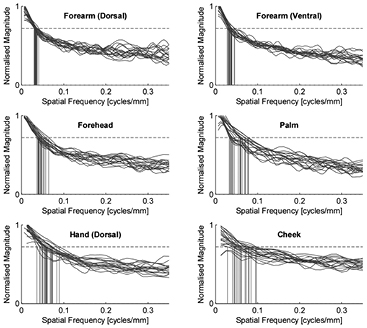
In figure 8, points where the spatial frequency responses intersect the mean PPG amplitude were determined and their frequencies are summarised in table 1. The frequencies of occurrence are a good indication of how 'good' the area is in relation to the artefacts that are produced. For example, regions with a low mean intersection frequency allow for faster ROI traversal velocities before the dominant low spatial frequency components overlap the typical heart-rate region (see figure 5). A low standard deviation of spatial frequencies represents a more reliable region to extract a PPG from when multiple participants are studied; i.e. the variation between participants is minimal.
Figure 8. Comparison of low spatial-frequency components from six different locations on the body (six participants, three repetitions). Horizontal limit lines (dashed) show a common, arbitrary, magnitude reference. The 18 vertical lines in each plot indicate the spatial frequencies where the amplitude first falls below this limit line. Lines are smoothed to improve clarity.
Download figure:
Standard image High-resolution image
Table 1. Mean and standard deviations of frequency 'intersection' points from each region.
| Spatial frequency (cycles m−1) | Cheek | Hand (Dorsal) | Palm | Forehead | Forearm (Ventral) | Forearm (Dorsal) |
|---|---|---|---|---|---|---|
| Mean | 63.67 | 60.92 | 52.81 | 45.44 | 35.85 | 34.46 |
| STD | 19.95 | 13.92 | 15.34 | 7.54 | 4.84 | 2.88 |
The position of each of the six regions in table 1 can be easily explained by the topology of the skin. The region with the largest mean and standard deviation (the cheek) also has the largest curvature due to its relatively small area. Both the ventral and dorsal forearms score 'best' with low means and standard deviations. The arm has relatively little curvature (along its length) resulting in much lower spatial frequencies.
The ability to extract a PPG signal from the skin is also dependent on several factors relating to the blood flow beneath the surface of the skin. These include capillary density and blood perfusion which can vary between different regions. Regions such as the forehead, cheeks and palms provide larger PPG signal amplitudes compared to other areas enabling a higher PPG-to-artefact ratio (Hertzman 1938). Unfortunately, according to this research, neither of the forearm sites (ventral and dorsal) provide particularly strong PPGs. The forehead and palm however, do provide stronger signals, and so despite being regions that allow for larger artefacts to be generated, are often chosen for experiments.
4. Discussion
This analysis has only looked at one of many 'types' of motion; panning. Other types of motion such as rotation (about an axis perpendicular to the camera's viewing direction) have an entirely different effect on the PPG and artefacts. Research by Cennini et al (2010), for example, looked at using multiple wavelengths to eliminate artefacts caused by such a rotation. Their results showed that repetitive rotational movements with frequencies that do not overlap the PPG's can be suppressed using two wavelengths, where both channels contain artefact components, but one has a reduced PPG component due to the relative absorption of tissue and blood (the artefact presented had a peak frequency of 2.2 Hz, whilst the PPG's was at 1.2 Hz). It is believed that if the area of detection were to move as described in this paper instead of remaining still, then the magnitude of the artefacts in the same frequency range as the PPG would be considerably higher due to non-uniform optical variations of the skin. For non-contact single-sensor designs, this is potentially the largest artefact-related problem that must be overcome. If motion tracking techniques were to be used to compensate for large panning motions, a similar 'rotation' would occur as the skin's surface normal (the direction perpendicular to the skin surface) will deviate from the camera's direction; to which a multi-wavelength method could then be applied.
Digitally compensating for movement, however, requires a redundancy in the captured images such that the subject (and more specifically, the ROI) can move around the frame without going 'out-of-shot'. As a result, using the same resolution when movement is known to exist requires a smaller ROI. This in turn increases the susceptibility to motion artefacts as has been shown. Unless the tracking algorithms are 'pixel-perfect', jitter that occurs as images are moved between pixel boundaries can and will add additional artefacts to the signal as illustrated in figure 3.
5. Conclusion
The physical and optical properties of the surface of the skin are such that the quality of the PPG is related to the relative traversal velocity between the camera and the ROI on the subject; the lower spatial frequency components of the skin having a greater impact on the corruption of the PPG signals than the higher.
If small repetitive motions are present, such that ROIs track along intensity gradients, multiple detection sites would yield artefacts with differing polarities and amplitudes. Thus, for the same movement direction, sites aligned to opposing intensity gradients produce signals with opposing polarities; this enables the possibility of detecting whether a signal is, or contains, an artefact.
The size of the region of interest also has a noticeable effect on the detected signal. For small ROI areas, the reflected light intensity varies considerably due the magnitude of the optical variations of the skin. If larger regions were chosen, whereby the intensities within the ROI are averaged, areas with opposing gradients would 'cancel' and thus reduce the effect of the erroneous signal. The larger the region, the higher the PPG-to-artefact ratio. This argument can apply to either small 'random' motions (artefacts), or to ballistocardiographic effects; either way, the quality of the real PPG can be increased with a larger ROI. However, this improvement is bounded as subjects' skin areas are limited and chosen regions will vary between people in both size and topology.
It is hypothesised that if a subject were positioned further from the camera with no other parameters altered, the subject would have to move further to influence the content of the ROI, due to perspective effects. If there was no electrical or optical noise present, this would reduce the generated motion artefacts.
Acknowledgments
The research was funded by the Engineering and Physical Sciences Research Council (EPSRC, grant number EP/K503101/1), and supported via a Cooperative Awards in Science and Engineering (CASE) scheme with Tioga Ltd (Derby, UK).