
Abstract
The physiological changes following a deep inspiratory gasp (DIG) manoeuvre have been described in the literature. However, the lack of a reliable signal processing technique to visualize and quantify these physiological changes has so far limited the applicability of the test to the clinical setting. The main aim of this study was to assess the feasibility of using wavelet analysis to quantify the pulse arrival time (PAT) and its changes during the DIG manoeuvre. Vascular responses were extracted from cardiac (electrocardiogram, ECG) and peripheral pulse (photoplethysmography, PPG) waveforms. Wavelet analysis characterized their cardiovascular responses in healthy adult subjects in the time-frequency space, and for the ECG–PPG inter-relationship in terms of the PAT. PAT showed a characteristic biphasic response to gasp, with an increase of 59 ± 59 ms (p = 0.001) compared to the maximum value reached during quiet breathing, and a decrease of −38 ± 55 ms (p < 0.01) compared to the minimum value during quiet breathing. The response measures were repeatable. This pilot study has successfully shown the feasibility of using wavelet analysis to characterize the cardiovascular waveforms and quantify their changes with DIG.
Export citation and abstract BibTeX RIS
1. Introduction
The physiological changes following deep breathing have been extensively investigated in the literature, including the effects on heart rate and blood pressure (Jagomägi et al 2003, Laude et al 1993, Mori et al 2005, Radaelli et al 2004, Zheng et al 2012, Di Marco et al 2012). A rapid, deep inspiration is also known to induce transient vasoconstriction of skin arterioles (Mayrovitz and Groseclose 2002) mediated by the sympathetic nervous system. This could therefore be used for the assessment of neurovascular function in various conditions, including diabetes (Wilson et al 1992, Abbot et al 1993), Raynaud's phenomenon (Wollersheim et al 1991), erythromelalgia (Littleford et al 1999), and leprosy (Abbot et al 1993). However, the lack of reliable techniques to visualize and quantify the range of expected changes has limited the clinical advancement of such physiological testing.
Wavelet analysis (WA) enables the visualization of physiological data on a time-frequency plane and also the extraction of information about how frequency characteristics change over time. WA has several advantages in comparison with traditional time-frequency techniques based on Fourier analysis (e.g., short-term Fourier transform), including a tailored time and frequency resolution and a reduction in the spectral cross-terms (Ajab et al 2012). Wavelet-based correlation analysis enables the correlation between two signals to be determined for each individual frequency component (Nesme-Ribes 1995, Podtaev et al 2008). The time delay between two signals can also be calculated at each time instant from the phase shift of their wavelet transforms. WA has been widely used in physics for describing non-stationary processes, especially in cases where the time of the entire signal is comparable with the characteristic time of the process (Frick et al 1997, Noskov et al 2009). It has already been applied to a variety of biomedical signals, including the electrocardiogram (ECG) (Addison 2005), heart rate variability (Lotric et al 2000), laser Doppler flowmetry (Kvernmo et al 1998), and uterine electromyogram (Moslem et al 2010).
Photoplethysmography (PPG) is a simple, low-cost and non-invasive optical measurement technique that detects blood volume changes in the microvascular bed of tissue. PPG utilizes a light source at low levels of irradiance and generally within the near infrared wavelength range. The signal is usually acquired from peripheral body sites, with the most common ones being the ear lobes, finger tips, and great toes. The use of this technology was first reported by Hertzman (1938), and a detailed description of its potential use in clinical physiological measurement has recently been published by Allen (2007). WA has never previously been applied to investigate deep inspiratory gasp (DIG) responses measured using PPG technology.
Respiration is known to induce clear and reproducible changes in the PPG waveform (Johansson and Öberg 1999a, 1999b, Allen and Murray 2000, Khanokh et al 2004). In particular, DIG can vastly reduce the amplitude of PPG pulse waveforms and also introduce marked low-frequency components (Allen et al 2002), as a consequence of vasoconstriction and subsequent vasodilatation. These changes make difficult the accurate automatic identification and tracking of PPG waveform features, such as the pulse foot and the pulse first dominant peak. This increases the error when computing physiological measures such as the pulse arrival time (PAT) by using techniques which solely rely on PPG pulse features, e.g. the intersecting tangent method (Chiu et al 1991). The PAT is the time taken by the pulse wave to travel from the heart to a peripheral site. It is inversely related to pulse wave velocity (Gizdulich 1984, Bernjak and Stefanovska 2009), and has been extensively proposed as a non-invasive marker of arterial compliance (Boutouyrie et al 2009, Nitzan et al 2002). PAT has also shown potential for other possible clinical applications in respiratory sleep studies, cardiac function and autonomic function assessments, and hypertension (Foo and Lim 2006). It is usually calculated as the time delay between the ECG R-wave and a time point identified on the peripheral pulse. To overcome the limitations of the intersecting tangent method and other traditional methods in identifying this time point, PAT was derived in this study from the time delay between ECG and PPG as extracted from WA.
The main aim of this pilot study was to assess the feasibility of using WA to characterize ECG and PPG waveform changes in response to DIG, and to quantify these changes in terms of PAT in a group of healthy adult subjects.
2. Materials and methods
2.1. Subjects
Fifteen healthy male subjects (mean age ± SD of 34 ± 10 years) who were non-smokers, not on medication, and with no known history of cardiovascular disease, were recruited into the study. Each gave their written informed consent to participate (Allen et al 2002).
2.2. Measurement system
PPG waveforms were acquired from the tissue pad of the tip of the right ring finger using a reflection mode pulse pick-up probe (type 75333-5, Artema, Denmark) held firmly but comfortably in place by an Artema black Velcro cuff (Allen et al 2002). The cuff also reduced the interference from external light sources. A purpose-built PPG amplifier (bandwidth 0.05–30 Hz) boosted the pulse waveforms to a level which maximized the dynamic range of the recording system. Pulse waveforms were recorded to computer at a sampling rate of 1 kHz for subsequent off-line analysis. A diagnostic bandwidth single lead ECG was also simultaneously recorded to provide a cardiac timing reference.
2.3. Measurement procedure
Subjects were asked to refrain from exercise, substantial meals, and caffeine during the 2 h before their study commenced, in order to minimize any possible effect on peripheral blood circulation.
The body has to be kept warm in order to stabilize the peripheral temperature and to reduce the occurrence of spontaneous vasoconstrictor events. This was done by indirect body heating which is known to induce central vasodilatation triggered when warm blood returning from the periphery reaches the hypothalamus, thereby elevating the core temperature. This vasodilatation state was achieved by raising the ambient room temperature to 26 ± 0.5 °C and placing the contra-lateral (left) hand in a warm water bath at a stable temperature between 40 and 42 °C in order to elicit the indirect body heating (Allen et al 2002). Subjects were seated comfortably throughout the session with their right (measurement) hand relaxed and supported by a pillow placed at a height close to the heart level. The PPG probe was attached to the ring finger of this hand. Subjects then placed their contra-lateral hand in the water bath. They were acclimatized for a 10 min period before collecting waveforms.
The DIG consisted of a rapid deep inhalation which was held for 2 s, followed by exhalation and then a return to normal quiet breathing. The subjects were asked to relax and keep both hands still throughout the recording. Each subject measurement lasted 350 s in total, with three repeats of the DIG manoeuvre performed, respectively at 90, 180, and 270 s.
2.4. Wavelet analysis
The spectral properties of the signals and their changes over time were investigated using WA (Holschneider 1995). The continuous wavelet transform decomposes a function of one variable (in this case time) f(t) in the 2D time-frequency space:

where t is time, the * symbol represents the conjugation operator, τ is the time shift of the wavelet which can assume any real value, and ν is the oscillation frequency which can be any positive real number. The shape of the analysing wavelet ψ(t) has to be defined depending on the kind of signal under study and the purpose of the analysis.
The accurate choice of the analysing wavelet is the most important step in the process of WA as it ensures appropriate decomposition of the original signal into the various frequency components. In this study, the complex Morlet wavelet, in the form, ψ(t) = exp(2πit) exp(−t2/σ2) was utilized, where σ is the decay parameter. The use of a complex analysing wavelet enables the calculation of both modulus and phase of the wavelet decomposition. A value of σ = 1 was chosen in order to optimize the spectral and temporal resolution.
Wavelet decomposition with complex mother wavelet of 1D data returns a 2D array of complex values which can be represented by their modulus |W(ν, τ)| and their phase φ(ν, τ):


The combination of information from the modulus and the phase allows the frequency of the oscillation with the highest energy at each time τ (local dominant frequency, νd) to be detected with the highest possible accuracy (Holschneider 1995).
Wavelet decomposition provides additional information about the correlation of two signals (Nesme-Ribes et al 1995), as it allows studying the correlation C(ν) of their oscillations at selected frequencies using:

where Wf (ν, τ) and Wg(ν, τ) are the wavelet transforms of the signals f and g, respectively, * represents the operator of complex conjugation, T is the interval of integration which was defined as data length minus k/v, with k being the value needed to make the integral (4) of the mother function smaller than a certain error ε; in this case a value of 5 was used for k. This approach limited the error at the edges of the signal:

Equation (3) provides the mean correlation and the mean phase shift between oscillations with frequency ν for two signals f and g. In theory, the phase shift can be calculated for any frequency at any time by the following relationship:

However, phase shift has a clear physical meaning only for the local dominant frequency (Frick et al 1997). Its physiological meaning at the local dominant frequency (νd) in this particular application is also clearly defined as being related to the pulse arrival time (PAT).
PAT can be derived from the phase shift between the ECG and PPG signals at the dominant frequency (which corresponds to the heart rate) by means of:

The relative deviation of PAT was defined as:

where 〈PAT (τ)〉 is the mean value of PAT before the DIG manoeuvre which was calculated over the 60 s before each of the three consecutive gasps and therefore in the time intervals (A) 30–90 s (B) 120–180 s and (C) 210–270 s, respectively.
2.5. Software and statistical analysis
Signal processing algorithms were implemented with Mathematica 7 and statistical analysis was performed with Origin 8.0. Results were summarized using parametric statistics (mean ± SD values). The Wilcoxon statistical test for paired data was used to compare values during DIG to the baseline (or quiet breathing, QB) and also used to assess repeatability for heart rate and PAT changes with gasp. A p-value of 0.05 was taken as the threshold for statistical significance.
3. Results
The DIG manoeuvre caused a decrease in the PPG pulse amplitude along with a characteristic low-frequency trend (figure 1). Because of the excessively low amplitude, the intersecting tangent method would not be able to identify correctly the foot of all the pulses during the gasp and its response.
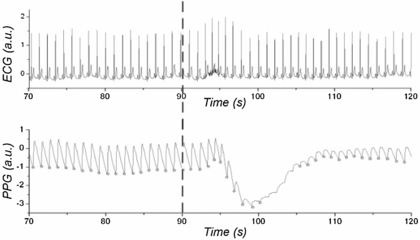
Figure 1. Example of ECG and PPG waveforms and their responses to DIG, with gasp starting at 90 s (as marked by a vertical dashed line). The lower panel also shows the PPG pulse feet circled only where they could be computed reliably using the intersecting tangent method; for the majority of the gasp response this algorithm was unable to compute the pulse feet reliably because of the low pulse-amplitude.
Download figure:
Standard image High-resolution imageThe heart rate was assessed by computing the dominant frequency of the wavelet transform. This was found to increase in response to DIG with a subsequent return to the baseline value, and it is represented by the lighter bands in the two upper panels of figure 2. The use of a complex mother wavelet made possible the reliable calculation of the heart rate at any time also from the PPG wavelet transform, besides this having very low amplitude following DIG. Heart rate derived from both the ECG and PPG wavelet transform analysis strongly correlated with the values obtained from the standard R–R interval (Pearson's correlation coefficient across the 15 subjects was 0.98 ± 0.10 in both cases) (figure 3).
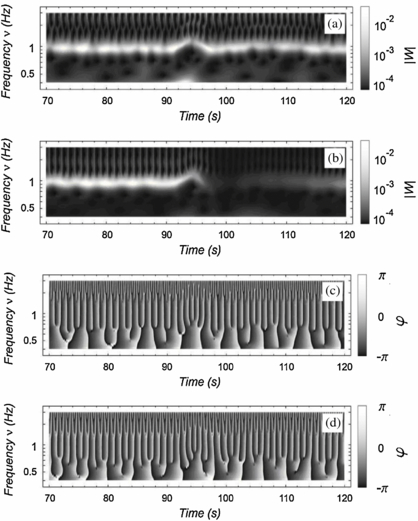
Figure 2. Wavelet decomposition of ECG and PPG signals. The wavelet derived modulus is shown in the two upper panels: (a) ECG, (b) PPG and the wavelet derived phase is shown in the two lower panels: (c) ECG, (d) PPG.
Download figure:
Standard image High-resolution image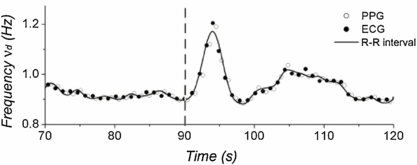
Figure 3. Example of variation of the dominant frequency νd from both the ECG and PPG wavelet transform analysis. It is important to notice that the heart rate extracted from the wavelet transform was highly correlated with that obtained from the R–R interval (solid line). The start of the first DIG manoeuvre is marked at 90 s.
Download figure:
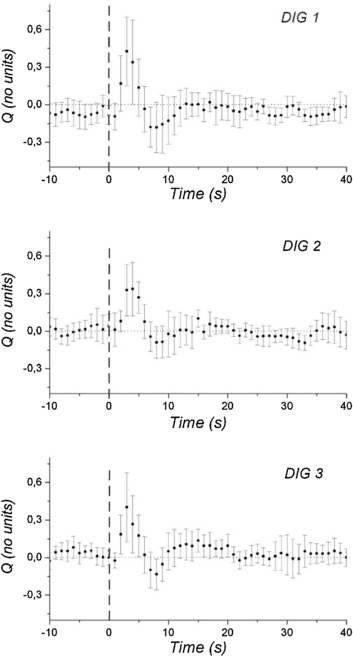
Standard image High-resolution imageThe response of PAT to the DIG manoeuvre was biphasic, first increasing and then decreasing below the baseline of the quiet breathing period, and finally returning to its baseline value. This biphasic trend was visually clear when plotting the relative deviation of PAT (figure 4). The typical time for PAT to return to its baseline value was estimated by visual inspection to be approximately 20 s for the 15 subjects. Results for the PAT changes are summarized in table 1. When comparing mean values during quiet breathing with the mean value over the 10 s around the maximum response to the manoeuvre, a significant (p < 0.05) increase in PAT of 8 ± 13 ms was determined for the average of three repeat DIG responses across all 15 subjects. This increase was clearly presented in 11 of the 15 subjects. When comparing the maximum value reached in each of the two DIG phases, the increase in PAT showed greater statistical significance (p = 0.001) with the response clearly presented in all subjects. The minimum value reached during DIG was significantly lower (p < 0.01) than for quiet breathing with an average decrease of −38 ± 55 ms, this response was clearly presented in 12 subjects. Finally, there were no significant differences for the three DIG repeats in terms of the PAT response measure.
Figure 4. Microvascular blood flow responses summarized for the three consecutive DIG manoeuvres (DIG1, 2, and 3) with each showing a characteristic biphasic response for relative deviation of PAT, firstly increasing and then decreasing. The positive peak is more consistently clearly defined than the subsequent negative peak. The overall mean (circle) and standard error of the mean (SEM) for Q are shown. The vertical dashed lines mark the start of each DIG manoeuvre, here indicated as time zero.
Download figure:
Standard image High-resolution image
Table 1. Summary of PPG-derived pulse arrival time changes with DIG quantified by wavelet analysis.
| PAT mean | PAT max | PAT min | ||||
|---|---|---|---|---|---|---|
| QB | DIG | QB | DIG | QB | DIG | |
| Mean ± SD (ms) | 359 ± 83 | 367 ± 81 | 401 ± 82 | 460 ± 106 | 324 ± 89 | 286 ± 98 |
| Δ = DIG–QB (ms) | 8 ± 13 | 59 ± 59 | −38 ± 55 | |||
| n(Δ > 0) | 11 | 15 | 3 | |||
| P-value (DIG versus QB) | <0.05 | 0.001 | <0.01 | |||
Three measures were analysed to quantify the changes in response to DIG: (1) 'PAT mean' considered the mean value during the 60 s before the DIG manoeuvre (QB) versus the mean value over the 10 s around the PAT maximal change (DIG); (2) 'PAT max' compared the maximum value of PAT during QB with the maximum value reached during DIG; (3) 'PAT min' compared the minimum value of PAT during QB with the minimum value reached at the end of the DIG phase. Mean ± SD are the values averaged over the 3 DIG manoeuvres and the 15 subjects. Δ represents the difference between DIG and QB in each of the three measures. n indicates how many subjects had a positive Δ. The p-values are for differences in each measure between the DIG and QB phases using the average of the three manoeuvres.
4. Discussion
The physiological mechanisms of cardiovascular oscillations and the haemodynamics associated with breathing are not fully understood (Eckberg 2003). The mechanisms responsible for the heart rate changes with breathing are related to the baroreflex control system which acts in order to stabilize the blood pressure. A breathing exercise such as the DIG manoeuvre can induce marked short-term changes in the skin blood circulation along with changes in the heart rate and central haemodynamic parameters. The main focus of this pilot study was to investigate the possibility of using WA to characterize the cardiac and peripheral responses to DIG and quantify such responses in terms of PAT in healthy subjects.
The DIG manoeuvre induced a marked increase in the heart rate and this is consistent with previous findings (Di Marco et al 2012). PPG waveforms also showed a clear constriction of the peripheral microcirculation. This vasoconstrictor reflex was first described by Bolton et al (1936) who demonstrated that skin vasoconstriction occurred in fingers with intact peripheral sympathetic innervation, whilst it was absent following denervation and dеsympathization. Allen et al (2002) reported a significant reduction of cutaneous blood flow during DIG, with median LDF flux reduction of 93% using laser Doppler flowmetry, along with a decrease in the PPG pulse amplitude and skin temperature. Capillaroscopy of the nail beds also showed rapid and transient decrease in blood flow velocity during DIG (Durand et al 2004, Mulinos and Shulman 1939, Mayrovitz and Groseclose 2002). However, the complex afferent and efferent paths of the inspiratory gasp reflex are not yet fully understood.
This study used for the first time, WA for the investigation of PPG signals and to characterize the physiological response to DIG in terms of PAT. PAT was derived from the phase delay between the peripheral PPG and the cardiac ECG waveforms at the local dominant frequency which indeed corresponds to the heart rate. This approach allowed overcoming the limitation and uncertainty in the identification of pulse features which affect, for instance, the intersecting tangent method. Compared with the limitations of Fourier-based time-frequency analysis, WA facilitated both tailored time and frequency resolutions and a significant reduction in the spectral cross-terms. Here, the WA technique only requires the tuning parameter σ to be set in the Morlet wavelet equation in order to choose the desired time and frequency resolution, with larger σ leading to higher frequency resolution but lower time resolution and vice versa. At a heart rate of approximately 1 Hz, a value σ = 2 made the method sensitive enough to appreciate the changes of PAT in response to DIG. However, at significantly different heart rates or with different ranges of the variation in PAT, the value of σ would need re-evaluating. The use of a complex mother wavelet made possible the reliable computation of the dominant frequency also in the challenging situation of very low signal amplitude.
Importantly also, there were no significant differences across the three repeats for the gasp manoeuvre for the PAT response, giving confidence in the repeatability of this WA analysis approach and as compared to other studies on DIG response analysis (Allen et al 2002, Mayrovitz and Groseclose 2002).
The PAT depends on the arterial blood pressure. An increase in vascular tone results in a decrease in PAT. Conversely, a relaxation in vascular tone results in an increase in PAT (Boutouyrie et al 2009). In this study, a characteristic biphasic relative change in PAT was observed in response to DIG. It is interesting to note that the time of the maximal response appeared within approximately 3 s after the gasp started, and the reason for this is unclear. This duration may be linked to the time delay seen between ECG R–R interval and pulse transit time changes under slow paced breathing (i.e. 0.1 Hz) giving a mean offset of 3.2 (±0.8) heart beats (Drinnan et al 2001). The minimal PAT response appeared to coincide with the minimum of the PPG waveform (7–8 s after the start of inhalation).
This study showed an overall complex physiological gasp reflex response and future studies should investigate further the mechanisms involved. For example, future studies and modelling research could also take into account the effects of the cardiac pre-ejection period and arterial blood pressure on the PAT (Allen and Murray 2002).
The utility of the methods described in this paper is not only limited to the calculation of the PAT. Thanks to its robustness, it could also be suitable, for example, for the computation of heart rate variability (Shields 2009), and other parameters related to the pulse transit time, e.g. brachial-femoral and carotid-femoral propagation time. It is reliable for use with noisy data as it does not require calculating derivatives and there is no need to identify singular points on the pulse shape for its implementation.
5. Conclusion
The value of utilizing WA for quantifying the physiological cardiac and peripheral blood flow changes in response to DIG has been demonstrated in this pilot study. These methods could be used in future studies to characterize larger healthy populations, compare different disease groups and also to assess responses to therapy.
Acknowledgment
The authors would like to thank Professor P Frick, Professor A Krupatkin and A Dumler for their helpful advice on the work.