

Abstract
This work explores a cost-effective route to enhance the tuning range of the optical response of metal nanostructures on substrates beyond the ranges that are achievable through the nanostructure dimensions, composition or dewetting processes. The new route (laser seeding) uses single nanosecond laser pulses to induce dewetting in regions of a metal layer deposited on a glass substrate followed by the deposition of a second metal layer, both layers being deposited by pulsed laser deposition. In order to show the possibilities of this new route, we have chosen that the two metals were different, namely Ag and Au. The comparison of the optical response of these regions to those that were laser irradiated after deposition of the second metal layer shows that while nanoalloyed nanoparticles (NPs) are formed in the latter case, the NPs produced in the former case have a heterogeneous structure. The interface between the two metals is either sharp or a narrow region where they have mixed depending on the laser fluence used. While the nanoalloyed NPs exhibit a single, narrow surface plasmon resonance (SPR), the heterogeneous NPs show broader SPRs that peak in the near infrared and depending on conditions exhibit even two clear SPRs. The laser seeding approach in the conditions used in this work allows for the expansion of the tuning range of the color to the blue–green region, i.e. beyond the region that can be achieved through nanoalloyed NPs (yellow–red region). In addition, the results presented foresee the laser seeding route as a means to produce round and almost isolated NPs in an enhanced range of diameters.
Export citation and abstract BibTeX RIS
Introduction
Over the last decade, the field of nanostructures and nanoparticles (NPs) have raised a lot of interest due to their unique optical properties. These properties result from collective oscillations of surface electrons excited by the incident light that are generally known as surface plasmon resonances (SPRs). Since these SPRs appear in the visible for noble metals, Ag and Au are the most studied metals, and it is well known that their SPRs are very sensitive to the morphological features of the NPs as well as their composition and structure (i.e. core–shell or nanoalloyed NPs) [1, 2]. Neighboring NPs (typically dimers) have recently received much attention because their interaction leads to an enhancement of the local field effects that have been interpreted in the context of the plasmon hybridization model [3, 4].
Metal nanostructures have a high potential for several applications that include, among others, decorative coatings, tagging materials, photonics, solar cells, catalysis, chemical and/or bio sensors [2, 5–7]. For the particular case of solar cells and photocatalysis, it has recently been pointed out that large plasmonic NPs are essential for efficient light trapping [8, 9]. The final success of most of these applications thus depends very much on the capability of tailoring the optical response and/or NP morphology of the nanostructures to the application envisaged by cost-effective tools. Although Ag is the metal exhibiting the best plasmonic response, its poor chemical and structural stability prevents its widespread use, especially in non-ideal environments. An interesting alternative is the production of Ag rich mixed Ag–Au nanostructures that have recently been shown to have an improved stability and still excellent plasmonic properties [10]. These bi-metallic NPs offer their composition and their structure as extra parameters for tuning the optical response [1, 2, 6, 11, 12]. In addition, heterodimers formed by Ag and Au NPs promote new interacting modes with the potential for leading to unique spectral signatures [13–15].
Many of the envisaged applications require the metal nanostructures to be supported on substrates or platforms and thus thin film technologies for depositing metals on non-wetting substrates (such as glass) is the most cost-effective approach [16]. Due to the higher surface energy of the metal than the glass, the metal becomes unstable and tends to dewet in order to reduce the energy barrier, thus leading to island growth. Nonetheless, dewetting is a spontaneous and/or self-organized phenomenon and the range of nanostructure morphologies accessible (and thus optical responses) is limited by coalescence and percolation to diameters that are typically of a few tens of nm. A way to access bigger NPs (with diameters of 100 nm or higher) is to heat the substrate during film growth or to thermally anneal the metal films after deposition since the final diameter scales with the number of deposited atoms or thickness [14, 17].
Since dewetting is an inexpensive approach it is being proposed as a route for producing functional materials for several applications [18, 19]. However, both deposition on heated substrates or post-deposition thermal annealing are slow processes, which cause dewetting in the whole sample and are sensitive to environment [15]. Laser irradiation with single nanosecond pulses is a faster and easy-to-use alternative method for inducing dewetting. It is known to convert metal films into NPs and even self-organised structures with well-defined length scales. It can act remotely and be focused to different scales in almost any environment as opposed to other surface treatment techniques, such as electron or ion irradiation [9, 20–23]. Generally, the laser-induced dewetting process is induced using fluences high enough for melting but close to the transformation threshold leads to almost round NPs whose diameter scales with the initial metal layer thickness [24, 25]. Furthermore, we have recently shown that laser irradiation of two-layered bimetallic samples leads to nanoalloyed NPs [26], that allows tuning the SPR wavelength and bandwidth in a range that is almost twice as high as the range reported earlier upon laser exposure [10], and even higher when compared to the range achieved by conventional thermal dewetting [15]. Nevertheless, none of these works suggest the possibility of producing heterogeneous structure NPs (hetero-NPs) in a simple and controllable way as well as NPs having diameters different than those corresponding to their thickness.
The aim of this work is to explore a new route to produce hetero-NPs on substrates with an enhanced tuning range of the optical response beyond the ranges that are achievable through the dimensions, composition or conventional dewetting processes. The new route consists in using laser-induced dewetting of a metal layer followed by a second deposition of metal atoms. This produces hetero-NPs with a complex structure that leads to a different optical response. We have used single nanosecond UV pulses to irradiate regions of the samples with various laser fluences. For fluences close to the transformation threshold, we compare the NPs produced by laser irradiation before and after the deposition of the second metal layer. Several optical responses are accessible that are consistent with the production of various nanostructures ranging from nanoalloyed to complex hetero-NPs, the latter having the two metals mostly separated.
Experimental
The metal samples were prepared by pulsed laser deposition (PLD) in vacuum (<5 × 10⁻⁶ mbar) by means of an ArF laser (193 nm wavelength and 20 ns pulse duration). The laser beam was focused on rotating targets (either Ag or Au) at 45° leading to an energy of ≈38 mJ or fluence of ≈2.7 J cm−2 per pulse. A fixed number of pulses were used for each metal in all samples at a repetition rate of 5 Hz. The substrates were glass slides held at room temperature, positioned at ∼38 mm away from the target and rotated along an axis parallel to the plasma expansion axis and shifted a few mm in order to produce a homogenous deposit over an area >1 cm2.
Laser irradiation (LI) was performed in air using single nanosecond pulses from the same excimer laser and a fly's eye lens homogenizing system manufactured by Laser-Laboratorium Göttingen. The beam intensity was constant (within 5%, mainly related to laser intensity fluctuations) over ≈4 × 4 mm2 square regions. We have used two values of fluence close to the transformation threshold (127 mJ cm−2 and 186 mJ cm−2) and a higher fluence close to the damage threshold (295 mJ cm−2). These fluences will be respectively referred to as A, B and D to facilitate the comparison to earlier results [22].
We have produced bimetallic samples having either Ag (Ag-seeded) or Au (Au-seeded) as first deposited metal layer as well as single layer samples of the two metals. For bimetallic samples, the vacuum was broken after deposition of the first layer in order to perform LI at different regions of half of the samples. The samples return to the vacuum within ≅1 h for the PLD of the second metal. We have then performed LI at different regions of the other half of the sample. These two types of LI regions will be referred to from now on as pre-LI and post-LI regions respectively. There are in addition regions of the samples that receive no laser treatment at all that will be referred to from now on as as-grown regions. Finally, we have performed LI at regions of the single layer samples and these regions will be referred to from now on as LI Ag-seeding or Au-seeding layers. Figure 1 schematically shows the metal deposition and LI route sequences followed in the two halves of the Ag-single layer sample.
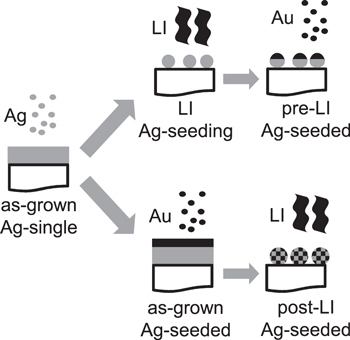
Figure 1. Sketch of the two routes followed in this work to produce bimetallic nanostructures starting from a Ag-single layer sample: pre-LI involving the production of a Ag-seeding layer by LI (top route) and post-LI involving LI of a bilayer structure (bottom route).
Download figure:
Standard image High-resolution imageSeveral regions of the samples were analysed by scanning electron microscopy (SEM) using a Zeiss Cross Beam 1540 XB microscope with an acceleration voltage of 5 kV and recording secondary electron images. The as-grown regions and a selection of LI regions of the Ag-seeded bimetallic sample were analysed by Rutherford backscattering spectrometry (RBS) using a 2 MeV Li beam with the CMAM 5 MeV tandetron electrostatic accelerator [27]. Following the procedure described elsewhere [21], the number of atoms were nat(Ag) = 2.6 × 10¹⁶ at cm−2 and nat(Au) = 1.9 × 10¹⁶ at cm−2 that lead to an overall Au content of 42 ± 8% where the error is the dispersion of the data obtained from the different regions of the sample. Finally, in order to characterize the absorption of the samples, we have measured the transmittance spectra (T(λ)) at 0° of incidence angle in the range 300–800 nm using a UV–vis Cary 5000 dual beam spectrometer. We then calculated the extinction spectra as ln(1/T(λ)).
Results
Figures 2(a)–(d) show SEM images of the as-grown regions of the four samples studied in this work, i.e. Ag- (figure 2(a)) and Au- (figure 2(b)) single layer samples and bimetallic Ag-seeded (figure 2(c)) and Au-seeded (figure 2(d)) samples. It is seen that single layer samples are close to the percolation limit and bimetallic samples are almost continuous. The optical responses are consistent with the described sample nanostructures as seen in figure 3(a) where the extinction spectra are shown: the single layer samples exhibit an SPR peaking around 605–615 nm while the bimetallic samples exhibit a featureless behaviour with extinction increasing towards the IR. This behaviour is typical of almost percolated and continuous metal layers respectively. Also, the intensity of the SPR in the Ag-single layer is much higher than that in the Au-single layer most likely due to the overlapping of the interband transitions with the plasmonic response in the latter case.
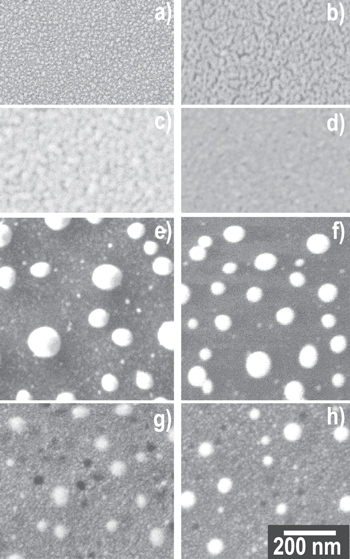
Figure 2. (a)–(d) SEM images of as-grown regions of the (a) Ag-single and (b) Au-single layer samples; (c) Ag-seeded and (d) Au-seeded bimetallic samples. (e)–(h) SEM images of post-LI (e), (g) Ag-seeded and (f), (h) Au-seeded samples for fluences (e), (f) A and (g), (h) D.
Download figure:
Standard image High-resolution image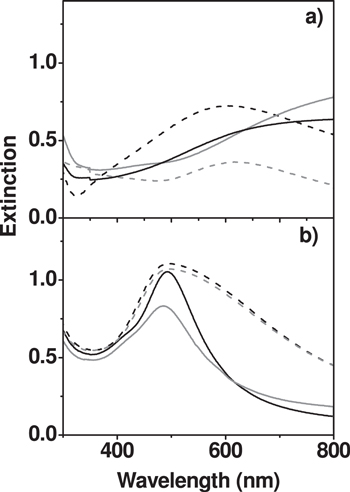
Figure 3. Extinction spectra of (a) as-grown regions of (black dash line) Ag-single layer, (grey dash line) Au-single layer, (black full line) Ag-seeded and (grey full line) Au-seeded samples; (b) post-LI regions of (black lines) Ag-seeded and (grey lines) Au-seeded samples for fluences (full lines) A and (dashed lines) D.
Download figure:
Standard image High-resolution imageFigures 2(e)–(h) show SEM images of regions of the Ag-seeded (figures 2(e), (g)) and Au-seeded (figures 2(f), (h)) bimetallic samples that were post-LI at the lowest (A, figures 2(e), (f)) and highest (D, figures 2(g), (h)) studied fluences. It is observed that the layer breaks up into big and isolated NPs in the former case, while it becomes substituted by smaller NPs in the latter case irrespective of the stacking order of the bimetallic samples (compare figures 2(e) to (f) and (g) to (h)). The extinction spectra of these regions are shown in figure 3(b) where it is seen that they do not depend on the stacking order and are again consistent with the layer nanostructure: a single, well defined and narrow SPR around 486–493 nm for the lowest fluence and a broadened band with increased absorption at the IR for the highest one. Since low fluences lead to large, isolated NPs showing sharp SPR responses, we will focus on this low fluence regime for the case of the pre-LI regions.
Figure 4 allows us to compare the SEM images of the pre-LI Ag-seeded sample (figures 4(a) and (c)) to the Ag-seeding layer (figures 4(b) and (d)) for the two studied low fluences. It is seen that the Ag-seeding layer is formed by almost round NPs for both fluences as expected. For fluence A, the morphology and distribution of the NPs after deposition of the second (Au) layer are almost identical to those seen in the Ag-single layer after LI (compare figures 4(a) to (b)). For fluence B, bigger NPs are observed and the number density of the NPs is notably reduced (compare figures 4(c) to (d)).
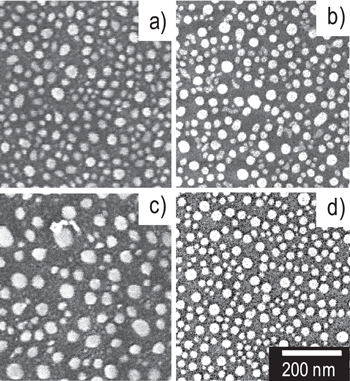
Figure 4. SEM images of (a), (c) pre-LI regions of the Ag-seeded sample and (b), (d) LI of Ag-single layer sample (Ag-seeding layer) produced at fluences (a), (b) A and (c), (d) B.
Download figure:
Standard image High-resolution imageTo quantify these differences, we have used the standard threshold criterion of the Image J software for processing the images in order to identify the area occupied by the NPs. The NPs' diameter was calculated from these areas assuming they were round. The statistical analysis was performed on 0.75 × 0.75 μm2 areas and we have taken into account a 10 nm diameter as the minimum resolvable diameter for the magnification that could be used in the SEM without significant distortion due to charge effects. Figures 5(a) and (b) show respectively the histograms achieved together with the Gaussian fit of the distributions for LI regions at fluences A and B of the pre-LI Ag-seeded sample and the corresponding Ag-seeding layer. The diameter is calculated from the maximum of the Gaussian distributions. The two fluences lead to similar NP distributions with a maximum slightly shifted to higher diameters for the highest fluence (20 nm and 25 nm) for the case of the Ag-seeding layers. For the pre-LI region of the Ag-seeded region at fluence A, the NPs' distribution is very similar and the diameter (26 nm) is slightly higher than that of the Ag-seeding layer. For fluence B, an almost flat distribution is instead observed that is very different to that of the Ag-seeding layer and the diameter is significantly higher (36 nm). For comparison, we have performed the same statistical analysis in the post-LI regions whose SEM images are shown in figures 2(e) and (f). The region studied was larger (4 × 2.7 μm2) and the minimum resolvable diameter was higher (65 nm) since the magnification used at the SEM had to be smaller. The results are included in figure 5(c) and evidence the fact that the diameter of the NPs is much higher than that in the pre-LI regions and is similar (93 nm and 101 nm) when changing the stacking order.
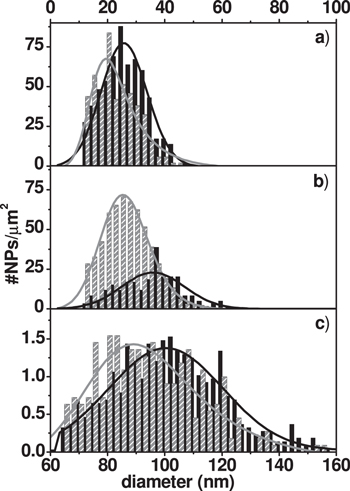
Figure 5. (a), (b) Histograms of NPs produced in (grey patterned bars) the Ag-seeding layer and (black patterned bars) pre-LI regions of the Ag-seeded sample at fluences (a) A and (b) B. (c) Same in post-LI regions at fluence A in (black bars) Ag-seeded and (grey patterned bars) Au-seeded samples. The width of the bars is 2.5 nm, the lines are Gaussian fits and the horizontal axis scale for (a) and (b) is the top one. Note that although the x-axis interval plot in (a), (b) and (c) is different, the scale is the same.
Download figure:
Standard image High-resolution imageFigure 6 shows the extinction spectra of the regions whose structure was shown in figure 4. In addition, the extinction spectra of the Au-seeding layer and the pre-LI Au-seeded regions exposed to fluence B are included. It is seen that the spectra of both seeding layers exhibit well-defined narrow SPRs peaking around 411 nm and 570 nm for the Ag and Au layers respectively; these results being very similar to those reported earlier [21]. The spectra of the pre-LI regions show instead very broad bands that appear to be composed of two bands peaking around 473 nm and in the range 620–720 nm, the latter being generally dominant. These two bands will be referred to from now on as the blue and red SPRs. For the case of pre-LI at fluence B of the Ag-seeded layer region, these two SPRs are very evident since the blue SPR intensity becomes higher than that of the red one. Although the spectrum of the pre-LI at fluence B of the Au-seeded layer region reminds us that of the pre-LI at fluence A of the Ag-seeded layer, the blue SPR is less evident and the red SPR is more intense and shifted to the red.
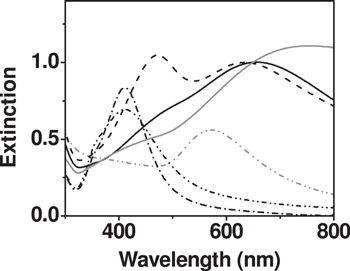
Figure 6. Extinction spectra of (black lines) the Ag-seeding layer produced at fluence (dash dot line) A and (dash dot dot line) B, (grey dash dot dot line) the Au-seeding layer produced at fluence B, (black lines) the pre-LI Ag-seeded sample at fluence (full line) A and (dash line) B, and (grey full line) the pre-LI Au-seeded sample at fluence B.
Download figure:
Standard image High-resolution imageFigure 7 shows the RBS spectra of as-grown and pre-LI Ag-seeded regions in the range of energies corresponding to the metals. Two sharp peaks are observed and to ease the comparison, the spectra have been normalized to the maximum of the Au-related peak, i.e. the one at the highest energy. The shape and isolation of the two peaks are consistent with the two metals being well separated in the as-grown regions. It is seen that the high (surface) energy barriers of the two metals in the as-grown and pre-LI regions almost overlap, indicating that Au is always at the surface and the Ag atoms closer to the surface are at the same depth in all regions. The low energy barrier of the Au-related peak of the pre-LI region overlaps to that of the as-grown region for fluence A and shifts to lower energies for fluence B. This result proves that the depth along which Au extends is identical to that in the as-grown region for fluence A and becomes thicker for fluence B. The low energy barriers of the Ag-related peak are shifted to lower energies, the higher the fluence the higher the shift. This result is consistent with pre-LI inducing the formation of almost spherical NPs with a diameter higher than the initial Ag layer thickness as seen in figures 5(a) and (b). The RBS spectrum of the post-LI region is also included in figure 7 where, it can be seen, it is very different from the spectra of the as-grown and pre-LI regions. It shows very asymmetric peaks whose low-energy branch extends towards much lower energies leading in addition to an overlapping of the low energy branch of the Au-related peak with the high energy branch of the Ag-related peak. These features are consistent with the overlapping of the two metals along similar depths as well as the diameter of the NPs formed being much higher not only than the initial layer thickness but also of the diameter of the NPs in the pre-LI region, as seen in figures 5(a) and (b).
Figure 7. RBS spectra plot in the high energy region and recorded from the Ag-seeded sample at (black full line) as-grown region, pre-LI region at fluence (grey dash line) A and (grey dash-dot line) B and (grey full line) post-LI region.
Download figure:
Standard image High-resolution imageDiscussion
The results achieved in this work demonstrate that pre-LI regions of bimetallic samples exhibit plasmonic responses that are substantially different from those of the LI regions of single metal samples or post-LI regions of bimetallic samples. The two latter samples tend to exhibit single, well defined and narrow SPRs that are consistent with the formation of almost round and isolated NPs. The post-LI regions of bimetallic samples show in addition a very similar response when changing the stacking order. These results are consistent with LI inducing melting of the whole structure followed by dewetting [28, 29]. Mixing of the two metals is promoted by the high diffusion rates in the liquid state and the high miscibility of Au and Ag. It can thus be concluded that nanoalloyed NPs have been formed upon post-LI of bimetallic samples in agreement with earlier studies [21, 22]. The fact that the extinction at the UV side of the spectrum is almost constant regardless of the stacking order (figure 3(b)) supports this conclusion further [6].
The pre-LI regions of bimetallic samples show also the formation of almost round and isolated NPs. However, the diameter of the NPs is smaller than that of the NPs in post-LI regions, i.e. the one expected from the thickness of the bimetallic samples. This result is related to the fact that the diameter of the NPs is determined in this case by that of the NPs in the Ag-seeding layer (figures 5(a) and (b)) and they are determined by that of the thickness of the first metal layer [24, 25]. Extrapolating this result it can be concluded that the seeding route proposed in this work provides access to any diameter of almost round NPs up to that achievable by post-LI through the effective thickness of the first deposited or seeding metal layer. Furthermore, it is well known that the diameters of isolated NPs accessible by directly depositing metals on insulating substrates are limited by coalescence and percolation and this limit depends on the deposition technique and substrate temperature [30]. For the particular case of Ag deposited by PLD, the critical thickness and diameter are around ≅10 nm [31]. The seeding route thus also offers a simple way to overcome the diameter limit imposed by the percolation limit.
The optical response of pre-LI regions is much broader than that of post-LI regions and two SPRs are even clearly identified for certain conditions (figure 6). In addition, RBS data prove that the two metals are almost unmixed. These results suggest that the laser-induced dewetting of the first deposited metal layer followed by the deposition of the second metal layer leads to the formation of hetero-NPs in which the two metals are somehow separated. However, some differences are noticeable for the two fluences used for producing the seeding layers.
For fluence A, the comparison of the SEM image in figure 4(a) for the pre-LI region of the Ag-seeded sample to that in figure 4(b) for the Ag-seeding layer shows that the deposition of the Au layer has no significant impact on the NPs features (shape and number density) with respect to those produced when laser irradiating the Ag-single layer. Furthermore, the only significant difference observed is a slight increase of the diameter of the NPs and the coarsening of the few irregular NPs that can be seen in figure 4(b). PLD is known to involve energetic ions and the bombardment of NPs by this type of ion is known to promote surface diffusion, coarsening, agglomeration and/or fragmentation as well as sputtering of the smaller NPs or implantation of the ions on the surface of the NPs. For the case of ablation of Au using the same experimental conditions used in the present work, ≅28% of the ions arriving to the substrate have kinetic energies >200 eV [32]. The bombardment of these energetic ions can explain the coarsened NPs observed after deposition of the second Au metal (figure 4(a)). In addition, the fact that the number density of NPs after deposition of the second metal is higher (608 μm−2) than after LI of the first metal layer (472 μm−2) suggests that the deposition of the second metal layer has in addition either induced some fragmentation or produced Au NPs. Since deposition of metal on metal is energetically more favourable than on glass, the former explanation is most likely.
The RBS results in figure 7 in addition prove that the Au atoms are primarily deposited on top of the existing Ag NPs thus leading to NPs that look round in plan-view but have a kind of bilayer structure in depth as sketched in figure 1. The structure of the hetero-NPs could to some extent be assimilated to heterogeneous asymmetric dimers with their axis oriented perpendicular to the substrate [11–13]. For fluence A, there is negligible mixing of the two metals since on the one hand, the Au-related peak in the RBS spectrum is identical in the pre-LI and as-grown regions, indicating that the Au atoms extend along the same depth. On the other hand, the high energy barrier of the Ag-related peak also remains as in as-grown regions indicating that the Ag atoms closer to the surface are at the same depth. The fact that the Ag-related peak is slightly broader than in the as-grown region is consistent with the dewetting process induced by LI of the Ag-single layer leading to Ag NPs with a diameter of 20 nm (figures 4(b) and 5(a)) and thus much thicker than the initial Ag layer effective thickness.
For fluence B, the SEM image in figure 4(d) shows on the one hand that the NPs in the Ag-seeding layer are all round (no irregular NPs can be appreciated). The statistics analysis (figure 5(b)) shows that they are slightly bigger than those produced by fluence A, and this is consistent with the broader Ag-related peak observed by RBS. The SEM image after deposition of the second metal layer in figure 4(c) shows that there are much less small NPs than for fluence A and several bigger NPs have in addition been formed. The statistical analysis (figure 5(b)) shows that the diameter distribution is flatter and has a weak maximum around 36 nm. In addition, the number density is much smaller (253 μm−2) than that of the NPs in the Ag-seeding layer (598 μm−2). These results suggest that the deposition of the second layer promotes mainly agglomeration in this case. In addition, the low energy barrier of the Au-related peak shifts to lower energies while the high energy barrier of the Ag-related one remains. This result proves that there is some penetration of Au atoms into the Ag at the interface. All together, this allows us to conclude that the hetero-NPs have a sharp interface between the two metals when the seeding layer is produced at fluence A, while there is an interface region of mixed Ag–Au when it is produced at fluence B. Using the energy distributions of Au ions during PLD reported elsewhere [26], we have calculated the implantation range of Ag in Au using the procedure described elsewhere [33]. The calculations lead to a width of this mixed interface <1 nm. The reasons why this interface is formed when producing the seeding layer at fluence B and not at fluence A are unclear and might require further investigations provided that both fluences lead to NPs having similar features (figures 4(b) and (d)). However, these differences highlight that the laser fluence for producing the seeding layer is a critical parameter controlling the plasmonic response, i.e. slight variations of laser fluence lead to very different optical responses.
The most distinctive feature of pre-Li regions is the very broad plasmonic response that is peaking in the near infrared and even exhibits two SPRs. Extinction spectra with broad plasmonic response and two SPRs each related to Au and Ag are typically observed for core–shell structures of the two metals [6, 9, 10]. However, the way our complex NPs are produced, deposition of the second metal on top of NPs of the first metal as well as the RBS spectra that prove the two metals are mostly separated make the formation of core–shell structures very unlikely. The bilayer structure of the hetero-NPs is thus closer to that of heterodimers formed by pairs of Ag and Au NPs. When the two NPs in the dimers are separated by distances smaller than their diameter, two SPRs are observed and their extinction is enhanced when the electric field of the incident light is parallel to the dimer axis [12, 13, 34]. Furthermore, the observed changes when changing the polarization affect mainly to the spectral region around the red SPR and the relative spectral position of the two SPRs depend very much on the relative dimensions and shape of the two NPs forming the dimer [13]. However, the spectral wavelengths at which these variations are observed are generally <600 nm both in core–shell and heterodimers while our results in figure 6 show an enhanced response for wavelengths >600 nm.
For the case of homogenous dimers formed by Au nanodisks produced by electron beam lithography having gaps ranging from hundreds of nm to almost touching [4], the dimers showed a strong shift of the SPR to the red when the two NPs become very close leading to an enhanced extinction in the 600–700 nm region. Furthermore, when touching, a new plasmon mode arising from charge transfer oscillations emerges leading to extreme modification of the overall optical response [35]. These earlier results suggest that the optical response of the hetero-NPs produced in this work is consistent with that of asymmetric pairs of touching non-spherical Au NPs and almost spherical Ag NPs. However, our experimental conditions, i.e. illuminating with unpolarised light perpendicular to the substrate and the asymmetric dimers being oriented perpendicular to the substrate, make all extinction spectra reported in this work equivalent to perpendicular polarization (electric field vibrating perpendicular to the dimer axis). The spectra of dimers for this polarization are generally almost identical to that of the half-sum of the extinction of the isolated NPs for this polarization [12, 13]. The half-sum of the extinction spectra of Ag-seeding and Au-seeding layers in figure 6 provides a spectrum very similar to that reported in [12, 13] and very different to those of the pre-LI regions. In addition, the enhancement caused by plasmon coupling in the infrared is generally smaller than the one observed in the present work. These considerations show clearly that there must be an additional fact contributing to the observed optical response that requires further investigation.
The staking order has little impact on the optical response of LI bimetallic samples. For the case of post-LI regions, there is no significant impact either on the structure (figures 2(e)–(h)) or the optical response (figure 3(b)). For the case of pre-LI regions, the optical response of the region of the Ag-seeded sample exposed to fluence A is very similar to that of the Au-seeded sample exposed to fluence B (figure 6). Both exhibit a weak blue SPR that is smeared off by the dominancy of the red SPR and the red SPR is shifted to the red in the Au-seeded sample with respect to that in the Ag-seeded sample. Assuming that the appearance of two clear SPRs relate in our case to the existence of a mixed interface as discussed above, the fact that two SPRs are not evident for the Au-seeded sample in which the Au-seeding layer was produced at fluence B can be related to the stronger tendency of Au to incorporate into Ag compared to the reverse [10]. This asymmetric behaviour can reduce or even prevent the formation of the mixed interface when Ag is the surface metal. This result provides further support to the earlier conclusion that the plasmonic response of bimetallic nanostructures can be tuned by controlling the film-substrate interface [36].
Finally, in order to evaluate the colour tuning range of the two processes investigated in this work, namely the formation of nanoalloyed (by post-LI) and heterogeneous (by pre-LI or laser seeding) NPs, we have calculated the colour coordinates from the extinction spectra of post-LI (figure 3(b)) and pre-LI (figure 6) regions using the CIE-D65 Illuminant and the CIE-1931 Standard Observer [37]. The (a*,b*) chromatic diagrams are shown in figure 8(a) where the coordinates of the as-grown regions are within the shadowed area. It is seen that while the post-LI process allows for the extension of the colour gamut within the yellow–red region as reported earlier [22], the pre-LI process makes accessible colour gamut within the blue–green region. The tuning range in both cases is broader than 10 CIELAB units and it is worth pointing out here that the latter region was not even accessible by post-LI bilayer samples in which the Ag to Au ratio was varied [22]. The overall tuning range achieved with the two types of LI is more than 20 units along the two chromatic CIELAB axes. Figure 8(b) shows the CIELAB L* coordinate of the same regions as in figure 8(a). It is seen that the lightness decreases as the fluence increases irrespective of the process followed to modify the optical response and it is always slightly higher in the Au-seeded than in the Ag-seeded regions, in spite of the little impact that the staking order has on the extinction spectra.

Figure 8. (a) (a*), (b*) chromatic diagrams and (b) CIELAB L* coordinate as a function of fluence for (●) pre-LI and (▲) post-LI region from the Ag seeded sample and (◯) pre-LI and (△) post-LI regions from the Au-seeded samples. The values for as-grown samples are marked in (a) by a shadow and plotted in (b) at the origin of the fluence axis.
Download figure:
Standard image High-resolution image
Conclusions
This study demonstrates that the use of laser irradiation to produce seeding layers of metal NPs followed by deposition of a second metal is a simple and easy-to-use approach to produce heterogeneous structure NPs and expand the tuning possibilities of plasmonic responses. When the two metals are different, the bimetallic NPs can be assimilated to hetero-NPs that behave optically as hetero-dimers formed by touching NPs of each metal with either a sharp or a narrow interface where the two metals are mixed depending on the fluence used to produce the seeding layer. This work presents a proof-of-concept of the potential of this approach since the experimental conditions were almost fixed, i.e. the laser fluence was varied in a narrow range near the transformation threshold and the two metals' atomic ratio was the same regardless of the configuration used. The results prove that several plasmonic responses can be achieved by laser irradiation that lead to colors varying in more than 20 CIELAB units along the two CIELAB chromatic axes (a* and/or b*).
This research also highlights the key parameters that have an important impact on the plasmonic response. Concerning laser irradiation, the irradiation order (before or after the deposition of the second metal) and the laser fluence used to produce the seeding are essential parameters impacting on the NPs structure and eventually on their optical response. The most important parameter of the samples is the amount of metal of each type because their relative amount determines the overall composition that is very relevant when producing nanoalloyed NPs. In addition, the thickness of the first deposited or seeding layer determines the diameter of the hetero-NPs and thus this thickness allows for the enhancement of the range of diameter of NPs accessible.
Acknowledgments
R J P and C E R respectively acknowledge the grant JCI-2012-13034 from the Juan de la Cierva program and the postdoctoral fellowship No. 175641 from CONACYT-México. We thank Professor P Leiderer and Dr S Riedel from University of Konstanz (Germany) for part of the SEM characterization; Professor A Climent-Font from Centro de Micro-Análisis de Materiales (CMAM), University Autonoma Madrid (Spain) for assistance and helpful discussions with the RBS measurements; and Dr J Campos from Instituto de Óptica (CSIC) for the help and advice on determining the colour coordinates.