Abstract
Thermopower waves, which occur during combustion within hybrid structures formed from nanomaterials and chemical fuels, result in a self-propagating thermal reaction and concomitantly generate electrical energy from the acceleration of charge carriers along the nanostructures. The hybrid structures for thermopower waves are composed of two primary components: the core thermoelectric material and the combustible fuel. So far, most studies have focused on investigating various nanomaterials for improving energy generation. Herein, we report that the composition of the chemical fuel used has a significant effect on the power generated by thermopower waves. Hybrid nanostructures consisting of mixtures of picric acid and picramide with sodium azide were synthesized and used to generate thermopower waves. A maximum voltage of ∼2 V and an average peak specific power as high as 15 kW kg−1 were obtained using the picric acid/sodium azide/multiwalled carbon nanotubes (MWCNTs) array composite. The average reaction velocity and the output voltage in the case of the picric acid/sodium azide were 25 cm s−1 and 157 mV, while they were 2 cm s−1 and 3 mV, in the case of the picramide/sodium azide. These marked differences are attributable to the chemical and structural differences of the mixtures. Mixing picric acid and sodium azide in deionized water resulted in the formation of 2,4,6-trinitro sodium phenoxide and hydrogen azide (H-N3), owing to the exchange of H+ and Na+ ions, as well as the formation of fiber-like structures, because of benzene π stacking. The negative enthalpy of formation of the new compounds and the fiber-like structures accelerate the reaction and increase the output voltage. Elucidating the effects of the composition of the chemical fuel used in the hybrid nanostructures will allow for the control of the combustion process and help optimize the energy generated from thermopower waves, furthering the development of thermopower waves as an energy source.
Export citation and abstract BibTeX RIS
1. Introduction
One way of producing energy is the combustion of chemical fuels. Combustion-based energy production methods require relatively large systems, such as a power plant or an internal combustion engine, to produce electrical or mechanical energy. Over the last decade, owing to the development of new research areas such as micro- and nanotechnology, there have been efforts to use chemical combustion as the power source for small-scale devices, such as microthrusters, microreactors, and microactuators, which require mechanical or thermal energy [1–4]. At the same time, energetic materials confined in precisely designed micro- and nanostructures have been developed that allow the released thermal and mechanical energy to be guided and amplified [3–4]. In spite of the high energy density of chemical fuels, there are fundamental restrictions when it comes to the combustion of such fuels to generate electrical energy on a small scale [5]. More recently, the concept of thermopower waves has been developed to produce electrical energy on a small scale through the direct use of chemical fuels [6] without requiring any mechanical parts. Thermopower waves, which are driven by combustion within hybrid composites of nanomaterials and chemical fuels, cause a self-propagating thermal reaction on the interfacial areas, as well as the concomitant generation of electrical energy from the acceleration of charge carriers along the nanostructures [6]. The hybrid nanostructures used to produce thermopower waves are shrinkable electrical energy sources free of any mechanical moving parts and exhibit a high potential for use as miniaturized power sources with a high specific power density. Further, they should also potentially allow for the recovery of waste fuels from specific systems [5]. Research on thermopower waves is still in the nascent stage, and there are extensive efforts underway to understand this fundamental phenomenon and its underlying physics [7–9]. In particular, the thermal propagation of the chemical reaction, the chemical potential of the hybrid structure, and the temperature gradient of the nanomaterials are regarded as the major factors affecting the phenomenon of thermopower waves. From a different point of view, because the concept of thermopower waves is a relatively new one, it might result in significant advances in energy generation. The hybrid structures used to generate thermopower waves are composed of two main components: the core thermoelectric nanomaterial and the combustible fuel. Most of the studies on improving energy generation using thermopower waves have tended to focus on investigating core thermoelectric materials for the hybrid nanostructure. BiTe3 [10] and a BiTe3-SbTe3 composite [11] were studied because they exhibit high Seebeck coefficients at relatively low temperatures. Thermoelectric materials with high Seebeck coefficients at high temperatures, such as ZnO films [12] and MnO2 [13], have successfully been used to generate high output voltages. Hybrid composites of Sb2Te3 and multiwalled carbon nanotube (MWCNT) arrays [14] exhibit higher output voltages than do MWCNT arrays alone. However, there have been no studies on the effects of the composition of the chemical fuel used for generating thermopower waves, even though the choice of the fuel is one of the most critical factors determining the overall reactions involved in energy conversion using thermopower waves.
In this work, we report the critical characteristics of the chemical fuel that result in increases in energy generation from thermopower waves. Hybrid, nanostructured MWCNT-based composites consisting of two different mixtures of chemical fuels, namely, picric acid/sodium azide (NaN3) and picramide/sodium azide were synthesized. We then explored how the composition of the chemical fuel used affects the various fundamental characteristics of thermopower waves. We found that the maximum peak voltage was ∼2 V and the average peak specific power reached 15 kW kg−1, the highest numbers so far in MWCNTs/fuel composite, when the picric acid/sodium azide/MWCNT array composite system was used. Further, the maximum and average output voltage obtained using the picric acid/sodium azide system (∼2 V and ∼157 mV, respectively) were much higher than those for the picramide/sodium azide system (∼10 mV and 3 mV, respectively), when identical hybrid MWCNTs arrays were used to make the hybrid composites. The reaction velocity in the case of the picric acid/sodium azide system (∼27 cm s−1) was much higher than that for the picramide/sodium azide system (3 cm s−1). This intrinsic difference is due to the chemical and structural differences in the chemical fuels. During the wet impregnation process that constructs the hybrid composite of MWCNTs and the chemical fuel, the picric acid/sodium azide mixture turns into the mixtures of 2,4,6-trinitro sodium phenoxide /hydrogen azide (H-N3), owing to the exchange of H+ and Na+ ions. This transition results in the benzene π-stacking structure, which promotes the hydrodynamic self-alignment of the chemical fuel and amplifies the chemical reaction from thermopower waves. These minute changes of the chemical fuel can significantly modulate the reaction propagation velocity, the output voltage, and the peak specific power of thermopower waves. We believe that these results will provide valuable insights into the optimization of the design of hybrid composites for thermopower waves, especially with respect to the composition of the chemical fuel used.
2. Experimental section
Vertically aligned multiwalled carbon nanotubes (VAMWCNTs) were synthesized by the chemical vapor deposition (CVD) method in a quartz tube furnace [15]. ten nm thick Al2O3 and 1 nm thick-Fe layers for use as catalysts were deposited on a predesigned silicon wafer by electron beam evaporation. Ethylene, hydrogen, and argon were used as the carbon source and the catalytic and carrier gases, respectively. A tungsten filament was placed at the entrance for the gases to promote the decomposition of the hydrocarbons. By controlling the argon flow at the end of the CVD process, it was possible to induce weak bonding between the MWCNTs and the silicon substrate. As a result, the MWCNTs could be easily separated from the wafer. The length of the synthesized VAMWCNT array was 2–6 mm, as determined by the duration of the CVD process. The cross-sectional area of the CNT array was controllable through a post-processing treatment. The synthesized array of MWCNTs, which was freestanding and aligned, is shown in figure 1(a). This SEM image confirms that well-aligned MWCNTs were synthesized by the CVD process while the diameters of the MWCNTs were 20–30 nm, as shown in the TEM image (figure 1(b)).
Figure 1. Structure of a VAMWCNT array. (a) Large-area VAMWCNT array formed by CVD and its SEM image showing its well-aligned structures. (b) TEM image of the individual MWCNT after the dispersion of the array.
Download figure:
Standard image High-resolution imagePicric acid and picramide were used as the fuels for the exothermic chemical reaction, owing to their large enthalpies of combustion, which are 2570 kJ mol−1 and 2850 kJ mol−1 [16], respectively. Sodium azide was added as a primary igniter to lower the ignition energy of the fuel mixtures, as it has a low activation energy (40 kJ mol−1). Hybrid composites of the chemical fuel mixtures and the MWCNT arrays were synthesized by wet impregnation, first with 2.6 mM of the chemical fuels in an acetonitrile solution and then with 0.3 mM sodium azide in deionized water [6]. During the drying stage, the solution dissolved, the chemical fuel mixture was evaporated, and the chemical fuel only remained. Further, at ambient temperature and pressure, densely packed MWCNT arrays were formed owing to the capillary force and the van der Waals force [17] between the individual MWCNTs, which reduced the pores in a MWCNT array. As a result, hybrid nanostructures for the generation of thermopower waves could be obtained.
A device to characterize the thermopower waves was designed and fabricated using a previously reported technique [6]. In brief, the hybrid composite of the chemical fuel and the MWCNT array was placed on a piece of glass that included two copper electrodes. A silver paste was used to connect the two ends of the hybrid composite and the copper electrodes. A tungsten element initiated the combustion of the fuel mixture along the aligned MWCNT array through Joule heating. This ignition source came into contact with the fuel only outside the MWCNTs. This allowed a thermopower wave to be generated without interference of the electric field from the ignition source. After the initiation of the thermopower wave, the tungsten element was quickly separated from the composite. Figure 2 shows a schematic of the thermopower-wave-generating device and the experimental setup used to study the various phenomena occurring during the combustion process. The velocity and other parameters related to the chemical reaction occurring on the surfaces of the CNTs were obtained using the high-speed microscope that could record the thermal propagation owing to the combustion on the hybrid composite in real time. At the same time, the oscilloscope could measure the voltage generated during the combustion process in real time. For the quantitative characterization of the hybrid composites, the mass of the MWCNTs, that of the MWCNTs/fuel mixture systems, and the resistances of the composites were measured to evaluate the performances of the devices for thermopower waves.
Figure 2. Schematic of measurement setup used to study the generated thermopower waves. The chemical fuel/MWCNTs composites were placed on a set position. The high-speed camera measured the combustion along the MWCNTs, and the oscilloscope recorded the output voltage.
Download figure:
Standard image High-resolution image3. Results and discussion
The combustion of the different chemical fuel mixtures, namely, picric acid/sodium azide and picramide/sodium azide, in the MWCNTs is shown in figures 3(a) and (b). As can be seen from the figures, the combustion rate of the picric acid/sodium azide mixture was greater than that of the picramide/sodium azide mixture. This was because the reaction velocity of the former is much higher. The hybrid composite consisting of the picric acid/sodium azide mixture and the MWCNT array produced a steadily propagating wave with an average velocity of 27 cm s−1, with the maximum velocity being 67 cm s−1 (figure 4(a)). On the other hand, the picramide/sodium azide/MWCNT array composite generated a wave with a low propagation velocity, of approximately 1.5 cm s−1, with the maximum velocity being 6 cm s−1 (figure 4(b)). It has been reported that the reaction velocity in the case of a picramide/sodium azide/SWCNTs fiber composite fluctuated between 9 cm s−1 and 36 cm s−1 [7], with the average value being 10–20 cm s−1. These velocities are of the same order as those observed in the present study (figure 4(c)), and the minor difference in their values might be attributable to the difference in the properties of the nanomaterials used, namely, the VAMWCNT array and the SWCNTs fiber. Moreover, the large difference in the chemical reaction rates corresponding to picric acid and picramide resulted in significant differences during the thermopower wave-based voltage generation using the materials. The representative shapes of the voltage signals generated in the two cases are shown in figure 5. As was reported in a previous work [18], the voltage signals could be divided into two distinct areas: an active reaction region, that is, a region corresponding to the propagation of the reaction and a cooling region, that is, a region corresponding to the period after the completion of the reaction. Surprisingly, the picric acid/sodium azide/MWCNTs composite generated a higher voltage than did the picramide/sodium azide/MWCNTs composite.
Figure 3. High-speed microscopic images of the generated thermopower waves. (a) Propagation of combustion along the picric acid/sodium azide/MWCNT array composite. (b) Propagation of combustion along the picramide/sodium azide/MWCNT array composite.
Download figure:
Standard image High-resolution image
Figure 4. Scatter plots of the reaction-front velocity corresponding to combustion (a) in the picric acid/sodium azide/MWCNTs composite and (b) in the picramide/sodium azide/MWCNTs composite. (c) Comparison of the reaction velocity corresponding to the two cases on the log scale.
Download figure:
Standard image High-resolution image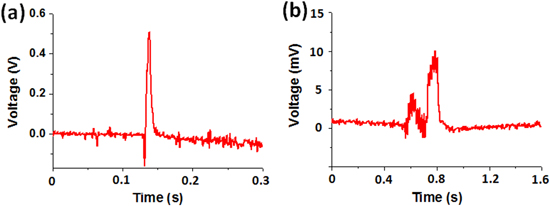
Figure 5. Typical shapes of the thermopower wave-generated output voltage signal obtained using (a) the picric acid/sodium azide/MWCNTs composite and (b) the picramide/sodium azide/MWCNTs composite.
Download figure:
Standard image High-resolution imageQuantitative comparisons of all the real-time voltage signals are shown in figure 6. The scatter plots of the peak voltages (figure 6(a)) as well as the peak specific powers (figure 6(b)) corresponding to the picric acid/sodium azide/MWCNTs and the picramide/sodium azide/MWCNTs composites were extracted from the individual voltage signals corresponding to the composites. Both the peak voltage (maximum: 2.05 V; average: 157 mV) and peak specific power (average: 15 kW kg−1) for the picric acid/sodium azide/MWCNTs composite were much greater than those of the picramide/sodium azide/MWCNTs composite. Further, the peak voltage and peak specific power for the picric acid/sodium azide/MWCNTs composite were higher than those previously reported for thermopower wave-based power generation using CNTs. In addition, regardless of the mass of the composites, the overall performance of the picric acid/sodium azide/MWCNTs composites surpassed that of the picramide/sodium azide/MWCNTs composites.
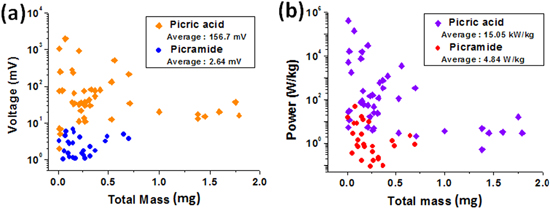
Figure 6. Scatter plots of the (a) peak output voltage and (b) peak specific power corresponding to the picric acid/sodium azide/MWCNTs composite and the picramide/ sodium azide/MWCNTs composite.
Download figure:
Standard image High-resolution imageOn the basis of the correlation between the reaction velocity and the output voltage, it could be concluded that effective combustion during wave propagation modulates the overall performance of thermopower waves. A high reaction velocity causes a temperature gradient to be maintained in one direction; this generates a single polarity with respect to energy generation without there being a cancelation in the opposite direction [6]. However, the slow reaction velocity in the case of the picramide/sodium azide/MWCNTs composite inevitably causes a reverse temperature gradient during the reaction, which prevents charge-carrier transfer in the opposite direction during wave propagation. Figure 7 shows a comparison of the velocity of wave propagation and the peak voltage. The maximum and average output voltages for the picric acid/sodium azide mixture (∼2 V and ∼157 mV) were higher than those for the picramide/sodium azide mixture (∼8 mV and ∼2.7 mV), even when identical MWCNT arrays were used. Further, these values could be compared to those reported previously for a picramide/sodium azide/SWCNTs fiber composite, which generated an average output voltage of 20–30 mV [7], due to the use of SWCNTs. The overall distribution of the output voltage for the picramide/sodium azide mixture is in the same range. In particular, in this study, the higher average velocity which was indicative of a more effective chemical reaction resulted in a higher peak voltage. This result is in agreement with a previous work [6] that emphasized the importance of the reaction velocity for effective energy generation. The estimated diffusion time for MWCNTs with a length of a few millimeters [19] is approximately 0.4 cm2 s−1. The reverse temperature gradient observed during the reaction is affected by the time scale of wave propagation from the picramide/sodium azide/MWCNTs composite. On the other hand, the time scale in the case of the picric acid/sodium azide/MWCNTs composite was smaller than the diffusion time scale and did not result in a change in the direction of the temperature gradient.
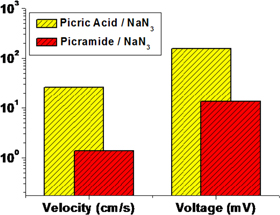
Figure 7. Comparison of the reaction velocity and output voltage generated by thermopower waves when using picric acid and picramide as the main chemical fuel.
Download figure:
Standard image High-resolution imageDetailed investigations of the structural differences between the picric acid/sodium azide and the picramide/sodium azide mixtures confirmed the origin of the differences in the thermopower waves observed in the two cases. The structure of the chemical fuel mixture used depends on the type of fuel used. The main fuel and the primary initiator were combined in the hybrid composites. During the evaporation stage of the wet impregnation process, the picric acid/sodium azide and picramide/sodium azide mixtures exhibit distinct physical structures. The picric acid/sodium azide mixture forms one-dimensional, cylindrical structures (figure 8(a)) in the MWCNT array. These unique structures are also formed when picric acid and sodium azide are mixed in the absence of the MWCNT array (figures 8(b), (c)). However, when picramide and sodium azide are mixed, they form randomly dispersed, irregular structures in either case (figures 8(d)–(f)). Generally, the picric acid, picramide, and sodium azide solidify completely into randomly dispersed, irregular structures without mixing with each other during the wet impregnation process. However, when picric acid and sodium azide are mixed to be used as the chemical fuel within a hybrid composite for thermopower wave generation, two specific chemical and structural changes are noticed in the structure of the hybrid composite structure; these changes have a significant effect on the reaction velocity and energy generation. The Raman spectra of the picric acid/sodium azide mixture confirmed the changes that took place (figure 9). Two new peaks, at 1310 cm−1 and 1570 cm−1, respectively, were observed after picric acid and sodium azide were mixed, while no new peak was observed in case of the mixture of picramide and sodium azide. This means that only the mixture of picric acid and sodium azide resulted in a chemical fuel with a new composition within the hybrid composite [20]. The chemical structures of picric acid and sodium azide are shown in figure 10(a). In an aqueous solution, the acidic proton (H+ ion) from picric acid is exchanged with the Na+ ion from sodium azide because picric acid is more acidic than hydrazoic acid (HN3), or an azide ion (N3−) has a stronger affinity to proton than a picrate ion (figure 10(a)). Through this process, sodium 2,4,6-trinitro phenoxide ((NO2)3C6H2ONa), which has coordinative bonds to sodium, and hydrogen azide (H-N3) are formed in the aqueous solution (figure 10(b)). Thus, the Na-O and H-N bonds are what result in the two new Raman peaks noticed when picric acid and sodium azide are mixed.
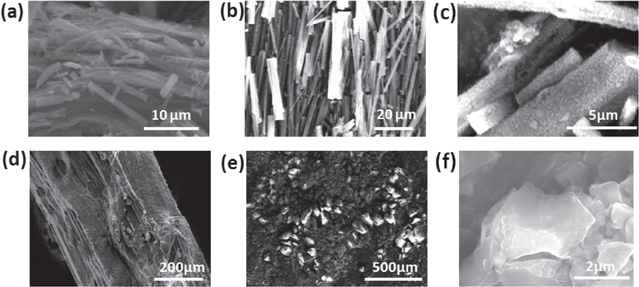
Figure 8. SEM images of the chemical fuel/MWCNT array composites. (a) Structure of the picric acid/sodium azide/MWCNT array composite. (b), (c) Structure of the picric acid and sodium azide mixture after being mixed and evaporated. (d) Structures of the picramide/sodium azide/MWCNT array composite. (e), (f) Structure of the picramide and sodium azide mixture after being mixed and evaporated.
Download figure:
Standard image High-resolution image
Figure 9. Raman spectra of the picric acid, sodium azide, and the picric acid (P.A.)/sodium azide (S.A.) mixture. Two new peaks were observed in the spectrum of the P.A./S.A. mixture.
Download figure:
Standard image High-resolution image
Figure 10. Structural changes of the chemical fuel mixtures in picric acid/sodium azmide. (a) Chemical structures of picric acid/sodium azide and sodium 2,4,6-trinitrophenolate/hydrogen azide after exchanging Na+ and H+. (b) Schematic of chemical structure of 2,4,6-trinitro sodium phenoxide. (c) Schematic of π-π stacking in 2,4,6-trinitrophenolate/hydrogen azide. SEM image shows a fiber-like structure from π-π stacking after the evaporation of solvents.
Download figure:
Standard image High-resolution image
Moreover, the SEM images of the picric acid/sodium azide and picramide/sodium azide mixtures confirm the transition of the structures of the mixtures from randomly dispersed ones to aligned fiber-like ones structures after the wet impregnation process; this is attributable to benzene stacking, as shown in figure 10(c). The benzene π-stacking structure, which replaced the hydroxide group [21], promotes the hydrodynamic self-alignment of the picric acid/sodium azide mixture during the liquid evaporation process (see online supplementary figures S1 and S2). Further, the mixing of picric acid and sodium azide induces the specific fiber-like shape of the crystals, owing to π-π benzene stacking (figure 10(c)). The difference in the polarities of picric acid (2,4,6-trinitro phenol) and the newly formed 2,4,6-trinitro sodium phenoxide leads to stronger benzene stacking, which promotes the continuous stacking of the chemical fuels, in contrast to what is noticed in the case of picric acid alone. In the aqueous solution, Na+ ions form coordinative bonds with the unshared electron pairs of the oxygen atoms of the nitro group and the phenol group from which the H+ ions have separated (figure 10(b)). At this stage, the Na+ ions form eight coordinative bonds, four of which are with the nitro group while the remaining four are with picric acid molecules. Because O− (from the phenol OH group) has two unshared electron pairs, each picric acid molecule bonds with two sodium atoms and forms continuous bonds with the neighboring molecules as well. In such a bonding structure, the distance between the benzene rings is 3.7–5 Å, which is enough to lead to π-π stacking owing to van der Waals forces [22] (figure 10(b)). Owing to the formation of continuous stacking structures because of ionization and the formation of coordinative bonds [23], the π-π stacking results in a chemical fuel with a more aligned structure. Further, because of the continuous stacking, the picric acid and sodium azide mixture in the aqueous solution exhibits a one-dimensional cylindrical shape, which results in faster combustion than that in the case of the mixture of picramide and sodium azide. As a control experiment, a mixture of picric acid and sodium azide in an aqueous solution was evaporated in the absence of confining nanostructures. In this case, a one-directional structure was observed, as shown in online supplementary figure S1. Again, after the wet impregnation process, fiber or rod-like structures were formed owing to the strong benzene stacking in the picric acid/sodium azide mixture. In contrast, such structures were not noticed in the case of the picramide/sodium azide mixture (figure 8(e)). Moreover, the interaction between CNTs and the chemical fuels was investigated, whether it was physically or chemically contacted. The wet impregnation method was based on the capillary force among the individual CNTs and FT-IR spectra did not show the specific chemical interaction (see online supplementary figure S3). This result confirms that the change of chemical composition of fuels, and the physical interaction such as thermal transports would only contribute to the energy generation from thermopower waves.
The two above-described chemical and structural changes that occur in the chemical fuel mixtures result in an acceleration of the chemical reaction as well as the amplification of the voltage generated by the thermopower waves. The one-dimensionally aligned structures allow for more effective thermal energy transfer with the microstructures of the chemical fuels, because the number of grain boundaries that cause heat loss is lower than that in the case of randomly dispersed structures. Further, the aligned structures transfer the produced energy to the neighboring structures more effectively. The size of a single layer of picric acid/sodium azide was 20–40 μm, while it was 3–10 μm for picramide/sodium azide (figure 8). More effective heat transfer within the chemical fuel results in a higher reaction velocity. This effectively maintains the temperature difference between the reaction front and the region where the reaction is not yet taking place, without there being an inverse temperature gradient in the MWCNTs. However, the picramide/sodium azide mixture did not exhibit structures that could increase the difference in the polarities. Further, its structures were randomly oriented and irregular. Thus, they did not accelerate the reaction, in contrast to what was noticed in the case of picric acid/sodium azide. Moreover, the new chemical fuel, which was composed of 2,4,6-trinitro sodium phenoxide and hydrogen azide (H-N3) tends to have its negative enthalpy of formation, which amplifies the combustion than that of the original picric acid (2,4,6-trinitro phenol)/sodium azide (NaN3) mixture. This change in the fundamental properties, including the chemical composition, of the chemical fuel manages the energy required to maintain the chain reaction along the fuel layers and results in more effective energy transfer with the hybrid composite consisting of the chemical fuels and the MWCNT array. Finally, it also increases the voltage generated from the thermopower waves.
Investigations of the structures and morphologies of the aligned MWCNT arrays after the chemical reaction to generate the thermopower waves revealed differences between the respective combustion processes corresponding to the picric acid/sodium azide and picramide/sodium azide mixtures. Most of the MWCNT array survived the reaction and were probably suitable for reuse to generate thermopower waves. However, even though this was true for both fuel mixtures, the MWCNTs were in distinctly different states, as can be seen from online supplementary figures S4(a) and (b). In the case of the picric acid/sodium azide mixture, the MWCNT array exhibited a greater degree of misalignment, owing to the more explosive nature of the combustion reaction; in the case of the picramide/sodium azide mixture, the array almost maintained its well-aligned structure. This phenomenon again might be attributable to the fundamental difference in the chemical compositions of the two mixtures, which dominates the overall combustion process at the interfaces between the chemical fuel and the MWCNT array.
4. Conclusions
In summary, we demonstrated that the composition of the chemical fuel used to generate thermopower waves has a significant effect on their overall characteristics, even when identical nanomaterials are used as the core thermoelectric material. A centimeter-scale array of vertically aligned MWCNTs was synthesized, and two different fuels, picric acid and picramide, were coated on the surfaces of the MWCNTs by the wet impregnation process; sodium azide was used as the initiator. The maximum peak voltage (∼2 V) and average peak specific power (15 kW kg−1) obtained using the picric acid/sodium azide/MWCNTs composite were higher than those reported previously for thermopower waves generated using CNTs. The difference in the compositions of the picric acid/sodium azide and picramide/sodium azide mixtures resulted in significant differences in the physical characteristics of the thermopower waves generated using the respective mixtures, including in the chemical reaction velocity and the voltage generated during the combustion process. The average reaction velocity and voltage generated using the picric acid/sodium azide mixture were 25 cm s−1 and 157 mV, respectively, while they were 2 cm s−1 and 3 mV, respectively, for the picramide/sodium azide mixture. These astonishing differences are attributable to the changes induced in the composition of the chemical fuels after they are mixed with sodium azide and the aligned structures that are formed after the mixing process. In case of the picramide/sodium azide mixture, no new compounds or aligned structures were formed after the mixing process. On the other hand, mixing picramide and sodium azide in deionized water resulted in the formation of 2,4,6-trinitro sodium phenoxide and hydrogen azide (H-N3), owing to the exchange of H+ and Na+ ions, as well as the formation of one-dimensionally aligned cylindrical structures, because of benzene π stacking. The negative enthalpy of formation of the new chemical compounds and the one-dimensionally aligned structures of the fuels accelerate the reaction and increase the output voltage generated simultaneously from the thermopower waves in the case of the picric acid/sodium azide/MWCNTs composite. Understanding and optimizing the chemical fuel composition and its alignment in nanostructured materials will provide valuable insights into ways of controlling the combustion process and the energy generated from the thermopower waves in nanostructured materials. It should also lead to new applications of thermopower waves as an energy source on multiple scales.
Acknowledgment
This work was supported by the Basic Science Research Program of the National Research Foundation of Korea (NRF), which is funded by the Ministry of Education, Science and Technology, Korea (NRF 2013R1A1A1010575).
Author contributions
All the authors contributed to the manuscript. Further, all the authors participated in the design of the experiments and in data analysis and have approved the final version of the manuscript.