Abstract
Characterized not just by high Mach numbers, but also high flow total enthalpies—often accompanied by dissociation and ionization of flowing gas itself—the experimental simulation of hypersonic flows requires impulse facilities like shock tunnels. However, shock tunnel simulation imposes challenges and restrictions on the flow diagnostics, not just because of the possible extreme flow conditions, but also the short run times—typically around 1 ms. The development, calibration and application of fast response MEMS sensors for surface pressure measurements in IISc hypersonic shock tunnel HST-2, with a typical test time of 600 μs, for the complex flow field of strong (impinging) shock boundary layer interaction with separation close to the leading edge, is delineated in this paper. For Mach numbers 5.96 (total enthalpy 1.3 MJ kg−1) and 8.67 (total enthalpy 1.6 MJ kg−1), surface pressures ranging from around 200 Pa to 50 000 Pa, in various regions of the flow field, are measured using the MEMS sensors. The measurements are found to compare well with the measurements using commercial sensors. It was possible to resolve important regions of the flow field involving significant spatial gradients of pressure, with a resolution of 5 data points within 12 mm in each MEMS array, which cannot be achieved with the other commercial sensors. In particular, MEMS sensors enabled the measurement of separation pressure (at Mach 8.67) near the leading edge and the sharply varying pressure in the reattachment zone.
Export citation and abstract BibTeX RIS
1. Introduction
Hypersonic flow fields are almost always encountered in modern space missions and missile programs; with the interest in the concept of supersonic combustion (SCRAMJET) engines, more complex and challenging research problems have arisen in hypersonic flow research. The word 'hypersonic' qualifies essentially a flow whose kinetic energy is comparable to the dissociation energy of the flowing gas itself; a prospect highly common at very high flow Mach numbers. The simulation of hypersonic flow thus requires not just the simulation of high Mach numbers, but also the simulation of high flow total enthalpies. The continuous ground test facilities are largely limited by the need to withstand high thermal loads for longer durations. Hence, the hypervelocity flows— including high total enthalpies—are simulated in short test duration impulse facilities like shock tunnels [1]. Typically, shock tunnels simulate the required hypervelocity flow for ~1 ms. This restriction on the test time, added to the possible extreme flow conditions and variations due to shock dominated phenomena, imposes limitations and interesting challenges on the implementation of flow diagnostics. Velocimetry, which is very common in continuous facilities, is rarely implemented in shock tunnels. Anemometers have never been employed for shock tunnel studies; while there are few recent reports on application of particle image velocimetry (PIV) in shock tunnels, PIV is yet far from matured as a standard shock tunnel measurement technique [2, 3].
The most commonly employed diagnostics in a shock tunnel include surface measurements of pressure, temperature/heat transfer [4, 5] and skin friction (using Reynolds analogy) [6] on the models placed in the freestream, measurement of forces and moments using balances [7], qualitative visualizations of the flow field by the use of high density gradients (schlieren and shadowgraph techniques) [8] and density field visualization and quantifications using interferometry [9, 10]. Quantitative inferences from extended schlieren/shadowgraph techniques such as colour schlieren and background oriented schlieren [3] are recently developing. Field measurements of temperature and species in shock tunnel flows using LIF and PLIF are also reported in the literature [11].
Surface pressure measurements provide crucial aerodynamic information, not just because their distribution can allow for the calculation of aerodynamic forces and moments- especially since the drag in high speed flows are largely due to pressure distribution, in the form of wave drag—but also because the temporal behaviour of pressure is essential for the study of flow unsteadiness which affects the aerodynamic as well as structural aspects. Accordingly, in order that these fluid dynamic issues are resolved within the short run times of shock tunnels, the response of the pressure sensors must be fast; the sensors must as well withstand the expectedly harsh flow conditions and gradients [12]. Commercially available fast response piezo-electric PCB sensors and piezo resistive kulite sensors are commonly used in shock tunnel measurements [13, 14]. Often a spatially well resolved distribution of surface pressure is required to understand the flow field, which cannot be achieved by commercial sensors since they occupy considerable area on the model surface; further, mounting the commercial sensors also requires considerable thickness of the model walls whose size is limited by the tunnel dimensions. Pressure sensitive paints (PSP) have been promising in measuring the surface pressure distribution for high speed wind tunnel flows [15, 16]. Though over the recent years efforts are underway to implement PSP for shock tunnel flows, limitations in terms of response time, intensity of luminescence emitted by paint, sensitivity, response to temperature and dynamic calibration requirements are to be addressed to standardize the technique [15, 17].
One such case requiring resolved pressure measurements in intricate locations is the (strong) shock wave boundary layer interaction [18] which often occurs in high speed flow fields, where there are a significant spatial variation of surface pressures, particularly in regions of flow separation and reattachment; the variations are expectedly more pronounced at hypersonic Mach numbers with stronger shocks. Of particular importance in hypersonic speeds is the interaction of the ramp shock impinging on the cowl plate at off design (higher Mach number) conditions; such interaction is close the leading edge, where on the one hand large spatial variations are expected and on the other hand the plate thicknesses are not usually sufficient in test models to incorporate commercial sensors. There are few shock tunnel experiments in the literature on hypersonic interactions [19–21] (over a compression corner, rather than impinging shock interactions), which emphasize the requirement of spatially resolved pressure measurements; but none of them address (especially the impinging shock) interactions close to the leading edge, as may be expected of intakes. Sriram (2014) [14] initiated a shock tunnel study on strong impinging shock boundary layer interactions near the leading edge; with flow separation very close to the leading edge (expectedly laminar separation) and separation bubble length comparable to the distance of shock impingement from the leading edge, termed large separation bubble. The study of such separation bubbles, simulated within the short runtime, inevitably requires pressure measurements with good spatial and temporal resolution, and measurements near the leading edge.
Micro electro mechanical systems (MEMS) have provided miniaturized solutions for various applications. MEMS based sensors have proved to be versatile, highly sensitive, and cheap in terms of cost and power consumption, and can be envisaged as a solution for closely spaced pressure measurements. A variety of MEMS based pressure sensors with varying principles of operation are reported for different ranges and applications in the open literatures [22, 23]. There are reports on the application of MEMS based pressure sensors in low speed wind tunnels; particularly miniature high resolution piezo resistive MEMS sensors of high sensitivity, capable of measuring few hundred Pascals of surface pressure, were developed by Berns et al [24]. The sensors can be flush mounted on surfaces which also gets rid of the frequency damping and reflection due to tubing in the case of pin-hole methods of surface pressure measurements which are conventional in low speed flows, especially for increased spatial resolution of pressure measurements. Subsequently Berns et al [25] employed the MEMS pressure sensors for the time-resolved measurements of the complex unsteady flow field around wall mounted finite cylinder. The use of such miniature sensors for spatially and temporally well resolved pressure measurements on the surface of inlet guide vanes in a transonic compressor has also been reported in the literature [26]. The good spatial and temporal resolutions and the possibility of measuring low surface pressures of few hundred Pascals make MEMS pressure transducers a suitable diagnostic for shock tunnel flow fields. However there are no reports in the literature on shock tunnel measurements using MEMS sensors. The short test times and the wider range of surface pressures that may be encountered in shock tunnel flows, especially those involving shock-boundary layer interactions, should be considered in the design of MEMS sensors for shock tunnel applications. This paper presents the development and application of fast response MEMS pressure sensors, which are placed in arrays (each of 5 sensors within a distance of 15 mm), for surface pressure measurements in the hypersonic impinging shock boundary layer interactions near the leading edge, at freestream Mach numbers 5.96 and 8.67 (at total enthalpies 1.3 MJ kg−1 and 1.6 MJ kg−1 respectively) simulated in IISc hypersonic shock tunnel HST-2.
2. Shock tunnel facility HST-2
HST-2 is a conventional shock tunnel facility [14, 27], with a 50 mm diameter shock tube of 2 m driver and 5.12 m driven sections separated by a metal diaphragm. Instantaneous rupture of the diaphragm due to the driver pressure (He at around 42 bar in the present study) creates a shock propagating through the driven section (with air at 0.5 bar as test gas). At the end of the driven section the shock reflects. Thus the test gas is compressed by the onward propagating as well as the reflecting shocks to higher temperature (thus simulating the required total enthalpy) and pressure which serves as the reservoir for the tunnel flow. The compressed gas is allowed to expand through a nozzle into the test section whose area ratio simulates the required Mach number in the test section (of area 300 mm × 300 mm). In the present study two different Mach numbers are simulated: 5.96 and 8.67.
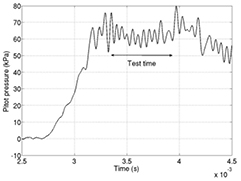
The driven section of the shock tube is equipped with two PCB pressure transducers near the end, which serves to measure the total pressure after shock reflection, and the speeds of onward and reflected shocks from which the total temperature is estimated. A pitot probe equipped with a PCB sensor is placed in the test section which serves to measure the total pressure after the normal shock in the freestream. From the pitot pressure and the reservoir total pressure measured in the shock tube, the freestream Mach number M∞ and other freestream conditions (static pressure p∞, static temperature T∞, Reynolds number per unit length Re∞ and specific total enthalpy h0) are estimated, which are given in table 1. The pitot also serves to indicate the flow test time (when the signal remains steady after initial rise), which is ~600 μs, as may be inferred from the typical pitot signal shown in figure 1 (from ~3300 μs to 3900 μs, which shall be referred for test time when discussing surface pressure signals later); the value of pitot pressure is the averaged value during the test time. Through the ports in the tunnel the cables from the sensors are taken to the data acquisition system (National Instruments, of 1 mega sample/second acquisition rate).
Table 1. Freestream conditions.
| M∞ (±3.2%) | P∞ (Pa) (±4.4%) | T∞ (K) (±4.4%) | Re∞ (x 106 m−1) (±8.3%) | h0 (MJ kg−1) (±3%) |
|---|---|---|---|---|
| 5.96 | 1277 | 160 | 4 | 1.3 |
| 8.67 | 179 | 99 | 1.67 | 1.6 |
Figure 1. A pitot pressure signal (for M∞ = 5.96, Re∞ = 4 × 10⁶/m, h0 = 1.3 MJ kg−1) [27].
Download figure:
Standard image High-resolution image3. MEMS pressure sensor array
A widely used type of MEMS sensor consists of a diaphragm which deflects when pressure is incident on it; this deflection is converted to readable output based on the principle of the sensing element, either piezoresistive or capacitive. The MEMS sensors developed for the present study are of the piezoresistive type, which works on the principle of piezoresistance, i.e. the change of resistivity of a conducting material due to applied mechanical stress. In comparison with capacitive sensors, piezoresistive sensors have advantages due to simple signal processing and very good linearity [28]. The piezoresistive silicon pressure sensors typically consist of a square or circular diaphragm with four p-type piezoresistors connected to form a Wheatstone bridge [29]. The piezoresistors can be arranged in parallel and perpendicularly to the edge of the diaphragm to make use of the longitudinal and transversal piezoresistive effect [29–31]. Pressure sensors presented here are of square diaphragm because of its higher sensitivity as compared to circular diaphragm with similar thickness t and a diameter d equal to the side length a of the square diaphragm. It has also been well established that maximum mechanical stress at the edge of the square diaphragm is a good indicator of the sensitivity of a pressure sensor [30]. Bhat et al [32] designed and developed micro-machined piezoresistive MEMS pressure sensors for aerospace applications, for two different pressure ranges, 1.2 bar and 400 bar; a detailed finite element analysis (FEM) was presented, which provide the guidelines for the (square) diaphragm dimensions and optimal location of piezo–resistors for best performance over the wide range of pressures. Thinner diaphragms (25 μm thick 1 mm long diaphragms for the pressure range 1.2 bar) are found to be suitable for lower pressure ranges, when the maximum stress is found to occur at the diaphragm edge, based on FEM, where the piezoresistor may be incorporated. In the present work, similar sensors have been designed, fabricated and packed in arrays to suit the dynamic experimental conditions, spatial resolution and the range of pressures required to be measured in the short duration shock tunnels.
Closely spaced pressure measurement is among the main requirements and hence the dimensions of the sensors must be as small as possible. It is desirable that the pressures are measured between points separated by not more than a few millimetres (say, around 3 mm), which are not achievable using the other commercially available sensors used in the study (which also serves the purpose of comparison). Hence the square sensing element (diaphragm) must also be as small as possible, with the side lengths in sub-millimetre range. The dimension of the sides of the square is chosen to be 500 μm for the present sensors. The pressure sensor of dimension 1600 μm length, with 400 μm thick, with the diaphragm of 500 μm length at the centre and thickness of 10 μm as shown in figure 2, is made using standard Si wafer. For the pressure sensors of range 1.2 bar, with square length of 1 mm and thickness of 25 μm, Bhat et al [32] have demonstrated good linearity for even such low pressures as few millibars as may be expected in certain regions in shock tunnel flow field; their calibrations showed that the maximum nonlinearity and hysteresis was found to be within 0.5% Full Scale Output. However, since the length of diaphragm is shorter in the present study, it must accordingly be thinner for better sensing at low pressures. The minimum possible thickness of 10 μm (based on fabrication constraints) is chosen. For these dimensions, preliminary studies on the response of the diaphragm for a given pressure were performed using the commercial software CoventorWare™ (2010 FEM), numerically simulating the stress patterns on the diaphragms for the design thickness, but also for different thickness (5 to 25 µ) with pressure ranging from 0 to 1 bar for comparing the sensitivity of the sensor for pressure range of interest; the simulations indicated good linearity even at pressure ranges of the order of 1 mbar.
Figure 2. Schematic of the MEMS pressure sensor.
Download figure:
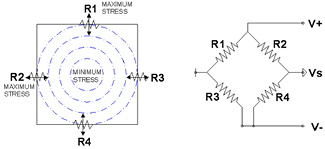
Standard image High-resolution imageAs suggested by Bhat et al [32], the polysilicon piezoresistors are placed at the edges of the diaphragm where maximum stress is seen. A schematic of the placement of the resistors on the sides of the square diaphragm is shown in figure 3. When pressure is applied to the diaphragm, resistors R1 and R4 become wider, experiencing reduction in resistance; and R2 and R3 become longer, experiencing increase in resistance. The piezoresistors are configured in a Wheatstone bridge; two lead wires are meant to provide (3 V) excitation voltage Vs and the other two wires would carry the differential output signal V+ − V− of the bridge which is proportional to measured pressure. The fabrication of the array of sensors is subsequently detailed.
Figure 3. Schematic of the sensor with resistors (left), which are configured in a Wheatstone birdge (right).
Download figure:
Standard image High-resolution image3.1. Fabrication of the MEMS pressure sensor
MEMS pressure sensors were fabricated (at SCL Chandhigarah) using bulk micromachining technique with high resolution etching and tight dimensional control due to the anisotropy of silicon. The fabrication process used to build the MEMS pressure sensors is shown in figure 4(a). A double side polished n-type silicon (100) of thickness 675 µm was used as substrate material. Initially the substrate is oxidised on both the sides, and the active resistor area where maximum stress is created is etched out. Polysilicon piezoresistors are implanted using ion implantation on the n-type silicon wafer at the four edges of the die. The metal contacts are provided for the resistors using by deposition to form a Wheatstone bridge. The top layer is passivated by oxidation. The bottom of the die which was initially oxidized is patterned to form the dimensions of the diaphragm. Anisotropic wet etching using KOH is done to the patterned opening to create a 10 µm thick diaphragm. The five bonding pads on the frame are used to connect the Wheatstone bridge to outside by wire bonding for power supply and signal output connections. Then anodic bonding of Si-glass is carried out by creating vacuum at the bottom.
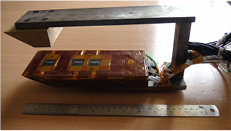
Figure 4. (a) Details of the process steps used for the fabrication of MEMS pressure sensor. (b) The fabricated pressure sensors. The figure on top shows a single pressure sensor, and the packaged sensor array is shown below.
Download figure:
Standard image High-resolution imageThe single sensor fabricated is shown in figure 4(b) (top). An array of these single fabricated sensors are created using suitable bonding material and the packaged sensor is filled with potting compound to fill the gap between the sensors and package. Further smooth finish is obtained by curing process. Sensor array was achieved by dicing individual sensor dies and bonding them on to a printed circuit board (PCB) of 40 mm × 100 mm size in 5 rows and 1 column. Then potting compound is applied on to spaces in between the sensors and cured to form a 5 × 1 sensor array as shown in figure 4(b) (bottom). The details of the calibration of the sensors are presented subsequently.
3.2. Calibration of the developed sensor array
The static calibration test setup essentially consists of hermetically sealed chamber, pressure controller, source pressure, vacuum pump and data acquisition system (digital multimeter) [32]. The desired pressure is set in the chamber through the pressure controller. Excitation voltage of 3 V is applied to each sensor from the constant power supply, and the corresponding output voltage for the set pressure is measured using the digital multimeter. From the calibration data, both in increasing and decreasing steps of pressure, full scale output (FSO), zero offset, non-linearity, hysteresis and sensitivity are evaluated. Figure 5 shows a calibration curve for some of the sensors in an array.
Figure 5. The calibration curves for a few sensors in an array.
Download figure:
Standard image High-resolution imageIt was observed that the sensor response was linear in the targeted pressure range and the estimated sensitivity was about 30–40 mV/bar (different values for different sensors). Although the present calibration is done only for a minimum pressure of 100 mbar (which is roughly the pitot pressure at Mach 8), the prior simulations suggest good linearity even at lower pressures of few millibar; the detailed calibration for similar, but thicker sensors by Bhat et al [32] also indicate good linearity at millibar pressures, as discussed earlier. It shall be shown in later sections the MEMS pressure signals for lower pressure ranges, with the above sensitivity values deduced till 100 mbar pressure, compared well with the pressure measurements using other sensors at same location in the shock tunnel flow field. Dynamic response of the pressure sensor was tested using balloon bursting method [32]. The response time of the present MEMS pressure sensors is found to be comparable with the other commercial sensors used in the present study. The shock tunnel measurements of surface pressure using MEMS sensors shall be subsequently detailed.
4. Shock tunnel experiments
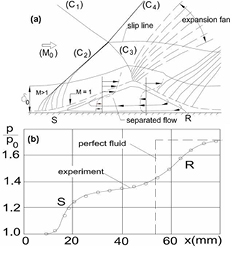
The flow field being investigated is the strong (impinging) shock boundary layer interaction near the leading edge. It is useful to briefly describe the flow field [18], whose schematic is given in figure 6. When the impinging shock C1 is of sufficient strength, the boundary layer separates due to the imposed adverse pressure gradient by the shock at the point S, accompanied by separation shock C2 (formed by coalescing of compression waves emanating from inside the boundary layer from above the sonic line). The shock C1 after interacting with the separation shock impinges on the separated shear layer, reflecting as expansion fan and turning the separated shear layer to reattach at R.
Figure 6. Schematic of the impinging shock boundary layer interaction with separation [18]: (a) view of the flow field, (b) surface pressure distribution.
Download figure:
Standard image High-resolution imageThe reattachment is accompanied by the formation of compression waves which coalesce downstream forming the reattachment shock. Correspondingly there are two pressure rises, one due to separation and the other at reattachment (where the peak surface pressure may be expected). It may be noted that the pressure rises are not very sharp; but takes a finite distance (however small depending on flow conditions) due to sequence of compression waves rather than shocks.
In hypersonic flows the coalescence of compression waves is usually rapid and hence the rises could be steeper. The regions of pressure rises thus require a careful attention and better resolution. Further since the shock strengths are higher in hypersonic flows the ranges of pressures to be measured from the onset of the interaction to the end of the interaction could differ in orders of magnitude. With these considerations the shock tunnel experiments are designed. The study specifically addresses strong shock interactions close to the leading edge. The flow field is investigated by means of time resolved schlieren flow visualizations using a high speed camera (Phantom V-310, operated at 10 000 frames s−1) and the fast response sensors. A description of the test model (incorporating the sensors) for the investigation and the simulated flow field are presented subsequently.
4.1. Test model
The impinging shock boundary layer interaction is made to occur on a flat plate made of Hylem. The schematic of the model with the holding arrangement, for the simulation of impinging shock boundary layer interaction in HST-2 (whose dimensions are chosen based on the constraints of blockage in the test section and the internal blockage considerations [14]), is shown in figure 7.
Figure 7. Schematic of the test model [27].
Download figure:
Standard image High-resolution imageThe strong shock generated by a wedge (shock generator) of angle 30.96° to the freestream is made to impinge on the flat plate; the location of impingement can be varied by moving the flat plate (whose surface is 60 mm below the bottom of the wedge) forward/backward on the model fixture which holds the plate and the wedge [27]. In the experiments presented here, the leading edge of the plate is kept 10 mm behind (in the downstream direction) the leading edge of the shock generator. The span of the interaction is 60 mm.
Surface pressures are measured using (sparsely placed) commercial sensors—PCB and kulite sensors—and the in-house made MEMS sensors in closely packed arrays (or clusters). Different flat plate models (of 80 mm span) are used, incorporating different surface mounted sensors for pressure measurements [14]. A photograph of the flat plate with flush mounted MEMS sensor clusters (three clusters with five sensors each) is shown in figure 8; a photograph of the MEMS model mounted on the fixture along with the wedge is shown in figure 9. The MEMS arrays are placed in the slots milled on the model surface, such that the MEMS sensors are at the (spanwise) centreline of the model in flush with the surface. The surfaces and step are given smooth finish to avoid any disturbances to the flow. The wires from the MEMS sensors are taken through channels cut through the model to the ports in the tunnel, which connects to the data acquisition system and the power supply outside.
Figure 8. A photograph of the flat plate model with flush mounted MEMS sensors.
Download figure:
Standard image High-resolution imageFigure 9. Photograph of the test model mounted in the fixture.
Download figure:
Standard image High-resolution imageThe location of MEMS sensor arrays were decided after prior measurements using commercial sensors, in order that important regions requiring resolution are identified; at certain locations the signals from PCB and kulite sensors are used as benchmark and are compared with the signals from MEMS sensors. A description of the flow field indicating the important regions is presented subsequently.
4.2. Flow field
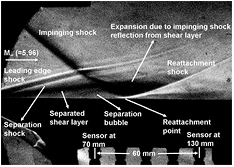
A schlieren image of the flow field during the test time at Mach 5.96 with inviscid shock impingement location (estimated from Euler computations) at 95 mm from the leading edge is shown in figure 10 [27]. The various features of the interaction are labelled (the schlieren can be compared with the flow schematic in figure 6). A number of features are noteworthy. The impinging shock being strong, the separation bubble is seen 'biased upstream of impingement' as predicted by the numerical simulation of Krishnan et al [33]. Importantly, the separation (as apparent from the separation shock) is close to the leading edge.
Figure 10. Schlieren image of the interaction at Mach 5.96 with inviscid shock impingement at 95 mm from the leading edge [27].
Download figure:
Standard image High-resolution imageSince the separation occurs close to the leading edge in the considered cases, where the boundary layers are thin, the upstream influence lengths (distance from the separation location to the upstream point where the rise in pressure due to the interaction is felt) are negligibly small compared to the separation length (distance from separation to reattachment). Thus from the practical view point of the estimation of separation length, the separation point can be taken as the point where the separation shock intercepts the plate surface [14]. Thus for the case at Mach 5.96 shown above the separation location is found to be 15 mm from the leading edge. Concerning the reattachment, it is seen that the starting of reattachment shock near the plate surface at around 85 mm from the leading edge (can be compared with the position of the PCB sensor at 85 mm in the figure 10) is almost parallel to the surface for nearly 7–8 mm. A comparison of PCB and kulite pressure signals at 85 mm from the leading edge (from different experiments, with other conditions remaining the same) is shown in figure 11(a); a comparison of the signals at 100 mm is given in figure 11(b).
Figure 11. Pressure measurements in the vicinity of reattachment at Mach 5.96 (a) at 85 mm from the leading edge, (b) at 100 mm from the leading edge.
Download figure:
Standard image High-resolution imageWhile the signals at 85 mm are unsteady during the test time with large fluctuations, the signals at 100 mm are quite steady (and comparable with both PCB and kulite sensors). Further, amplitude of the unsteady pressure signals at 85 mm are much higher with PCB sensors than with the kulite sensors; understandably this is due to the larger sensing area of the PCB sensor (of 5.5 mm diameter) than the kulite sensor (of 1.5 mm diameter) which would have had the PCB sensing higher pressures downstream of its centre. Clearly the location of peak pressure (and reattachment) is between 85 mm to 100 mm from the leading edge, and this needs to be resolved. The diameters of the PCB and kulite sensors place a limitation on the closeness of the sensor mounting; in case of kulites, it needs a mounting arrangement (adapters) [14] in the model due to which the best inter-sensor spacing possible is ~8 mm.
The flow field is qualitatively similar at Mach 8.67; except that the impinging shock is more inclined to the wedge due to which (the relative positions of the plate and the wedge being same) the inviscid location of impingement is little downstream compared to the Mach 5.96 case, at 100 mm from the leading edge. Accordingly the reattachment was also apparently downstream at ~100 mm from the leading edge in the schlieren. The separation (located from the intercept of the separation shock on the plate surface) is found to occur at 38 mm from the leading edge. Thus the apparent separation length is substantially smaller at Mach 8.67; which is understandable, since at higher Mach numbers the sonic line in the boundary layer is closer to the wall and hence the upstream influence length is lesser and the boundary layer is more resistant to the imposed (adverse) pressure by the shock. With the thickness of the MEMS cluster, it is possible that the region around separation can be resolved at Mach 8.67; it is however, still difficult at Mach 5.96 when the separation is very close to the leading edge (at 15 mm). In any case the surface pressure variation in the reattachment zone needs to be spatially resolved; which is also required for being precise in the location of peak pressure (and reattachment). The subsequent section describes the resolution of these issues by the measurements using MEMS sensors.
5. Measurements using MEMS sensors and discussions
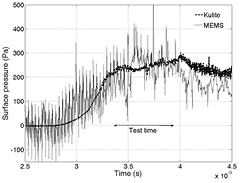
Comparison of measurements using MEMS sensors with the measurements using commercial sensors (especially kulite with better signal to noise ratio) with tested response in shock tunnel can double the role of dynamic calibration. In order that the comparison is demonstrated in the worst case scenario, the measurement of the lowest pressure in the present experiments—the surface pressure at Mach 8.67 (without impinging shock), comparable to the freestream pressure of ~179 Pa—is considered; a comparison of MEMS and kulite (raw) signals is shown in figure 12. It is apparent that the signals are qualitatively (and to a first order, statistically) comparable. However, the signal with MEMS sensor is seemingly noisier.
Figure 12. Comparison of surface static pressure signals from kulite and MEMS sensors at Mach 8.67 (without impinging shock).
Download figure:
Standard image High-resolution imageIn order to understand the noise in the signal the power spectral densities (PSD) of the MEMS signal during the test time and in the base line before the flow starts are compared, as shown in figure 13. It is clearly seen that the local peaks at higher frequencies in the base line starting from (30 kHz) are also seen in the test time portion of the signal.
Figure 13. Comparison of power spectral densities of MEMS pressure signal at Mach 8.67 (without impinging shock) during test time and base line.
Download figure:
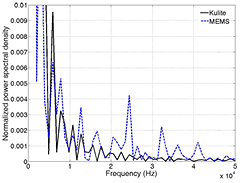
Standard image High-resolution imageIn fact, the high frequency components in the base line was observed (in the power spectral densities) in all experiments with MEMS, and hence should be due to the electronics and circuits associated with the power supply and amplification for the MEMS sensors. The amplitudes (of PSD) of the base line in the kulite sensors on the other hand were negligibly low for all frequencies, in comparison with that of MEMS sensors (as could be understood from the signals themselves shown in figure 12). Of interest during test time is thus the frequencies below 100 kHz which have prominent amplitude for the MEMS signal. A comparison of normalized power spectral densities (normalized using the peak amplitude at 0 Hz) during the test time of the kulite and MEMS signals at Mach 8.67 (without impinging shock) is given in figure 14. There is a good correspondence between the local intensity peaks up to ~13 kHz; after that the amplitudes of kulite signal drastically dies down, whereas there are considerable amplitudes for higher frequencies with MEMS signal. The reason for the high frequency components is thus certainly not from the flow field and hence are filtered using low pass filters (the signals presented subsequently are filtered ones). Thus within ~15 kHz frequency there is a good comparison between the kulite and MEMS signals, and the sensitivities obtained from the static calibration can be sufficiently applied for the dynamic measurements.
Figure 14. Comparison of normalized PSDs of kulite and MEMS signals during test time at Mach 8.67 (without impinging shock).
Download figure:
Standard image High-resolution imageIn the interaction too the measurements using the MEMS sensors showed good comparison with the kulite signals (at similar locations). This is best illustrated in figure 15 comparing the kulite signal at 40 mm from the leading edge and MEMS signal at nearly the same (but a little upstream) location of 38 mm from the leading edge at Mach 5.96; both the sensors are inside the separation bubble (at the nearest possible locations to separation). It can be seen that the pressure signals reach a steady value only by the middle of the test time in these sensors. This is because, though the freestream conditions reaches a steady state as also nearly (statistically) the pressures in the reattachment zone early, (as the separation bubble is large) the separation location is observed—from time resolved schlieren images—to continue moving slightly upstream for 300 μs even after the test time has begun; it is found to settle only by the middle of the test time [27]. This is clearly reflected in both the MEMS and kulite signals, which are seen closely following each other.
Figure 15. Comparison of MEMS and kulite pressure signals inside separation bubble at Mach 5.96.
Download figure:
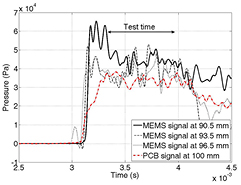
Standard image High-resolution imageThe important contribution of MEMS sensors in the investigation of the interaction was the measurement of the pressures in the reattachment zone. It may be recalled that at Mach 5.96 the unsteady pressures with large amplitude fluctuations were measured by the PCB and kulite sensors at 85 mm from the leading edge, whereas steady signals were measured at 100 mm, suggesting that the reattachment point and (steady) peak pressure may be between these locations as also apparent from visualizations. This is clearly resolved by the MEMS cluster in the zone with closely spaced MEMS sensors. Figure 16 shows the signals from the MEMS sensors in the cluster, also showing the steady pressure signal from the PCB sensor at 100 mm. The MEMS signal at 90.5 mm shows the highest pressure during the test time, with the (average) pressure dropping with subsequent (downstream) MEMS signals to the (average) value read by the PCB sensor at 100 mm. Thus, within a distance of 10 mm there is a drop in surface pressure from around 45 kPa to 35 kPa, due perhaps to the interaction of expansion waves formed by the reflection of impinging shock on the shear layer (as indicated in figure 10), which is resolved by the MEMS sensor array. It clearly suggests that the peak pressure and the reattachment nearly occur at ~90 mm from the leading edge, with peak pressure ~45 kPa. Further these sensors read pressures (in which range the static calibrations are done) which are orders higher than the pressure signals given in figure 12 or 15. These signals are apparently less noisy; or in other words the values measured by the pressure signals are seen to be much higher than the noise.
Figure 16. Comparison of pressure signals in the reattachment zone at Mach 5.96.
Download figure:
Standard image High-resolution imageClearly in the reattachment zone the MEMS sensors have enabled a very good resolution. Even at Mach 8.67 when the reattachment was found to occur at 100 mm from the leading edge, the MEMS sensors helped in ensuring that; the MEMS signals in the zone (till 96.5 mm) read a progressively (and) sharply increasing values, finally culminating in the peak value read by the PCB sensor at 100 mm from the leading edge. Further, at 8.67 the MEMS sensors enabled the measurement of the pressure at the separation location (which was apparent at ~38 mm from the leading edge). In all the experiments the sensor at 38 mm was the closest to the leading edge as mentioned before (while in few experiments a kulite sensor was placed at 40 mm from the leading edge, the protrusion of the sensor and the wire below were exposed to the hypersonic flow due to the lack of sufficient thickness at the location; hence the sensor experienced damages and measurements were not continued with kulites at the location for subsequent experiments). A comparison of the MEMS signals at 38 mm, with and without the impinging shock interaction at Mach 8.67, is given in figure 17. The pressures at the separation predicted by the free interaction theory with both adiabatic (pad) and isothermal (piso) cold wall assumptions [14] are also indicated in the figure. While without the impinging shock the sensor reads (during the test time) slightly higher pressure than the freestream static pressure (as mentioned before), with impinging shock the sensor reads a much higher pressure of ~650 Pa (quite in order with the free interaction theory predictions). The downstream sensors in the same cluster helped in better resolution of the region showing continuous increase in pressure downstream. Thus the MEMS sensors enabled the close resolution of separation and reattachment zones in the impinging shock interactions.
Figure 17. Comparison of surface pressure signals at 38 mm from the leading edge with and without impinging shock interaction at Mach 8.67.
Download figure:
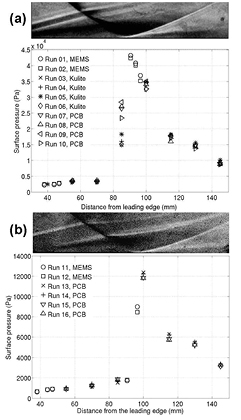
Standard image High-resolution imageA consolidated distribution of surface pressures at Mach 5.96 and 8.67 are given in (figures 18(a) and (b) respectively). Superimposed above the pressure distributions are also the corresponding schlieren images (cropped to appropriate scales) for reference. A good correspondence between the schlieren images and the pressure distribution can be noted; so are the correspondences between the closely pressures measured by the MEMS sensors and the visible regions of separation and reattachment in the visualizations which required resolution in surface pressure measurements. It may be recalled that the reattachment shock is almost parallel to the surface in the reattachment zone for around 7–8 mm (the mid-point of which roughly locates the reattachment) due to which it is not possible to be precise about the reattachment location from the schlieren images; precise peak pressure location helps in improving the precision in the location of reattachment. Thus by resolving the important regions in the flow field, the MEMS sensors not just help in getting resolved pressure distribution, but also in locating with better precision such locations as those of peak pressure (which corresponds to the reattachment location) as well as the separation location.
Figure 18. Surface pressure distribution along the flat plate with impinging shock boundary layer interaction (a) at Mach 5.96 [27] (b) at Mach 8.67.
Download figure:
Standard image High-resolution imageIt must be added that, with the ability to measure wide ranges of pressures in the hypersonic separated flow field even in short duration test facility, the MEMS sensor array can also be employed in long test duration hypersonic wind tunnels, where the array can be useful especially in resolving the low frequency unsteadiness associated with shock boundary layer interactions. However, the noise from the circuit for power supply and amplification must be reduced in order to address such unsteady phenomena.
6. Measurement uncertainties
The uncertainties in freestream conditions, estimated based on the uncertainties in shock tube measurements and pitot measurements, are given in table 1. Based on the data sheets provided for the commercial sensors, the kulite sensors used in the present study have an uncertainty of ±0.5% and the PCB sensors have an uncertainty of ±1%. Concerning MEMS sensors, the static calibration indicated a good linearity; the nonlinearity and hysteresis were within 1%. It must be admitted that the sensors does not include temperature compensation. However, within the short shock tunnel run time, expectedly, the temperature does not raise much for the present study. For higher enthalpies, typically simulated in free piston driven shock tunnels, the temperature variations could be considerable within the run time; the inclusion of temperature compensation is being considered as a future work, for the sensors to be used in higher flow enthalpies.
7. Conclusions
Micro-machined piezo resistive fast response MEMS sensors in closely spaced arrays have been developed for short duration shock tunnel flow field, to measure surface pressures ranging from ~200 Pa to 50 000 Pa, within test time of ~500 μs. Static calibration of the sensors indicated good linearity for pressures ranging from 100 mbar to 1 bar; the sensitivity of the (10 μm thick) sensors ranged from 30–40 mV/bar for 3 V excitation. The sensors were successfully employed to measure the surface pressures in the complex flow field of impinging shock-boundary layer interactions near leading edge at two different freestream conditions of Mach 5.96 and Mach 8.67 (with total enthalpies 1.3 MJ kg−1 and 1.6 MJ kg−1 respectively), involving wide spatial variations in pressure. The sensors were able to measure such low pressures as 179 pa (at Mach 8.67, for the case without impinging shock); the signals from MEMS sensors were found to compare very well with those from commercial pressure sensors placed at same locations. The MEMS sensor array helped in resolving the surface pressures in the region of reattachment where there was rapid spatial variation in the streamwise direction. At Mach 5.96, there was highly unsteady pressure with average value of around 20 kPa at 85 mm from the leading edge, downstream of which a steady peak pressure of ~45 kPa was observed (in the apparent reattachment location) at 90.5 mm from the leading edge; subsequently, within a distance of 10 mm the pressure progressively dropped to ~35 kPa. Thus the resolution of the pressure variation in the reattachment zone by the use of MEMS sensor array not only helped in the precise measurement of peak pressure in the flow field, but also complemented the schlieren visualization in locating the reattachment point. Further, at Mach 8.67, the sensors were able to resolve the pressure at the separation location which was close to the leading edge (38 mm from the leading edge), where it was not possible to mount the commercial sensors due to lack of sufficient thickness.


