


Abstract
This paper presents experimental results that demonstrate the correlation of glucose concentration in water and saline solutions with transmitted electromagnetic (EM) energy in the frequency range of 50–75 GHz. The system is based on placing the aqueous solutions in acrylic holding tanks sandwiched between two open V-band waveguides. The measured samples have clinically relevant range of glucose concentrations, as low as 0.025 wt%. Our measurements show for the first time that it is possible to establish an approximately linear relationship between the signals transmitted through this simple waveguide-based system and the glucose content in the samples. Accurate full-wave EM simulations confirm this linear correlation. The results suggest the possibility of developing a miniaturized non-invasive glucose sensing device based on the transmission of radio waves in this frequency range.
Export citation and abstract BibTeX RIS
1. Introduction
Radio waves that have wavelengths in the millimetre (mm) range, approximately corresponding to frequencies between 40 GHz–100 GHz, are gaining traction and can be found in applications such as short range data communications [1, 2] and automotive radars [3]. Such millimetre waves are also prime candidates for sensing of biological tissues and liquids because of their non-ionising nature, their good penetration depths inside these tissues, and their good resolution due to their relatively small wavelength compared to lower frequency electromagnetic radiation. Despite their promising applications of millimetre waves, measurements in that frequency band remain challenging for two reasons. First, the manufacturing tolerances of the radio frequency components involved are very stringent (often requiring micron-accuracy). Second, the electromagnetic behaviour of materials in that frequency range is not as established as in lower frequency ranges (below 10 GHz). This is particularly true for biological liquids were limited results are available in the literature [4–8].
This work contributes to measurement studies for the dielectric properties of biological liquids in the mm range by presenting dielectric spectroscopy and transmission/reflection measurements of water-based glucose solutions in the 50–75 GHz band. This frequency band is of interest for accurate wireless glucose sensing for two principal reasons. First, the wavelength is short enough to allow the use of antennas which can be only a few millimetres wide and thus appropriate for implementing compact sensing systems. In addition, the skin depth is relatively large (0.5 mm approximately), allowing good penetration through human tissues.
The motivation behind these measurements is to design a sensor that can achieve accurate detection of glucose concentration levels without drawing blood (non-invasively), which is one of the most challenging aspects of diabetes research [9]. Since typical human glucose levels in the blood vary in the range of a few milligrams per decilitre (or millimoles per litre), estimating such small variations requires a very accurate and repeatable sensing method. Among the various candidate technologies, the use of electromagnetic (EM) waves (e.g. optical methods studied in [10–12]) and particularly microwaves has shown promise in detecting changes in the electrical properties of blood plasma as a function of glucose concentration [4, 6, 7, 13–20]. These results have motivated the present study towards the development of a non-invasive glucose monitoring system using the 50–75 GHz mm-wave band.
In order to demonstrate the feasibility of using EM waves in this band to sense variations in glucose concentrations within solutions of water and salt (NaCl), an experimental system has been employed which measures EM transmission and reflection data at 50–75 GHz using open waveguides. This setup is substantially different from earlier studies which have mostly focused on the use of lower microwave frequencies (up to 20 GHz), and employed different setups to measure relatively high glucose concentrations in controlled samples by extracting the sample's permittivity. For example, dielectric spectroscopy was used in [13] to measure blood plasma in the range 0.5–20 GHz, and resonant cavity setups have been employed in [14, 15] operating between 2–3 GHz. Frequency ranges between 1.0–2.5 GHz [16] and 5.0–8.5 GHz [17] have also been used in configurations with antenna sensors. In addition, open waveguide structures have been used to measure the effect of varying glucose concentrations on the waveguide's scattering parameters (S-parameters) for frequencies up to 20 GHz [18]. Higher microwave frequencies have also been studied in [4, 6, 7, 19], but in a different context than in the present work. In particular, [19] considers both reflection and transmission data utilizing various sensing methods, but uses measurements only up to 40 GHz and higher minimum glucose concentrations (down to 0.15 wt% only) compared to the present work.
Only a limited number of experiments have been performed in the 50–75 GHz band [4, 6, 7]. These results have shown a good dependence of the reflection coefficient signal on glucose concentration in saline solutions. However, they did not demonstrate a clear (e.g. monotonic) correlation of the data with glucose content. In addition, these studies considered much higher glucose concentrations (0.5 wt% and 3 wt%) compared to the concentrations considered clinically normal for an average adult human (4 mmol L−1–7.8 mmol L−1 or 0.072 wt%–0.14 wt%). Finally, the findings in these earlier works have not been validated by any theoretical models or EM simulations.
This work demonstrates for the first time a clear correlation between transmission data and glucose concentration in saline solutions in the V-band. The experimental setup features a solution-filled acrylic tank sandwiched between two open rectangular V-band waveguides. The measurements include samples with varying glucose levels for concentrations as low as 0.025 wt%. Based on our experimental findings, it can be argued that the use of transmission instead of reflection data is critical to achieve this clear correlation. Moreover, these results are validated using full-wave EM simulations in this frequency range. This important finding suggests that transmission measurement systems may be necessary to measure accurately the dielectric properties of liquids in the mm-wave frequency range.
The rest of the paper is organized as follows. Section 2 presents the methods used in this work, i.e. the preparation procedure of the aqueous samples, the setup used in the experiments and the measurement process. Section 3 presents the results obtained from the experiment and their correlation with the simulations results. Section 4 presents the conclusions of this study with suggestions for future work.
2. Methods
2.1. Experimental process
To perform the experiments, three sets of liquid samples were prepared: (i) samples with glucose concentrations (C6H12O6, anhydrous D-(+)-Glucose) ranging between 0.025 wt% and 5 wt% in distilled water; (ii) samples with glucose concentrations between 0.025 wt% and 5 wt% in saline solution (0.9 wt% NaCl concentration in distilled water); (iii) samples with NaCl concentrations ranging between 0.05 wt% and 4 wt% in 0.9 wt% glucose concentration in distilled water. The saline solutions were prepared in order to obtain more realistic samples, as in [6]. The samples of varying NaCl concentrations were tested as a control group with the purpose of examining to what extent the collected data are affected by variations in glucose concentration and/or NaCl concentrations.
All the samples were prepared following the procedure outlined below. First, the required amount of glucose and/or salt was calculated using the concentration value (by weight) and the total weight of the sample. Then, salt, glucose, and distilled water were sequentially added into a container, and the contents were mixed using an electric hand mixer (frapediera) until the sample became homogeneous. After preparing each sample, the hand mixer was rinsed with distilled water, then dried and finally cleaned with an alcohol pad in order to prevent contamination between samples. Subsequently, each sample was stored inside a refrigerator at a temperature of 4 °C. Before performing the measurements, all the samples were brought to laboratory room temperature in order to minimize changes in their physical and EM properties due to temperature differences [20]. The temperature of the samples was measured before performing the measurements, as well as at frequent intervals during the measurement process, and was found to remain relatively constant around 25.5 ± 0.2 °C.
As shown schematically in figure 1(a), the experimental setup consisted of two open V-band waveguides (WR-15) and an acrylic tank firmly inserted between them, inside which the liquid samples were placed. The outer dimensions of the tank were 60 mm × 40 mm × 7 mm. The thickness of the acrylic container walls was 3 mm, leaving 1 mm of empty space containing the solutions. Reflection (S11) and transmission (S21) coefficients were measured using a microwave network analyser (Keysight Technologies' N5244A PNA-X). The PNA's frequency range of operation (10 MHz–43.5 GHz) was extended to the desired frequency range of 50–75 GHz using a pair of commercially available millimetre wave extenders (V15VNA2-T/R-A) [21]. These extenders act as frequency multipliers and are connected between the PNA and the waveguides. Note that open waveguides were chosen instead of a pair of antennas in order to simplify the experimental setup and also reduce the complexity in the EM simulations, thereby resulting in fewer discrepancies between the experimental and simulations setups.
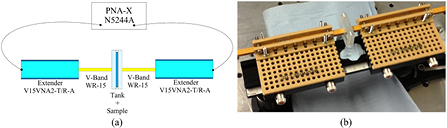
Figure 1. (a) Schematic version of the setup that includes the top view of the tank and the waveguides, the extenders and the PNA-X. (b) Photograph of the experimental setup consisting of the tank, a pair of V-band waveguides and their supporting optical rail fixture.
Download figure:
Standard image High-resolution imageA photograph of the experimental system is shown in figure 1(b). Note that it was necessary to mount the waveguides and extenders on an optical rail system using a set of plastic fixtures in order to ensure good alignment between the waveguides and the tank. The rail system allowed independent movement of each waveguide arm parallel to the waveguide's axis of propagation. This ensured consistent alignment throughout the experimental campaign, and also during the calibration process.
Prior to the measurements, a Thru-Reflect-Line (TRL) calibration process [22] was performed using the V11644A calibration kit. All measurements were carried out using the same tank, which was located in a fixed position once the calibration was completed. The liquid samples were inserted and then removed from the tank using a syringe with an outer diameter of 0.40 mm. The samples were measured in sequence according to their glucose content, starting with samples with lower glucose concentrations in order to minimize possible contamination from higher glucose concentrations. After each set of samples was measured, distilled water was used to clean the tank.
2.2. Debye analysis and simulation setup
EM wave propagation inside water-based solutions experiences dispersion. This dispersion is necessary to be modelled accurately in an EM simulation solver with an appropriate mathematical model that accurately describes the frequency dependence of the microwave properties for these solutions. Other works have used various models to achieve this. For example, a two-pole Debye model was chosen in [23] to describe the dispersive behaviour of pure water in the mm-wave bands. In [24], water-based glucose solutions were modelled with a single-pole Debye equation, but with coefficients that varied linearly as a function of glucose concentration.
In this work, a dispersive model for the glucose solutions was obtained by fitting dielectric spectroscopy measurement data of the non-saline glucose samples (samples consisting of glucose and distilled water only) using the 1.2E DAK probe from Speag and a Vector Network Analyser (E8361A PNA) from Keysight Technologies. The measured samples were the same as the ones used for the main 50–75 GHz measurements. This measurement setup operates accurately for frequencies up to 67 GHz. A different single-pole Debye model [25] was fitted to each sample with different glucose concentration in the frequency range 40 GHz–67 GHz. These models were then extrapolated to higher frequencies (up to 75 GHz) to obtain the permittivity of the samples in the whole V-band.
Two examples of the resulting Debye models are shown in figure 2. This figure presents the real and the imaginary part of two distinct fitted Debye models for two different samples, corresponding to the samples with 1 wt% and 5 wt% glucose concentrations in water. The dots represent measured values with their correspondent error bars (figures 2(b) and (c)), while solid and dashed lines represent the fitted Debye curves against frequency. As mentioned previously, and contrary to previous work which used a single Debye model with coefficients that were linearly dependent on the glucose concentration [24], much better fit to the measured data was obtained for our data by independently extracting one set of Debye coefficients for each different glucose concentration sample.
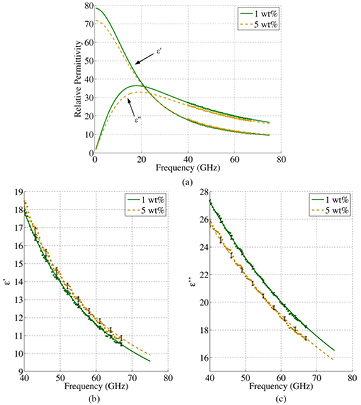
Figure 2. (a) Real and imaginary part of the relative permittivity obtained from the Debye model against frequency for samples with two different glucose concentrations, 1 wt% and 5 wt%. The dots correspond to the experimental measurements performed at 40–67 GHz using the dielectric probe. The solid and the dashed lines correspond to the fitted first order Debye model of the experimental data. The solid line corresponds to the Debye model obtained for 1 wt% and the dashed line corresponds to the Debye model obtained for 5 wt%. figure 2(c) shows a zoomed-in version of figure 2(a) for the real and imaginary part of the relative permittivity, respectively. The error bars shown in these two figures correspond to the standard deviation over multiple measurements performed.
Download figure:
Standard image High-resolution imageUsing our dielectric spectroscopy measurements and the Debye fitting, the variation of the relative complex permittivity as function of glucose concentration at 60 GHz has been plotted in figure 3 (similar plots can be obtained in the whole frequency range under study). This figure suggests that the real part of the relative permittivity increases with concentration while the imaginary part decreases with concentration. This dependence agrees with the results reported in [8] and [5], but not with measurements using a plane-parallel matching plate made of a low-loss dielectric reported in [6], where the real part of the relative permittivity decreases, contrary to our results. In order to reduce the possibility of error in our simulations, only the higher glucose concentrations in the range 1 wt%–5 wt% were used in the simulations presented later in the paper. As it will be shown later, the decreasing value of the imaginary part of the relative permittivity for increasing glucose concentrations is the key factor contributing to the monotonic variation of the transmitted signals.
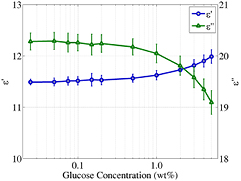
Figure 3. Relative permittivity (imaginary and real part) against glucose concentration at 60 GHz for samples consisting of glucose in distilled water at 23 °C. The data with circular markers correspond to the real part of the relative permittivity and the data with triangular markers correspond to the imaginary part of the relative permittivity.
Download figure:
Standard image High-resolution imageThe Debye models plotted in figure 2 were employed to validate our experimental measurements with accurate full-wave EM simulations performed using the setup showed in figure 4(a), which closely replicates the experimental setup of figure 1(b). Numerical simulations were performed using the CSTTM Microwave Studio software, which allows computations based on a given geometry and material parameters. The software can provide both the S-parameters and the EM field distributions of the system everywhere in the simulation domain as output data. As an example, figure 4(b) shows the power flow amplitude distribution at 60 GHz when the tank is filled with a 3 wt% glucose sample. The figure suggests that significant amount of energy is lost in the reflection side of the system, as expected due to the lossy behaviour of water-based materials in mm-waves.

Figure 4. (a) Replication of the experimental setup in a simulation environment. (b) Horizontal cross-section (along the x-y plane) of the power amplitude distribution for 3 wt% glucose concentration at 60 GHz. The optical rail and screws were modeled as perfect electric conductor (PEC), the plastic fixtures were modelled as a non-dispersive material with ε = 2 and tanδ = 0.01, the waveguides were modelled as cooper and the container walls as acrylic (ε = 2.53 tanδ = 0.0118).
Download figure:
Standard image High-resolution imageIn earlier work by the authors [26] the effect of the supporting fixtures and the optical rail in the recorded S-parameters was also investigated. It was found that the fixtures introduce some distortion to the signals, but do not affect their qualitative behaviour or monotonicity as a function of glucose concentration. This verifies that the correlation results presented in the next section are not significantly affected due to these support fixtures. Finally, note that the slight asymmetry in the power amplitude distribution can be attributed to the asymmetry in the geometry of the support fixtures (see figure 4(a)).
3. Results
3.1. Experimental results
The setup shown in figure 1(b) allowed measuring the reflection and transmission coefficients of the three different sets of samples described in section 2.1 between 50–75 GHz. Significantly higher sensitivity to glucose variations was observed for transmission data, particularly in the frequency ranges of 59–64 GHz and 69–73 GHz. This observation is of critical importance as it suggests that processing transmission data can be much more effective in this frequency range relative to reflection data used in previous work [6]. Importantly, this experimental observation has been validated by simulations, with examples of the very good agreement between simulations and experiments presented later in section 3.2.
Representative results of the experimental measurements are presented in figure 5, where the values of transmission coefficient are plotted for three different types of samples at 60.0 GHz. As shown in the figure, samples of different glucose concentrations in water and in saline solutions exhibit similar behaviour. The transmission coefficient increases approximately linearly as a function of the glucose concentration (note the logarithmic scale of the horizontal axis which is necessary to depict clearly the whole range of concentrations) with a slope of 0.35dB per wt%. The addition of salt to the samples causes an increase in the transmission amplitude between 0.1 dB to 0.5 dB, depending on the concentration and the frequency. It's important to note that while this linear relationship between transmission coefficient and glucose concentration has been confirmed for virtually all frequencies between 50–75 GHz, the sensitivity (slope) is dependent on the frequency of operation. This will be discussed further in section 3.3.

Figure 5. Experimentally measured S21 values at 60.0 GHz against glucose or salt concentrations (wt%). The red dash-dot line represents the values for the samples with varying glucose in water only. The black solid line represents the values for the samples with varying glucose in saline solutions. The blue dotted line represents the values for the samples with varying salt in 0.9 wt% glucose concentration in water. The error bars represent standard deviation over multiple measurements.
Download figure:
Standard image High-resolution imageImportantly, figure 5 also demonstrates that solutions with varying glucose concentration produce significantly more rapid changes in the signal than solutions with varying salt concentration, for which the transmission amplitude does not significantly change as the concentration increases. Therefore, these results suggest that the measurements are sensitive to changes in glucose concentration but not to changes in salt concentration.
3.2. Comparison with simulation results
EM simulations were performed for glucose concentrations in the range of 1–5 wt% to verify the approximately linear relationship between the scattering coefficient and the glucose concentration observed in figure 5. This high concentration range was selected in order to maximize the accuracy of the simulation results, which might be affected more strongly by numerical errors at lower concentrations.
Results from these simulations for reflection and transmission data at two sample frequencies are presented in figures 6(a) and (b) for the reflection and transmission coefficients, respectively. The experimental data shown are a combination of four distinct measurements: two sets (done on different days) performed with the samples made of glucose in distilled water and two more with the samples made of glucose in saline solutions. These data were then linearly fitted to obtain a mathematical model for the dependence of the recorded signals on concentration at the various frequencies.
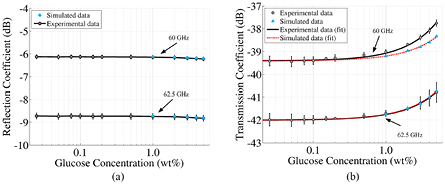
Figure 6. Transmission and reflection coefficients against glucose concentration for two different frequencies, 60.0 GHz and 62.5 GHz. In (a) and (b) the dots with the error bars represent the mean of the transmission signal obtained using four different measurements: samples with varying glucose concentration in distilled water and in saline solution for two different days. An offset was applied to perform the mean of the trend of the curves. The error bars for each point correspond to the standard deviation of these four samples. In (b) the error bars are multiplied by 2 to improve readability. In (a) the solid lines represent the values of the mean while in (b) the solid lines correspond to the fitting of that mean for different frequencies. In both cases, the triangular markers correspond to the simulated transmission results. In (b) the dashed line corresponds to the fitting of these simulation results. In order to be able to compare the curves for both frequencies in the same scale, an offset of 8.71 dB for the reflection coefficient and 8.65 dB for the transmission coefficient was added to the data at 62.5 GHz. The simulation results were also offset by 1.5 dB and 0.75 dB in (a) and by 6 dB and 3.2 dB in (b) for the 60 GHz and the 62.5 GHz traces respectively. This offset was applied in order to obtain the same amplitude as the experimental results, as their individual calibration processes are not compatible with each other.
Download figure:
Standard image High-resolution imageThe figures show the reflection and transmission coefficient against glucose concentration for the experimental and the simulation results at two different frequencies, 60.0 GHz and 62.5 GHz. The error bars correspond to the standard deviation obtained from averaging the experimental data. In general, different frequencies exhibit varying slopes obtained through the linear fitting process. At 60.0 GHz the experimental and the simulation results exhibit different slopes, 0.34 dB per wt% and 0.15 dB per wt% respectively. Agreement is much better at 62.5 GHz, where the sensitivity slope is 0.25 dB per wt% for the experimental results and the simulations. These results demonstrate a clear linear dependence of the transmission coefficient with the glucose concentration. On the contrary, the reflection coefficient remains mostly flat even for high concentrations.
3.3. Further analysis and discussion
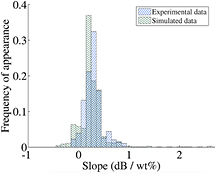
As mentioned in the previous section, the obtained sensitivity (slope) and agreement between the measured and simulated results depend on the exact frequency under investigation. This was illustrated in figure 6 for the two examples of 60.0 GHz and 62.5 GHz. This section attempts to provide an understanding for this behaviour by examining the universal sensitivity over the whole 50–75 GHz range, rather than looking at individual frequencies. In order to achieve this, the frequency of appearance of a particular slope value over the whole frequency range as well as the maximum and minimum achievable slopes were investigated. For this reason, slopes similar to the ones shown in figure 6 were calculated (through a linear fit), but for every frequency point measured in the 50–75 GHz range (6401 points in total). The resulting fitted slopes for each frequency point are grouped together and plotted as a histogram in figure 7 for both the experimental and the simulated data.
Figure 7. Histogram showing the relative frequency of appearance of a particular slope obtained after fitting the experimental or simulation transmission data as a function of glucose concentration using a linear fit for different frequencies in the range 50–75 GHz. For the simulated data, the peak of maximum frequency of appearance can be found at 0.2 dB per wt% and for the experimental data at 0.3 dB per wt%.
Download figure:
Standard image High-resolution image
A very good agreement between the experimentally obtained sensitivity slopes and the simulated ones is observed. For the experimental results, the slopes are concentrated between 0.1 dB per wt% and 0.4 dB per wt% and for the simulated results the slopes are concentrated between 0.2 dB per wt% and 0.4 dB per wt%. While the slopes range overall between −0.1 dB per wt% and 0.9 dB per wt% for the experimental results, the corresponding values for the simulated results range between −0.4 dB per wt% and 2.6 dB per wt%.
The differences between the experimental and the simulated slope values in figures 6 and 7 can be attributed to several factors. First, recall that our simulations were performed using the first order Debye model extrapolated to the whole V-band frequencies as discussed in section 2.2, and this extrapolation inevitably leads to inaccuracies in our simulations. Moreover, dielectric spectroscopy measurements of the glucose samples for these Debye models were performed at a room temperature of 23.0 °C, while the transmission measurements were performed at a laboratory temperature of 25.5 °C. Such a temperature difference has been shown to cause a 13% increase in the value of the real part of the relative permittivity and 14% increase in the value of the imaginary part of the relative permittivity for pure water around 60 GHz [23, 27]. It is therefore likely that a similar shift is introduced to the saline glucose samples used in this experiment. Finally, there are small discrepancies in the materials and components used in the simulations compared to the experimental setups, such as sub-mm surface roughness (which is not included in the simulation model) and relatively uncertain permittivity values (e.g. for the acrylic tank or plastic support bars) in the mm-wave range.
Table 1. Slope and frequency of appearance for the experimental and simulated data shown in figure 7.
| Slope (dB/wt%) | Frequency of appearance for the experimental data | Frequency of appearance for the simulated data |
|---|---|---|
| −0.1 | 0.022 | 0.063 |
| 0.0 | 0.038 | 0.058 |
| 0.1 | 0.130 | 0.053 |
| 0.2 | 0.210 | 0.370 |
| 0.3 | 0.320 | 0.186 |
| 0.4 | 0.160 | 0.161 |
| 0.5 | 0.026 | 0.030 |
| 0.6 | 0.044 | 0.013 |
| 0.7 | 0.020 | 0.012 |
| 0.8 | 0.015 | 0.014 |
| 0.9 | 0.010 | 0.002 |
4. Conclusions and future challenges
This paper proposed a setup consisting of two open WR-15 waveguides to measure the transmission and reflection coefficient of samples with different types of glucose concentrations in water and saline solutions, in the frequency range of 50–75 GHz. These concentrations were in the clinically relevant range between 0.025 wt% and 5 wt%. While reflection data was not conclusive, transmission data showed a clear correlation with glucose content, with the best results obtained in the 59–64 GHz and 69–73 GHz ranges.
The results suggested that the proposed experimental setup can detect glucose concentrations as low as 0.025 wt% with good accuracy (0.22 dB per wt%), which was also achieved in physiological saline samples (consisting of glucose, salt and water).
Finally, our experimental results showed an approximately linear relationship between the transmission coefficient and the glucose content, which was validated with accurate numerical simulations.
This linear dependence suggests the possibility of developing a miniaturized non-invasive glucose sensing device operating at the proposed frequencies. The development of this future device presents some challenges that need to be overcome in order to be used for glucose monitoring in humans. First, it is important to ensure that the presented method can detect glucose levels accurately despite possible changes in other blood constituents. Sodium chloride (NaCl), which was tested in this work, is the blood constituent with the highest molar concentration [28]. Other blood constituents with molar concentrations higher or on par with glucose are: bicarbonate, potassium, calcium, and cholesterol [28]. These molecules might affect the wave transmission, depending on the interaction between the molecules and the transmitted waves. This in turn will depend on each molecule's polarity, molecular structure, and size. To the best of our knowledge, the effects of these molecules have not been reported in the literature for millimetre wave, but we plan to examine them in detail in future work. Furthermore, the impedance mismatch between the air and the skin can produce a degradation of the transmitting energy leading to inconsistency in the measurements. To solve this impedance mismatch problem, an impedance-matching metamaterial is being considered in order to enhance the signal penetration through the skin, allowing the signal to reach the blood plasma [29, 30]. Another significant challenge to be addressed is the fact that the human body temperature and the ambient temperature can affect the signal in different ways as it has been shown for water in [23, 27]. Finally, a miniaturized device capable of emulating the VNA readings with enough resolution to detect small changes in glucose needs to be developed. It should be noted that such challenges are not unique to the mm-wave system presented in this work but need to be addressed by most non-invasive EM-based glucose sensing systems.
Acknowedgments
The work was supported by funding from Innovate UK grant # 131618 and 131353.