

Abstract
A novel surface plasmon resonance setup is introduced in this paper. By applying a galvo scanner to modulate the incident beam, the interference noise caused by the coherent light source and mismatching optical interfaces can be reduced significantly and a wide measurement range can be acquired meanwhile. In order to calculate the tiny shift of the resonance angle, a new algorithm called the phase shift algorithm based on discrete Fourier transform is proposed. The method measures the angle shift by detecting the signal phase shift in the frequency domain. According to the simulation and experimental results, this method has better resolution, good immunity of light source drift and fast computation speed. The experimental results demonstrate that a resolution of 1.8 × 10⁻⁶ RIU (3 standard derivations) is finally acquired with a measurement range from 1.33 to 1.385. It suggests a good potential value in small molecule interaction detection.
Export citation and abstract BibTeX RIS
1. Introduction
Surface plasmon resonance (SPR) is an optical sensing technique which can be used to monitor the effective refractive index at a certain distance from a metal interface [1, 2]. By detecting the resonance angle shift, which is linearly related to the change of surface effective refractive index, biochemical reactions occurring on the surface and adsorption amount of molecules at the interface can thus be analyzed dynamically [3]. It has been proved to be a versatile, reliable and powerful tool to study the interactions between biological molecules [4]. Recently, the application of SPR biosensing has been extended to the fields of drug screening and constituent recognition in which small molecules and low abundance analyte detection are involved [5–7]. Theoretically, the response of a SPR sensor depends on the refractive index change which is caused by the biomolecular interaction and mainly proportional to the molecular weight and density. Therefore, many researchers aim at improving SNR to enhance the detection limit [8, 9].
There are mainly two ways to enhance the instrumental performance: improving system stability and developing advanced data processing method. The configuration of angle interrogation SPR sensing systems can be simply divided into two types: fan-shape beam and scanning angle instruments. In the fan-shape beam configuration, a converging beam is used to cover a range of incident angles [10]. In practice, a laser is usually used as the light source due to high monochromaticity, which can greatly enhance the contrast of the SPR attenuated total reflection (ATR) curve [10, 11]. However, the coherent light source can also cause severe interference noise in the fan-shape beam configuration because of the mismatching optical interfaces. A random phase modulator, such as a rotating diffuser [10] or an acoustic modulator [12], is often used to reduce the coherent noise. Nevertheless these methods would lead to a complex system configuration and nonuniform intensity distribution. In the scanning angle configuration, the interference noise can be eliminated because a narrow collimated scanning beam is used to avoid the optical path overlap. A conventional optical setup is based on a θ–2θ rotating stage with which a wide measurement range can be easily acquired [13, 14]. This advantage makes it ideal for lab use to analyze various samples, but the measurement speed confined by the mechanical movement is relatively low and the application in biomolecular interaction detection is thus limited. In order to improve the detection speed, a scanning optical system is introduced to replace the mechanical rotating stage. Typically a coil-operated vibrating mirror [15, 16] or a piezo-electric actuated mirror [17] is utilized to drive the incident beam to oscillate over a range of angles continuously. As the dynamic range of these two scanning devices is relatively small, a mechanical stage is also required to meet the measurement range demand for bio-interaction detection [17]. For example, the scanning angle for commercial instruments from Eco Chemie (Autolab ESPRIT, SPRINGLE and TWINGLE) is 4° at a certain offset angle which needs to be adjusted manually [18]. Shin et al presented a palm-sized SPR setup incorporating a rotating mirror working at 2000 rpm for modulating the incident laser to form a disk-like beam, and a CMOS image sensor is used to monitor the reflected beam [11]. In order to compensate for the noise caused by asynchronous sampling, a total number of 60 images is averaged and 2 s is needed to generate a sensing datum. Scanning mirror configuration is applied in the surface plasmon resonance imaging (SPRI) system to enlarge the dynamic range as well. IBIS commercial instruments make use of a scanning mirror with maximum range of 8° [19] and an acousto-optic deflector (AOD)-based SPRI system can achieve a scanning angle of about 6.4° [20]. In order to achieve 1.33–1.38 measurement range, a high refractive index prism and sensing chips (SF18, ZF5, etc) are needed. In practice, economical BK7 glass slides are more preferable and show better sensitivity than the high refractive index configuration [21].
Another important factor related to SNR is the resonance angle finding algorithm. Traditional methods include polynomial fitting, centroid-based algorithms, minimum reflection, etc [22, 23]. Due to simplicity, high resolution and fast calculation, centroid-based algorithms have been widely used. In order to overcome the disadvantage that the conventional centroid algorithms with a fixed baseline can be easily influenced by the light source intensity fluctuation, several improved methods have been developed. Thirstrup et al proposed a dynamic baseline algorithm, in which the baseline is adjusted dynamically by a preset ratio between the area of the SPR curve below and above the baseline [24]. Since the baseline needs to be determined for every SPR spectrum, this method is rather time consuming. Zhan et al proposed a fast centroid algorithm using the fixed-boundary method showing better resolution and computation efficiency [25]. However, the method would reduce the measurement range a little bit.
This paper presents a galvo scanner-based SPR setup with a novel phase shift resonance angle finding algorithm which aims at improving the resolution and dynamic range at low computation complexity. A linear beam is driven by a high precision galvo scanning system to scan over an incident angle range of 12° which can cover a refractive index range from 1.33 to 1.385 with the common BK7 glass prism and gold-coated slides. A linear photodiode is used to monitor the reflected beam and realize multichannel sensing. The galvo scanner works at the so-called step-and-hold positioning mode. Being distinct from the continuous scanning mode, the entire scanning range is divided into several small steps. When the galvo scanner reaches and holds a required position, data sampling is applied. Therefore, performance reduction caused by sampling clock jitter or unstable rotating speed can be avoided. In addition, a novel resonance angle finding algorithm based on the phase shift measurement has been proposed. The main advantage of this method is that the time (or spatial) shift is measured as the phase shift in the frequency domain. Because the noise usually has a distinctly different distribution in the frequency domain, the phase shift method has better immunity to the light source intensity drift. The simulation and experimental results show that this method can achieve better resolution than the centroid and fixed-boundary methods.
2. System configuration
The optical schematic is illustrated in figure 1. It consists of (0) a 2 mW 670 nm laser diode, (1) a fiber collimator, (2) a Powell lens, (3) a cylindrical lens, (4) a polarizer, (5) a galvo scanner, (6, 7) two cylindrical lens pairs, (8) a linear photodiode array, (9) a 2-channel flow chamber, (10) a sensing chip and (11) a prism.
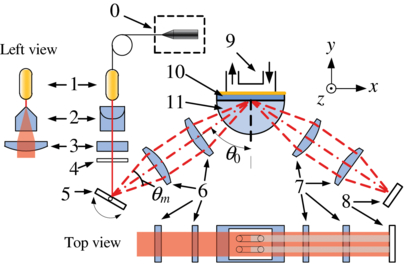
Figure 1. Optical schematic of a galvo scanner-based SPR sensing setup: (0) 2 mW 670 nm laser diode, (1) fiber collimator, (2) Powell lens, (3) cylindrical lens, (4) polarizer, (5) galvo scanner, (6, 7) cylindrical lens pairs, (8) 1D photodiode array, (9) 2-channel flow chamber, (10) sensing chip and (11) prism.
Download figure:
Standard imageA temperature and drive current stabilized 2 mW 670 nm laser diode (0) with single mode pigtail fiber is used as the light source. A fiber collimator (1) is used to generate a narrow (diameter <0.5 mm) parallel beam, which will be one-dimensionally expanded in the z-axis direction by a Powell lens (2) and a planoconvex cylindrical lens (3) to generate a uniform linear beam, and then p-polarized by a polarizer (4). A galvo scanner (5), whose rotating angle is controlled by a PID controller to position laser beams quickly and accurately, is used to modulate the incident beam. After reflection by the galvo scanner (5), the linear beam travels into a typical Kretschmann-type SPR sensor through a cylindrical lens pair (6). The half-cylindrical prism (11) is made of BK7 glass and glass slides coated with 50 nm gold film are used as the sensing chips (10). The reflected beam is then converged at a linear photodiode array (8) by another cylindrical lens pair (7). A two-channel flow cell (9) is mounted on top of the sensing chip.
Figure 2 shows the details of a photoelectric converter. The reflected beam is monitored by a linear PIN array (Hamamatsu S8558) and the photocurrent is converted into voltage by a series of I–V converters. A 16-bit multichannel ADC is used to sample the signal simultaneously and data are transmitted to a laptop by USB. One ADC channel is used to monitor the fluctuation of laser intensity and two other ADC channels are used to sense the ATR curves of the two flow channels.
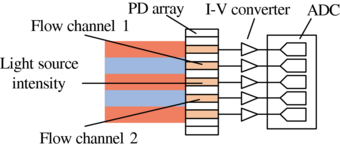
Figure 2. Schematic diagram of photoelectric conversion.
Download figure:
Standard imageThe galvo position is controlled to scan as a triangle wave form which is generated by a precise 16-bit DAC. A voltage change of 1 V will result in an optical angular shift of 1°. The central incident angle θ0 is designed near to the resonance angle of water (about 72°). The optical excursion of galvo θm is about 12° and is divided into 2Ns steps while sensing. As shown in figure 3(a), the scanning step series within one single scanning period can be represented as
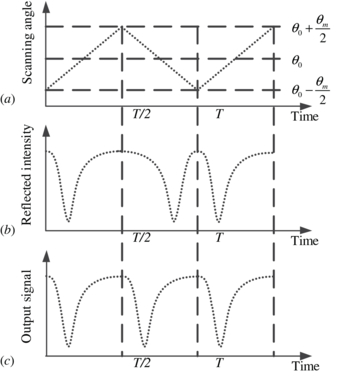
Figure 3. Signal process flowchart. (a) The incident angle series. (b) The reflected intensity from the SPR sensing element when the incident angle varies as shown in (a). The latter half period is reversed to meet the requirement of the phase shift method and (c) is the final signal.
Download figure:
Standard imagewhere T is the scanning period, t = 0, T/2Ns, 2T/2Ns,..., (2Ns − 1)T/2Ns. The intensity of the reflected beam can thus be expressed as

where I0 is the incident intensity and R(θt) is the SPR reflectance which can be calculated by Fresnel's equation [22]. This process is illustrated in figure 3. The latter half data in every period are reversed to make the following signal processing much more convenient. The finally SPR intensity-incident angle spectrum (ATR curve) has Ns-point data corresponding to a period of T/2.
3. Algorithm
3.1. Centroid-based algorithm
Among various algorithms to determine the resonance angle, centroid-based methods are the most popular due to their simplicity and high sensitivity. The centroid is used to represent the resonance angle in this method.
The concept of the centroid method is shown in figure 4. A baseline is usually applied and the centroid of the area enclosed by the baseline and ATR curve is calculated as [23]

where In is the intensity of the ATR curve at position n, Ib is the baseline and n1, n2 are the crossover points between the baseline and the ATR curve. The selection of the baseline can directly affect the sensitivity and noise suppression ability, so it must be chosen carefully [26]. It has been proved that a dynamic baseline can diminish the noise from the light source shot noise [24]. However, the complex algorithm for determining the baseline is very time consuming and not suitable for real-time data process and portable equipment. A fast centroid algorithm called fixed boundary was reported and shows a higher SNR, resolution and computation efficiency [25]. Fixed start and stop positions are used to enclose an area with the ATR curve and the centroid of this area is calculated as the resonance position. Calculation complexity can be greatly reduced since no baseline needs to be determined. This method can be expressed as [25]
in which In is the intensity of ATR curve at position n, and ns and ne are the start and end boundaries, respectively.
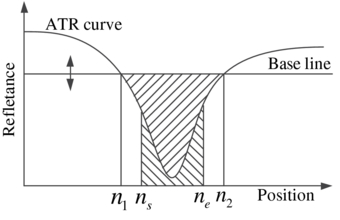
Figure 4. Conception of centroid and fixed-boundary methods.
Download figure:
Standard image3.2. Phase shift algorithm
In SPR sensing, when the local refractive index of the sample varies, the resonance angle would change correspondingly. As shown in figure 3, this angle change can be considered as time delay which appears as a linear phase shift in the frequency domain. Therefore, if the signal phase can be calculated by discrete Fourier transform (DFT), the time delay can thus be obtained. The DFT calculation can be performed to an N-point digital signal xn as
where k = 0, 1, 2, ..., N − 1, and i is the imaginary unit. A position shift m corresponds to adding the output Xk a linear phase change

DFT can provide whole spectral information about amplitude and phase. In this study, only a specific frequency component is useful, so a simplified fast algorithm is developed to reduce the computation complexity. For an N-point digital signal, the frequency resolution is fs/N (fs is the sample frequency) and the SPR signal has a frequency of 2/T, so only Xk (k = N/Ns) needs to be calculated. The phase of the signal can be expressed as

in which arctan2 is the quadrant correct arctangent which can be used to determine the phase angle of a complex in the range of (−π, π], and Im and Re denote the imaginary and real parts, respectively.
3.3. Simulation
Mathematic simulation is used to check the theoretical precision and computation efficiency of the phase shift, centroid method and fixed-boundary methods. Noise is generated by random series and the standard derivation of output is used to evaluate the algorithms' performance.
From (1) and (2), the detector output is a function of the incident angle θi and the light source intensity I, so the form with noises can be expressed as follows:

where s is a constant denoting the sensitivity of the photo detection circuit, ΔI0 is the light intensity fluctuation, Δθi is the repeatability of the galvo scanner and ΔD is the quantization error.
In this simulation, the whole scanning range is from 66° to 78° and sampled into 512 points (Ns = 256). Each simulation data segment comprises four ATR curves (N = 1024). For centroid methods, these four curves are averaged into one ATR curve. The baseline for the traditional centroid method is set to the middle value of the curve. The reflectance R(θ) is calculated by Fresnel's equation of the typical prism–metal–sample system, in which the refractive index of gold is calculated by the Drude model [27]. The noise in (8) can be expressed as
in which Ran generates normally distributed random numbers with the mean value of 0 and standard derivation of 1/3. AI Ran is used to simulate long-term intensity drift and it is a constant within each scanning period but varies between different periods. AIt Ran(t) is a series of numbers and used to simulate high frequency intensity noise. The maximum output of ADC is 10 V, so I0 is chosen as 10. According to experimental measurements, the intensity noise components are chosen as AI = 0.5%, AIt = 0.01%. Aθ is chosen as the repeatability of the galvo scanner (5 µrad). ΔD is calculated as a 16-bit ADC is used.
The relationship between the effective refractive index of the sample (ns) and the output of the resonance angle finding algorithm is fitted by a linear model to get the regression equation. The calculation results are analyzed when ns varies from 1.32 to 1.38, which is a typical measurement range in the biomolecular interaction analysis. The R2 are 0.9993, 0.9980 and 0.9909 for the phase shift, centroid method and fixed-boundary methods, respectively, showing good linear relationship. The output of centroid-based methods is the peak position; however, the output of the phase shift method is phase in radius. In order to make their results comparable, the outputs of different methods are converted into the refractive index units (RIU) by their regression equations.
3.3.1. Precision performance
The output standard derivation of each resonance angle finding algorithm is calculated from 500 times simulation when ns = 1.33. The results are listed in table 1. When the centroid method is used to determine the resonance angle, the area enclosed by the constant baseline and SPR resonance curve is used. As shown in the simulation results, the centroid method is very sensitive to the intensity long-term drift. For the fixed-boundary method, two constant boundaries are used. When the ATR curve shifts up and down, only a rectangle is attached or detached, so the centroid position of the shape enclosed by the curve and boundaries will not change a lot. For the phase shift method, the ATR curve is changed into the frequency domain and the long-term drift would only appear near the dc component; hence, the response can hardly be influenced. In the same way, the phase shift method has very good immunity to high frequency noise which usually has a flat frequency distribution and has a very low frequency component in the target signal frequency region. The precision performance at different ns is shown in figure 5. The mean standard derivations are 0.39 × 10⁻⁶, 3.1 × 10⁻⁶ and 0.78 × 10⁻⁶ for the phase shift, centroid and fixed-boundary method, respectively. The simulation results show that the phase shift method has a better resolution. This method can also be applied to 2D imaging devices (CCD or PDA based SPR sensing equipment) by combining row data into a series.
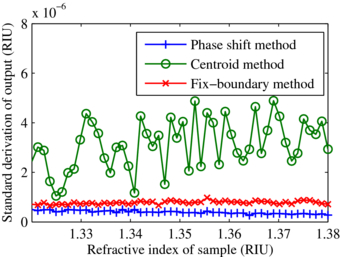
Figure 5. Simulated standard derivations of phase shift, centroid and fixed-boundary method when the refractive index of sample varies from 1.32 to 1.38.
Download figure:
Standard imageTable 1. Comparison of standard derivations of different resonance angle finding algorithms.
| Method | Galvo repeatability, Δθ0 (µRIU) | Intensity long-term drift, AI Ran (µRIU) | High-frequency intensity noise, AIt Ran(t) (µRIU) | Quantization error, ΔD (µRIU) |
|---|---|---|---|---|
| Phase shift | 0.08 | ε | 0.39 | ε |
| Centroid | 0.14 | 2.97 | 0.09 | ε |
| Fixed boundary | 0.09 | ε | 0.71 | ε |
All standard derivations are calculated from 500 times simulation. The value of ε is about 10−10–10−15 (RIU).
3.3.2. Calculation speed
SPR is a kind of real-time detection method, so the resonance angle finding algorithm should have satisfactory computation efficiency. In this simulation, the computation time is acquired by applying 50 000 times calculation for each method on an Intel I7-740QM (1.73 GHz) based PC. The operation times of the phase shift, centroid and fixed-boundary methods are 8.5 s, 7.1 s and 3.2 s, respectively. The results indicate that the phase measurement method has a similar computation speed to the centroid method.
4. Experiments
4.1. Materials and methods
Two syringe pumps (C3000) with 120° 3-port valve were purchased from Tricontinent. An HPLC-like loop flow is built by a 6-port distribution valve (HVXL6–6) purchased from Hamilton. Fisherfinest BK7 glass slides purchased from Thermo Fisher Scientific were used as the substrates of SPR sensing chips. ACS reagent ≥99% glycerol was purchased from Sigma-Aldrich and glycerol solutions are prepared with Millipore water.
The SPR sensing chips are made by the flowing procedure. First, the glass slides are totally immersed into piranha solution (a mixture of 98% H2SO4 and 30% H2O2, 7:3, v/v) for at least 1 h and then washed with Millipore water. After being dried under nitrogen, they are cleaned by a plasma cleaner immediately before the deposition. A 50 nm thick Au film is deposited on the substrates by sputtering and 1 nm Cr is used as the adhesion layer. Sensing chips are also cleaned by piranha solution before every experiment.
4.2. ATR curve quality
The reflected intensity is measured to check the quality of the ATR curve. The data are collected in a scanning period when Millipore water fills the flow chamber. The light source intensity distribution as a function of the scanning position, which corresponds to the incident angle, is shown in figure 6(a) by the dashed line and the ATR curve of flow channel 1 is shown in figure 6(a) by the solid line. The normalized ATR curve is shown in figure 6(b). The latter half period of the ATR curve in a scanning period is reversed as shown in figure 6(c).
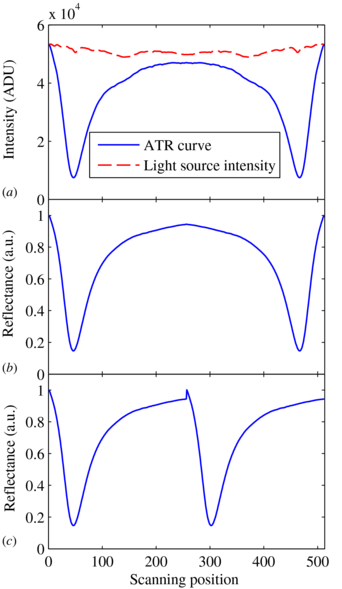
Figure 6. Intensity distribution of the light source: ATR curve (a), normalized ATR curve (b) and reversed ATR curve (c).
Download figure:
Standard image4.3. Measurement on glycerol solutions at different concentrations
There is a good linear relationship between the concentration and refractive index of the glycerol solution [28], so it can be used to evaluate the performance of the SPR setup. All solutions are handled by two syringe pumps in the PTFE tube (1.5 mm OD, 0.5 mm ID) at a flow rate of 50 µl min−1. 4%, 8%, 12%, 16%, 20% 24%, 28%, 32%, 36% and 40% glycerol solutions are injected and Millipore water is used to purge the channel after every glycerol solution injection. The refractive index of glycerol solutions is tested by an Abbe refractometer. The collected data are processed by the phase shift, centroid and fixed-boundary methods, respectively, and the sensorgrams are shown in figures 7(a)–(c). The responses of different methods to the refractive index of glycerol solutions are also fitted by the linear regression model as shown in figures 7(d)–(f).
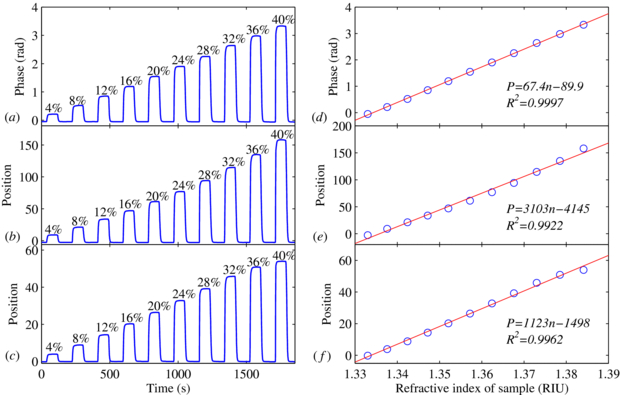
Figure 7. Measurement results of glycerol solutions at different concentrations: real-time response (a) and fitting result (d) calculated by the phase shift method; real-time response (b) and fitting result (e) calculated by the centroid method; real-time response (c) and fitting result (f) calculated by the fixed-boundary method.
Download figure:
Standard image4.4. Baseline noises
The baseline characteristic is analyzed to evaluate the resolution. Millipore water is applied to both channels at a flow rate of 50 µl min−1 for about 30 min. Because there is no temperature regulator for the flow chamber, one of the two channels is used as a reference to compensate for the temperature drift. The real-time chart of baseline calculated by the phase shift, centroid and fixed-boundary methods are illustrated in figures 8(a)–(c). The compensated baselines are shown in figures 8(d)–(f).
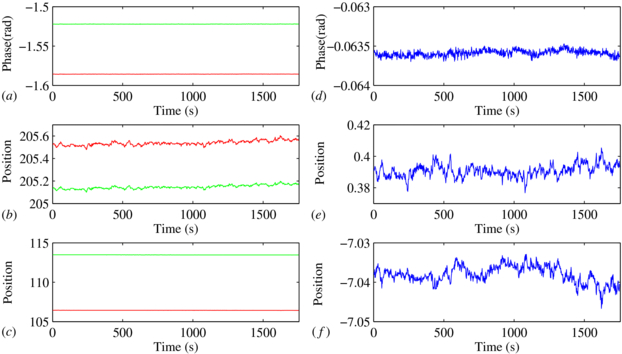
Figure 8. Baseline drift of each channel calculated by the phase shift (a), centroid (b) and fixed-boundary (c) methods. Baseline noise after compensation between two channels generated by the phase shift (a), centroid (b) and fixed-boundary (c) methods.
Download figure:
Standard image4.5. Measurement on a dilute solution
0.05% glycerol dilute solution is prepared to check the resolution directly. The dilute solution is injected in channel 1 at 50 µl min−1 and Millipore water is applied in channel 2 as a reference. This process is repeated three times. The real-time sensorgrams processed by the phase shift, centroid and fixed-boundary methods are shown in figures 9(a)–(c), respectively.
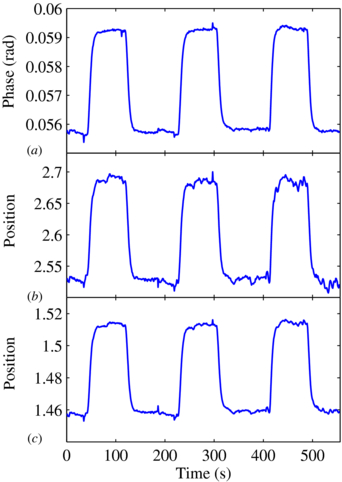
Figure 9. Measurement results of dilute glycerol solution (0.05%) by the phase shift (a), centroid (b) and fixed-boundary (c) methods.
Download figure:
Standard image5. Results and discussion
5.1. ATR curve quality
As shown in figure 6, it can be clearly seen that there is no interference noise contained in the ATR curve. The scanning optical geometry can avoid the SNR reduction caused by the interference noise.
The incident beam cannot be ideally focused into a line, so the light source intensity just has an approximate uniform distribution while scanning as shown in figure 6(a). The small distortion of light source distribution can be considered as the fixed pattern noise and may vary with different SPR sensing chips. This noise can also be seen on the ATR curve as shown in figure 6(a). The ATR curve is normalized by the light source distribution to reduce the fixed pattern noise. As shown in figure 6(b), a smooth ATR curve can be acquired and a contrast better than 80% also indicates a clean sensing surface.
Because the galvo scans in a back and forth way, the reflectance in a single scanning period is symmetric. The latter half scanning period is reversed to meet the requirement of the resonance angle finding methods.
5.2. Sampling rate
The small step response of the galvo is 150 µs and the data sample consumes about 40 µs. Therefore, 200 µs is adequate to finish a scanning step. One ATR curve comprises 256 scanning steps and four ATR curves generate one sensing point. That is to say the maximum sampling rate is about 5 Hz.
5.3. Measurement range and linearity
The real-time sensorgrams and fitting results of measurement on different glycerol solutions are shown in figure 7. The mass percentage of glycerol in water varies from 0% to 40% at a step of 4%. The response of glycerol solutions is calculated by three different resonance angle finding algorithms. The relationship between the response and the refractive index of the glycerol solutions is linearly fitted as shown in figures 7(d)–(f). The fitting results show that this SPR setup has a wide refractive index measurement range from 1.33 to 1.385 with the normally used BK7 glass sides. The R2 are 0.9997, 0.9922 and 0.9962 for the phase shift, centroid and fixed-boundary methods, respectively. The curve generated by the phase shift method shows the best linearity over the whole measurement range. The linearity of the fixed-boundary method is good when the measurement range is within 1.37, but it will degrade dramatically when the resonance angle is close to the end boundary.
5.4. Resolution
The baselines of two flow channels are measured for about 30 min and collected data are processed by three different resonance angle finding algorithms as shown in figure 8. The actual baseline character is evaluated after compensation between two channels to reduce the temperature drift. It should be noted that there is a phase bias between these two channels. This bias is caused by the imperfect optical alignment. If the focus line on the sensing gold surface was perfectly perpendicular to the channels, there would be no bias between two channels. In practice, SPR biosensing is a relative measurement. This bias would not affect the system performance.
For the phase shift method, the regression equation from the measurement on glycerol solutions is P = 67.4n−89.9 as shown in figure 7(d), so 1 rad phase shift is equivalent to a refractive index change of 0.015 RIU. The standard derivation of baseline obtained by the phase shift method is 4 × 10⁻⁵ rad as shown in figure 8(d). Hence, this SPR setup with the phase shift algorithm can distinguish a phase change of 1.2 × 10⁻⁴ rad (3 standard derivations) which is equivalent to 1.8 × 10⁻⁶ RIU. The standard derivations of baselines calculated by the centroid and fixed-boundary methods are 0.0045 and 0.0012, respectively. The detection limits can thus be determined as 4.4 × 10⁻⁶ RIU and 3.2 × 10⁻⁶ RIU. This result shows that the phase shift algorithm can enhance the SPR setup performance remarkably.
From figure 8, it can be seen clearly that the baseline drift cannot be fully canceled out by the reference channel. A possible reason is that the temperature drift of different channels is not identical. If a temperature-stabilized flow chamber can be utilized, the resolution can be further enhanced.
The performances of the phase shift and fixed-boundary methods have good agreement with the simulated result. The centroid method shows a better result than the simulated result, because this method can be remarkably influenced by the noise characteristics and the noise may not have a completely random distribution as in the simulation.
The resonance angle finding algorithm performance can also be checked by measurement on dilute solutions. By linearly fitting the relationship between the refractive index and concentration of the dilute glycerol solution, the regression equation can be obtained as n = 0.11C + 1.33, where n is the refractive index and C is the concentration of the glycerol solution [28]. Therefore, 0.05% glycerol solution would cause a phase change of about 0.0037 for the phase shift method, and position changes of 0.17 and 0.06 for the centroid and fixed-boundary method, theoretically. The actual responses in figure 9 are 0.0035, 0.1648 and 0.056, which are close to the theoretical values. By comparing the response and baseline noise, it can be clearly seen that the phase shift algorithm has a better performance.
6. Conclusion
In summary, a galvo-based scanning SPR sensing setup with a novel resonance angle finding algorithm is introduced. Simulation and glycerol solutions are tested to evaluate the resolution, dynamic range and computation efficiency of this setup. The conclusion can be drawn as follows.
- The scanning configuration can eliminate the interference noise caused by the coherent light source and mismatching optical interfaces. A high quality ATR curve can be obtained.
- The measurement range and detection speed can be enhanced because the galvo scanner has a wide mechanical excurse, fast response speed and good linearity. A measurement range of 1.33–1.385 can be acquired with a common BK7 glass configuration.
- The phase shift algorithm detects the resonance angle shift by measuring the phase change of the ATR curve in the frequency domain. Because the signal and noise have distinctly different frequency spectra, this method shows good immunity to noise. The simulation result demonstrates that this method has a better resolution, higher resistance to intensity fluctuation and fast calculation speed. Experiments on glycerol solutions show that it has a high resolution of 1.8×10⁻⁶ RIU and good linearity of R2 = 0.9997 over a measurement range from 1.33 to 1.385 when the phase shift method is applied.
The result suggests that this setup has very good practical potential in a small molecule interaction study.
Acknowledgment
This work was supported by the National Natural Science Foundation of China (grant nos 30970757 and 30727001).