

Abstract
We present the simultaneous study of laser-induced plasma emission spectroscopy and high-order harmonic generation (HHG) from laser-ablated graphite plume. Time resolved evolution of carbon species in the ablation plume is investigated, revealing a clear abundance of C2 molecules under conditions optimal for graphite HHG. We also compare the high-order harmonic spectra with the photoionization cross-section of C2 molecules, which shows good agreement between the two. Our observations provide strong evidence that C2 molecules contribute to intense graphite HHG. Furthermore, properties of C2 molecules are investigated at different time periods of plasma evolution, and we identify the laser-ablation conditions for optimum harmonics yield.
Export citation and abstract BibTeX RIS
1. Introduction
High-order harmonic generation (HHG) from laser-ablated plumes (LAP) is an efficient method to generate bright coherent sources of extreme ultraviolet (XUV) radiation [1–3]. In this technique, a wide range of solid materials have been used to produce the LAP for HHG, and their nonlinear properties in the XUV region have been studied. These studies have shown that HHG from LAP can also be interpreted by the three-step model for gas harmonics [4]. According to this model, when high-intensity ultrashort lasers interact with an atom or a molecule, an electron is liberated from the ground state via tunneling ionization. In the second step, this electron is accelerated in the continuum by the laser field, and finally in the third step, it recombines to the ground state of the parent atom or molecule by emitting a photon. This semi-classical model explains very well the cutoff energy of the harmonics Ecut-off = Ip + 3.17Up (eV) (where Ip is the ionization potential and Up is the ponderomotive energy). With sufficiently high Ip, the harmonics enter the XUV spectrum. It has been shown that harmonics from LAP of most materials are generated from either neutral or singly ionized atoms [5].
One intriguing characteristic of the LAP technique is that for some target materials, the efficiency of the high-order harmonics is especially high compared with other HHG media [6]. For example, we have demonstrated that multi-μJ harmonic energy can be generated from carbon LAP with efficiency (∼10−4) [7]. The efficiency of these carbon harmonics is about an order of magnitude higher than gas harmonics, where the efficiency is typically 10−5 ∼ 10−6 [8, 9]. Therefore, carbon LAP is a highly promising medium for developing bright tabletop sources of coherent XUV radiation, and is an excellent candidate for generating intense attosecond pulses, which would allow one to explore new frontiers in science, such as the control of atomic motion in real time [10], attosecond time resolved dynamics of atoms, molecules [11], solids [12] and also the high contrast imaging of biological molecules in the water window region [13, 14].
To better understand the physics behind intense HHG from carbon LAP, the first step would be to identify the carbon species that are responsible for the HHG. This is especially important in LAP harmonics, where the composition of the plume is complex, typically involving not just atoms and ions, but also larger molecules and even clusters.
In this paper, we present the results of our studies on the time-resolved spectroscopy of laser-ablated graphite plume and carbon high-order harmonics. Information on the carbon species is studied by plasma emission spectroscopy, and their properties are investigated as a function of the time from the start of ablation (tsa). It is observed that, within the laser-ablation parameters used in this work for efficient HHG, graphite LAP contain an abundance of diatomic carbon molecules (C2). The contribution of these molecules (along with that of monoatomic carbon) to HHG is studied, by comparing the harmonic spectra with their photoionization cross-section (PICS). A good agreement is found between the PICS of C2 with the HHG spectra, generated using driving lasers of 1.8 μm wavelength. However, the PICS of monoatomic carbon is low in the soft x-ray region, and deviates considerably from the harmonic spectra. These observations are strong evidence that in graphite LAP, diatomic molecules of carbon are the key species for intense HHG from graphite LAP.
2. Experimental setup
The schematic diagram of the experimental setup is shown in figure 1. A Ti:sapphire laser (pulse length 210 ps, central wavelength at 0.8 μm) of the 10 Hz beam line of the Advanced Laser Light Source is divided into two beams using a beam splitter. The transmitted beam (which we call the prepulse (PP)) is focused on to a solid graphite target that is placed inside a vacuum chamber to produce low-density plasma. The pressure inside this chamber is maintained at ∼10−5 Torr. The graphite target is placed on a 3D translation stage to provide a fresh surface after several laser shots. The spot size of the PP beam on target is ∼200 μm, using a 20 cm focal length lens, resulting in a peak intensity of ∼1010 W cm−2. The second beam reflected by the beam splitter (which we call the main pulse (MP)), is compressed to around 42 fs by the pulse compressor, and then is focused on to the plasma for harmonic generation. The delay between the PP and the MP can be varied, and is typically set at few tens of ns, to increase the abundance of the neutrals in the plume. The generated harmonics are then sent to an XUV spectrometer, consisting of a flat-field XUV grating (Hitachi, 1200 lines mm−1) and a micro-channel plate (MCP) followed by a phosphor screen. Finally, images of the generated harmonics on the MCP are captured by a camera (16 bit CMOS, PCO-edge). For time-resolved plasma spectroscopy, a computer-controlled triple grating spectrometer (Newport, MS260i) is used for collecting the plasma emission. The spectral resolution of this spectrometer is ≈0.2 nm for the 1200 lines mm−1 grating, with a wavelength accuracy of 0.35 nm. The plasma emission is imaged on to the entrance slit of the spectrometer by an achromatic lens of 10 cm focal length and a magnification of ∼2.5. Then an ICCD camera (Andor, iStar 720) is used to record the images in a storage device. The minimum gate speed of this time-resolved system is <2 ns, and it covers the spectral region from 115 to 920 nm wavelength. In our experiments, the time gate for each spectral measurement is set at 10 ns, and spectra are recorded using the ICCD camera, from 30 to 90 ns after the tsa. The camera is triggered by the nanosecond electric signal that is synchronized to the Ti:sapphire laser, which can control the delay time at which the spectrum is recorded with 50 ps of precision.
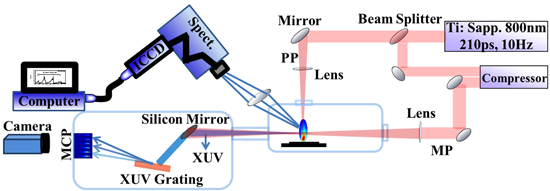
Figure 1. Schematic diagram of the experimental setup.
Download figure:
Standard image High-resolution image3. Results and discussion
To clarify the carbon species that are responsible for the intense HHG from graphite LAP, we perform simultaneous measurements of plasma emission spectroscopy and HHG from the laser-ablated graphite plume. We use time-resolved emission spectroscopy to study the carbon species that are present in the graphite plume. From these observations, we optimize HHG within the plasma region, at a time and position where visible plasma emission is most intense. Information on the carbon species within the graphite plume are collected by observing the resonance visible plasma emission lines, and their relevance to HHG is confirmed by comparing the high-order harmonic spectra with the PICS of each possible carbon species.
We show in figure 2 a spectrum of the graphite plasma emission. The visible spectral region of 410–580 nm wavelength is selected for this measurement, as this region contains the dominant emission transitions of monoatomic carbon and molecules [15, 16]. In this specified region, strong spectral emissions of the Swan bands are observed, which are signatures of diatomic molecules of carbon (C2). The observed adjacent bands are associated with the d3Πg → a3Πu transitions, which belongs to the vibrational progressions of Δν = 0, ±1 and +2 bands. The peaks of the bands, (2,0), (1,0), (0,0) and (0,1) are observed at 438, 473, 516 and 563 nm wavelengths, respectively. Very weak transitions of the (0,2) band are also observed (not shown in the figure), with a peak at 619 nm wavelength. From this spectrum, it is evident that the graphite plasma plume contains C2 molecules and that these molecules are ablated due to the picosecond laser pulse irradiation of the graphite target.
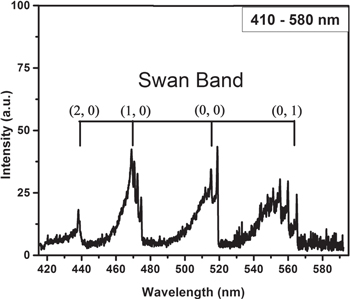
Figure 2. The spectrum of graphite plasma emission, showing predominantly vibronic transitions of carbon molecules (C2). The spectral region is selected from 410 to 580 nm and this spectrum is recorded at tsa = 30 ns.
Download figure:
Standard image High-resolution imageInterestingly, we could not observe any signature of neutral or ionic transitions of monoatomic carbon in our visible emission, which is contrary to what is usually observed in other materials using nanosecond or femtosecond laser ablation [17, 18]. We have observed that, for the PP laser parameters used in this work with the graphite target (pulse duration ∼210 ps, central wavelength at 0.8 μm and intensity ∼1010 W cm−2), the ablated plume emits strong radiation related to molecular bands, such as C2. One possible reason for observing only molecular carbon species could be the different plasma ablation condition used for HHG in comparison with previous laser ablation studies. The previous work reported for laser-ablation with nanosecond and femtosecond laser indicates that there are certain laser-ablation conditions where the molecular emission are dominant over monoatomic carbon, for graphite ablation [18, 19]. The observation of C2 molecules is in sharp contrast to past LAP harmonics, where mostly monoatomic particles from low-density LAP has been used for HHG [5, 9]. In gas harmonics, several types of diatomic molecules have been used for HHG and very interesting features have been studied, such as molecular dissociation [20], dynamics of two center interferences in HHG [21] and the attosecond time resolved probing of nuclear motion [22]. However, to the best of our knowledge, no diatomic response for HHG has been observed previously with the LAP technique. Therefore, HHG from graphite LAP may provide us a route to study molecular dynamics of HHG from solid materials.
In figure 3, we show the temporal variation in the intensity of the plasma emission around the Swan band, from 410 to 560 nm in wavelength, for different tsa. After ablation, plasma emission is recorded for tsa of 30–90 ns, at a fixed laser intensity of 3.0 × 10¹⁰ W cm−2. It has been shown that such plasma spectroscopy technique is useful to find the optimum conditions for intense HHG from solid materials [23]. From this figure, we see that the intensity of the Swan band emission is high at 30 ns, which decreases rapidly as the plasma expands. The emission of the Swan band almost disappears after tsa = 90 ns. This observation suggests that within the specified plasma emission region of 30–90 ns, C2 molecules are abundant around 30 ns and disappear at 90 ns.
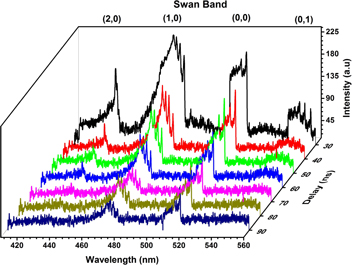
Figure 3. Variation of the Swan bands for tsa of 30–90 ns, in the spectral region between 410 and 560 nm, at a fixed PP laser intensity of 3.0 × 10¹⁰ W cm−2.
Download figure:
Standard image High-resolution imageNext, we study the variation of the harmonic intensity with the delay between the PP and the MP, to find the delay time at which the harmonic intensity is maximum. It should be noted that along with the delay time between the PP and the MP, the intensity of the PP is also a crucial parameter for maximizing the harmonic output flux, as this intensity is used to control the density of the ablated plume. For graphite LAP, the optimum PP intensity for efficient HHG is ∼1.4 × 10¹⁰ W cm−2. At higher intensities, we start to observe spectral line emission of monoatomic carbon in the visible region, accompanied by a significant reduction in the harmonic intensity. Similarly, low PP intensities (discussed later) also reduce the photon flux of the XUV pulses. To better understand the tradeoff between the PP intensity and PP-to-MP delay, we use two different PP laser intensities near the optimum to produce the graphite LAP, and then we vary the delay between the PP and the MP. In this measurement, the intensity of the MP is kept constant at ∼2.5 × 10¹⁴ W cm−2. The variation of the harmonic yield for a PP-to-MP delay from 10 to 70 ns is shown in figure 4. It is observed that at a PP intensity of 1.4 × 10¹⁰ W cm−2, very weak harmonic signal starts to appear on the MCP for delays as short as 2 ns. As the delay is increased, we observe that harmonic signal of sufficient yield is observed from 10 ns delay. However, at this relatively short delay, the background noise due to plasma emission is high, since the plasma temperature during the initial stage of ablation is generally high. Results show that XUV harmonics with highest yield is generated at 30 ns delay. After that, the high-order harmonic yield decrease as the delay is increased, and almost vanishes after a delay of 70 ns.
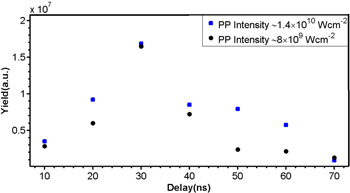
Figure 4. Variation of high-order harmonic yield with respect to the delay between the PP and MP at two different PP ablation intensities of ∼1.4 × 10¹⁰ W cm−2 (blue squares) and ∼8 × 10⁹ W cm−2 (black circles) using main pulse intensity of ∼2.5 × 10¹⁴ W cm−2.
Download figure:
Standard image High-resolution imageIn figure 5, we present the spectrally integrated images of the plasma at variable tsa. These images are recorded to check the plume size and its emission dynamics at different tsa, by imaging the plasma directly on to the ICCD Camera (iStar 720; bypassing the grating), where the CCD of this camera is capable of detecting the spectral emission from 120–1090 nm. This figure shows that the vertical extension of the plasma plume is ∼1 mm from the target surface. Plasma emission is observed to be strong at positions close to the target surface, because of the higher density in this region. The variation of the plasma intensity at different tsa shows that this emission intensity decreases rapidly at large tsa, which reveals that the density of the medium is higher at shorter delays. Finally, the emission of the plume vanishes after tsa = 80 ns. These observations show strong correlation between the intensity of the Swan band emission (figure 3) and harmonic yield (figure 4), pointing to the contribution of C2 molecules for intense harmonic generation from graphite LAP.
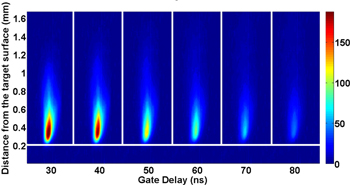
Figure 5. Spectrally integrated images of carbon plasma plume expansion at variable time periods of plasma evaluation, at fix prepulse laser intensity of 3.0 × 10¹⁰ W cm−2.
Download figure:
Standard image High-resolution imageTo further study the contribution of C2 molecules to graphite HHG, we compare the PICS of C2 with the graphite harmonic spectra. According to quantitative rescattering theory for high-order harmonics, the harmonic spectra from a single atom or molecule should replicate the field-free PICS of the atom or molecule [24]. Mathematically, HHG spectra for an extended system can be written as
Here,  is the macroscopic wave packet (MWP), and
  is the photo-recombination cross section, which is the inverse conjugate of the PICS. The macroscopic wave packet
  depends on the system and includes phase matching condition, and differs from the single atom wave packet only by the phase matching condition. For harmonic generation in thin medium (such as in our case, where the plume is 100–200 μm in width), the impact of the phase mismatch on the wave packet is minimum and the macroscopic wave packet can be approximated to the single atom wave packet [25]. In this case, the harmonic spectrum should follow closely the PICS of the medium.
We compare the high-order harmonic spectra with the PICS of monoatomic and diatomic carbon, to identify the contribution of both elements to HHG. The details of the calculation of the PICS used here can be found elsewhere [26]. In summary, Hartree–Fock approximation (HFA) is used for the calculation of the differential cross-section. In HFA, the equation for PICS can be written as,

Here  is the total ionization cross-section, β is the asymmetry parameter,
  is an associated Legendre polynomial
  and θ is the angle between the direction of polarization of light and the momentum of the outgoing electron. For HHG, the polarization of the generated harmonics is parallel to the re-colliding electron, so the θ = 0 contribution is considered [27]. The values of the total ionization cross-section
  and asymmetry parameters (β) are taken from literature [26, 28] and the variation of PICS is calculated.
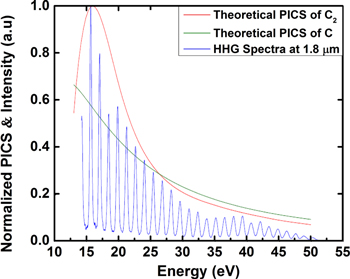
A comparison of the PICS with the high-order harmonic spectra is shown in figure 6. The driving laser of 1.8 μm wavelength is used for HHG (the details of 1.8 μm source are given in [27]). This driving laser wavelength is selected to extend the harmonic cutoff and to generate broadband harmonics, to see the variation of PICS up to high energies. The PICS of C and C2 (calculated with equation (1)) and the harmonics intensity are normalized for the comparison. The calculated PICS of C is relatively low than the PICS of C2. So the PICS of C is multiplied by a factor of two for better comparison. By comparing normalized PICS (N-PICS) with the HHG spectra we find that the wavelength dependence of the N-PICS for C2 is in better agreement with the harmonic spectra than for monoatomic carbon. Therefore, in addition to the Swan bands observed in figure 2, the energy variation again supports that harmonics are generated from diatomic carbon molecules, instead of monoatomic carbon. In figure 6, we can also see that the PICS (Normalized with the PICS of C2) of diatomic carbon is higher, compared to the PICS of the monoatomic carbon. Given the higher PICS for C2 compared with monoatomic carbon, this could also explain the reason for the relatively intense high-order harmonics that has been observed from graphite plume [5, 7].
Figure 6. Comparison of the high-order harmonics spectra, generated with 1.8 μm driving laser wavelength, and photo-ionization cross-section is presented, for carbon species C and C2.
Download figure:
Standard image High-resolution image
4. Conclusion
In conclusion, we have simultaneously studied laser-induced plasma emission spectroscopy and HHG from laser-ablated graphite plume. The evolution of the plasma species that are ablated from solid graphite is investigated in the different time domains of ablation. We find that for the experimental conditions used for material ablation for HHG, the plume has an abundance of carbon molecules (C2) instead of monoatomic carbon. The variation of the diatomic molecules is investigated as a function of time after ablation, and harmonics are optimized within the region where neutrals are abundant. It is observed that harmonics with high-efficiency can be generated 30 ns after ablation. Finally, the tendency of the PICS for C and C2 is compared with the HHG spectra, and good agreement is observed for C2, instead of C. These observations could explain the exceptionally high harmonic efficiency from graphite plume to be due to the high PICS of the C2 molecule.
Acknowledgment
This work is supported by the National Sciences and Engineering Research Council of Canada (NSERC) and Fonds de recherche du Quebec-Nature et technologies (FRQNT). The authors thank to Antoine Laramée, Philippe Lassonde, Gargi Sharma and Aziz Berchtikou for their support to complete this work.