


ABSTRACT
We have performed interferometric observations of the 12CO (J = 1–0) emission in a sample of 27 objects spanning different evolutionary stages from the late asymptotic giant branch (late-AGB), through the post-AGB (pAGB) phase, and to the planetary nebula (PN) stage, but dominated by pAGB objects and young PNs (⩾81%). In this paper (the first in a series) we present our maps and main nebular properties derived for the whole sample. Observations were performed with the Caltech Millimeter Array at the Owens Valley Radio Observatory. The angular resolution obtained in our survey ranges between 2 3 and 107. The 13CO and C18O (J = 1–0) transitions as well as the 2.6 mm continuum emission have also been observed in several objects. The detection statistics in the 12CO, 13CO, C18O transitions and 2.6 mm continuum are 89%, 83%, 0%, and 37%, respectively. We report first detections of 12CO (J = 1–0) emission in 13 targets and confirm emission from several previous marginal detections. The molecular envelope probed by 12CO (J = 1–0) emission is extended for 18 (out of 24) sources; envelope asymmetries and/or velocity gradients are found in most extended objects. Our data have been used to derive accurate target coordinates and systemic velocities and to characterize the envelope size, morphology, and kinematics. We also provide an estimate of the total molecular mass and the fraction of it contained in fast flows, lower limits to the linear momentum and to the isotopic 12C/13C ratio, as well as the AGB mass-loss rate and timescale for sources with extended CO emission.
Export citation and abstract BibTeX RIS
1. INTRODUCTION
Planetary nebulae (PNs) are glowing shells of ionized gas and dust ejected in the latest evolutionary stages of intermediate mass stars (∼1–8 M☉). PNs evolve from the circumstellar envelopes (CSEs) around asymptotic giant branch (AGB) stars through a short-lived (∼ 103 yr) and fascinating evolutionary stage designated as the post-AGB (pAGB) or pre-planetary nebula (PPN) phase (see, e.g., the review paper by van Winckel 2003). Spherical, slowly expanding (Vexp ∼ 15 km s−1) CSEs result from the intense mass-loss process during the AGB phase. In the pAGB phase, the mass-loss rate decreases dramatically and the central star, which evolves quickly toward higher effective temperatures at roughly constant luminosity, is surrounded by a detached, expanding shell of gas and dust. The AGB-to-PN transformation ends when the central star is hot enough to ionize most or all the circumstellar material.
PPNs and PNs display spectacular and varied nebular morphologies with elongated lobes expanding at high speeds (≳100 km s−1). The explanation of the dazzling variety of morphologies observed, which include not only axisymmetric (elliptical and bipolar) shells but also multipolar structures, multiple co-axial shells, highly collimated (jet-like or knotty) point symmetric, or corkscrew-like features, etc. (e.g., Meixner et al. 1999; Sahai et al. 2007a, 2011b; Ueta et al. 2007; Siódmiak et al. 2008; Lagadec et al. 2011, and references therein), is probably the most exciting yet least understood problem in these late evolutionary stages.
Before Hubble Space Telescope (HST) imaging revealed the wide range of complex morphologies in PPNs and PNs, the favored model for explaining the break from spherical symmetry in PN morphologies involved the interaction between a fast isotropic pAGB wind with an equatorially dense AGB CSE—the so-called generalized interacting-stellar-winds (GISW) model (Calvet & Peimbert 1983; Balick 1987). Although the GISW paradigm has been successful for explaining the large-scale shapes of round, elliptical, and bilobed PNs, this model, by itself, cannot account for the complicated structural and kinematic patterns displayed by most PPNs (see, e.g., the review paper on PN shaping by Balick & Frank 2002). As suggested by Sahai & Trauger (1998), these features could be explained by underlying jets or collimated, fast winds (which may be episodic, have multi-directed components, and/or exhibit time-variable directionality) actively shaping the AGB CSEs. In spite of the growing evidence of the effects of collimated, fast pAGB winds sculpting the AGB CSEs from the inside, the problem of explaining the morphology and dynamics of PPNs and young PNs (yPNs) still persists and the mechanism that could power and collimate pAGB ejections remains a mystery.
Together with PPNs, observationally recognized by prominent aspherical nebulosities surrounding a central pAGB star, there is a second class of pAGB objects with pAGB central stars, strong evidence for medium-sized (∼50 AU) disks, and without discernible nebulosities (van Winckel 1999). This latter class, called disk-prominent pAGB objects or dpAGB objects (Sahai et al. 2011a), is not represented in our sample. A third small class of objects appear to show well-developed PPN-like morphologies and fast outflows but have AGB central stars (e.g., OH 231.8+4.2; Bujarrabal et al. 2002, and references therein)—a few examples of such objects are included in our sample. The classification of these objects as early PPNs is not unreasonable, however, the discrepancy between the evolutionary status of their central stars (AGB mass-losing stars) and their surrounding nebulosities remain to be understood. One possibility is that these objects host interacting binary or multiple systems composed of the primary mass-losing AGB star and stellar or substellar companions. Thus this object class would include, e.g., sources like OH 231.8+4.2, with a main-sequence companion (Sánchez Contreras et al. 2004b), and symbiotic binary stars, with white dwarf companions (e.g., Corradi et al. 2000).
We have carried out optical/NIR imaging surveys as well as an optical spectroscopic survey searching for systematic departures from sphericity and fast outflows among late-AGB and early-pAGB stars, with the goal of probing, in their infancy, the physical processes that produce asphericity (e.g., Sahai et al. 2007a; Sánchez Contreras et al. 2006b, 2008). This paper presents a complementary study at millimeter wavelengths of the CO (and continuum) emission in a sample of such objects. These CO data probe the cool, dense molecular gas, which comprises the most massive component of their envelopes.
Molecular envelopes in PPNs often show two different kinematic components, slow and fast, which are responsible for the intense-narrow core and the weak-broad wings observed in the emission profile of CO rotational lines (Olofsson 1996; Bujarrabal et al. 2001, and references therein). PPN studies based on high-angular resolution CO maps show that the fast molecular component corresponds to massive (∼0.1–1 M☉) bipolar outflows (e.g., Cox et al. 2000; Alcolea et al. 2001; Castro-Carrizo et al. 2002, 2005, 2010; Huggins et al. 2004; Meixner et al. 2004; Sánchez Contreras et al. 2006a; Alcolea et al. 2008). These outflows are thought to result from the acceleration of the AGB wind (dense and slow) by shock interaction with underlying collimated pAGB ejections (fast but relatively tenuous). The fast, bipolar CO outflows of PPNs often follow a so-called Hubble-flow kinematics, i.e., radial expansion with speeds increasing linearly with the distance from the nucleus, suggesting that they have been accelerated in a brief (≲100 yr) event (see references above).
The slow molecular component in PPNs/yPNs is normally attributed to the remnant AGB CSE. In some PPNs, this remnant is observed as an extended, round halo expanding at low velocity surrounding the bipolar outflows (e.g., as in the PPN CRL 618, Sánchez Contreras et al. 2004a). In many PPNs, part of the slow component arises in a large (≈1016 cm) and massive (≳0.1 M☉) toroidal structure expanding orthogonally to the lobes (e.g., Zweigle et al. 1997; Sánchez Contreras & Sahai 2004a; Huggins 2007). The origin of these dense tori is unclear: They could represent the remnant AGB CSE left after fast collimated outflows have excavated diametrically opposed holes in a spherical envelope, or they could result from equatorially enhanced mass loss during the late-AGB phase. Part of the low-velocity molecular emission in PPNs may also arise in a compact rotating disk around the star; these disks have been proposed to be the main agents for the launch and collimation of pAGB winds (Soker 2002; Frank & Blackman 2004, and references therein). To date, the presence of a compact disk in slow Keplerian rotation has been confirmed in one PPN, the Red Rectangle (Bujarrabal et al. 2003).
Our CO survey is motivated with the aim of building up a large sample of pAGB objects (but also late-AGB stars and yPNs) with CO detections and interferometric CO maps. This is needed for an improved characterization of their molecular envelopes and making progress in our limited understanding of the PPN/PN shaping process.
Interferometric observations have several advantages over single-dish studies. In addition to the obvious advantage of the higher-angular resolution achieved, interferometric techniques filter out extended emission from the interstellar medium (ISM), which often adversely affects single-dish spectra (e.g., Heske et al. 1990). One limitation of interferometric observations is the lack of information at zero spacing, which imposes a limit on the extent of the largest nebular structure to which the interferometer is sensitive. The lack of short-spacing results in a partial loss of the flux from extended structures with uniform surface brightness if these have large angular sizes compared with the fringe spacings corresponding to the shortest baselines.
The vast majority of CO surveys of evolved stars have been performed so far using single-dish telescopes (Knapp & Morris 1985; Likkel et al. 1991; Loup et al. 1993; Nyman et al. 1992; Olofsson et al. 1993; Bujarrabal et al. 2001; Kemper et al. 2003; Ramstedt et al. 2008, etc.). Among these surveys, that by Bujarrabal et al. (2001) contains the largest proportion of PPNs. A major result from this work is that fast molecular outflows in most PPNs have far too much linear momentum to be powered by dust radiation pressure, which is the wind-driving mechanism during the AGB phase. This observational result invalidates the radiation-driven wind assumption of the GISW model.
The first interferometric CO survey of evolved stars was that by Neri et al. (1998), which contained medium resolution (≳10'' at 3 mm) maps of the 12CO J = 1–0 and J = 2–1 transitions on a sample of 46 objects classified as AGB (∼75%) and pAGB (∼25%) stars. More recently, Fong et al. (2006) presented a small 12CO (J = 1–0) imaging survey of eight evolved stars (two AGBs, five PPNs, and one PN) with a mean angular resolution ∼56. A systematic study of CSEs around 46 AGB stars and nine pAGB objects has been carried out recently; results of a sub-sample of 16 objects from this survey are reported in Castro-Carrizo et al. (2010).
In addition to the aforementioned surveys, a few among the most extended, strongest CO emitters, and "interesting" PPNs have been mapped using interferometric techniques (see references provided before in this section). Detailed studies of individual objects are extremely valuable, however, the yet small number of PPNs with published high-angular resolution maps comprehensively analyzed (to our knowledge <15) prevents generalization of their results. Moreover, these individual works are performed by independent groups using differing analysis and interpretative techniques, which is an important limitation for statistical studies. Also, whether "interesting" means "representative" or, rather, is an euphemism for "peculiar" is unclear in some cases. In summary, surveys of large samples of pAGB objects observed in uniform conditions and similarly analyzed are needed to derive general conclusions.
This is the first paper in a series resulted from our SNAPshot CO 1–0 emission survey of evolved stars with the millimeter-wavelength array of the Owens Valley Radio Observatory (OVRO) referred to as "OPACOS": OVRO Post-AGB CO(1–0) emission Survey. Here, we present the data and main observational results, and derive important envelope parameters. In a forthcoming paper, correlation of such CO-derived parameters with other stellar and envelope properties obtained from multiwavelength data are investigated and discussed.
2. OBSERVATIONS AND DATA REDUCTION
2.1. The Sample
The objects observed in this work are listed in Table 1, where we provide the evolutionary class, the spectral type of the central star, the morphology of the optical and/or NIR nebula, the chemistry, the 12 μm to 25 μm IRAS flux ratio (f12/f25), the 60 μm IRAS flux (f60), and the distance to the source. References for these and other properties are given for individual sources in Section 3.2. For the optical/NIR morphology, we have adopted the primary classification system by Sahai et al. (2007a), which establishes four main classes of nebular shapes: bipolar (B), multipolar (M), elongated (E), and irregular (I). Objects with star-like appearance in the HST images are denoted as stellar (S). For the C-rich AGB star IRAS 23166+1655 (AFGL 3068), we have added a special category "spiral" to indicate the shape of the envelope pattern observed in the HST images (see Section 3.2.24 and Mauron & Huggins 2006). There are three program objects with no optical/NIR counterparts, indicative of very thick dust envelopes.
Table 1. Properties of the Sources in Our Survey OPACOS
| Source | Other | Objecta | Spectral | Morphologyb | Chemistryc | f12/f25 | f60 | dd |
|---|---|---|---|---|---|---|---|---|
| (IRAS No.) | Names | Class | Type | (Opt./NIR) | (Jy) | (kpc) | ||
| 03206+6521 | OH 138.0+7.2 | AGB | M? | S | O | 0.71 | 37.5 | 3.4 |
| 18055−1833 | V* AX Sgr | PPN | G8Ia | S | O | 0.73 | 33.1 | 2.0 |
| 18135−1456 | OH 15.7+0.8 | PPN | G5-K0 | S | O | 0.25 | 158 | 2.5 |
| 18167−1209 | OH 18.5+1.4 | PPN | F7 | S | O | <0.16 | 21.3 | 7.0 |
| 18276−1431 | OH 17.7−2.0 | PPN | A0-K5 | B | O | 0.17 | 120 | 3.0 |
| 18348−0526 | OH 26.5+0.6 | AGB | M | † | O | 0.57 | 463 | 1.1 |
| 18420−0512 | OH 27.5−0.9 | PPN | M1 | B,ml | O | 0.04 | 26.2 | 6.0 |
| 18460−0151 | OH 31.0−0.2 | PPN(wf) | ... | † | O | <0.64 | <277 | 7.0 |
| 18560+0638 | OH 39.7+1.5 | AGB | M | † | O | 0.83 | 101 | 1.4 |
| 19024+0044 | OH 35.3−2.6 | PPN | G0-5 | M | O | 0.06 | 42.5 | 10 |
| 19134+2131 | PPN(wf) | ... | B | O | 0.32 | 8.56 | 8 | |
| 19234+1627 | PN G051.5+00.2 | PN | ... | E | ... | <0.22 | 15.5 | 9.5 |
| 19255+2123 | OH 56.1+2.1,K3-35 | PN | >60kK | B | O | 0.08 | 48.2 | 4.0 |
| 19292+1806 | OH 53.6−0.2 | PPN | B? | B | O | <0.10 | 28.8 | 5.0 |
| 19306+1407 | yPN | B0-1 | B | C+O | 0.06 | 31.8 | 5.5 | |
| 19374+2359 | yPN | B3-6 | B | O | 0.24 | 70.9 | 11 | |
| 19475+3119 | HD331319 | PPN | F3 | M | O | 0.01 | 55.8 | 3.5 |
| 19548+3035 | RAFGL2477 | PPN | M6 | S | C+O | 0.69 | 46.7 | 4.0 |
| 19566+3423 | AGB | ... | S | C+O | 0.42 | 49.0 | 9.0 | |
| 20000+3239 | GLMP 963 | PPN | G8I(simb) | E/B | C | 0.21 | 30.0 | 3.0 |
| 20462+3416 | LS II+34 26 | yPN | B1.5 | E | O | :0.02 | 12.1 | 2-5 |
| 22036+5306 | GLMP 1052 | PPN | F4-7 | B | O | 0.18 | 107 | 4.0 |
| 22177+5936 | OH 104.9+2.4 | AGB | M | S | O | 0.54 | 90.7 | 2.4 |
| 22223+4327 | V448 Lac | PPN | F8Ia | B | C | 0.06 | 22.4 | 4.0 |
| 22568+6141 | PN G110.1+01.9 | yPN | B0 | B | ... | 0.12 | 20.8 | 6.0 |
| 23166+1655 | AFGL3068, LL Peg | AGB | C | spiral | C | 0.91 | 248 | 1.1 |
| 23304+6147 | GLMP 1078 | PPN | G2Ia | B(M?) | C | 0.19 | 26.6 | 4.0 |
Notes. References for these and other properties are given for the individual sources in Section 3.2. aAGB = asymptotic giant branch star; PPN = pre-planetary nebula; yPN = young planetary nebula; PN= planetary nebula; wf = "water fountain"—see the text in Sections 1 and 2.1. bB = bipolar, M = multipolar, E = elongated, I = irregular, S = stellar (i.e., unresolved), ml = minor lobes, † = unidentified optical counterpart. cO = oxygen rich; C = carbon rich; C+O = mixed chemistry. dValues derived from this work and others as discussed in Section 3.2, except for IRAS 19134+2131 (Imai et al. 2007) and IRAS 20462+3416 (Parthasarathy 1993).
Download table as: ASCIITypeset image
The sources in our sample were mainly selected from our large list of candidate PPNs, based on their IRAS colors and fluxes and, for OH/IR stars, on the strength of their OH maser emission (for details see Sahai et al. 2007a). Many of these have been confirmed to be bona fide PPNs based on our optical/NIR imaging/spectroscopic studies (e.g., Sahai et al. 2007a; Sánchez Contreras et al. 2006b, 2008). The spectral energy distributions (SEDs) of our targets, characterized by f12 < f25, indicate a recent cessation of the heavy AGB mass-loss process, which is believed to signal the beginning of pAGB evolution. The complex, aspherical morphologies of most objects in our sample as seen in high-angular resolution optical/NIR images indicate that the mechanism responsible for the breaking up of the spherical symmetry has been, and may still be, at work in these sources. Our sample also includes two members of a particularly interesting subclass of PPNs referred to as "water fountain" (labeled "wf," Table 1). These objects have high-velocity jets (50–150 km s−1) traced by H2O maser emission (e.g., Likkel et al. 1992; Imai et al. 2007; Yung et al. 2011). It is believed that in these objects the interaction of collimated, fast outflows with the AGB CSE has started ∼50–100 years ago.
Our sample is characterized by low far-infrared (IR) fluxes and, therefore, weak CO emission (given the relationship between the CO and far-IR emission; Bujarrabal et al. 1992). The IRAS 60 μm fluxes of our targets are in the range [8.6–463] Jy, with 74% of the sample having f60 < 100 Jy and with a median value of f60 ∼ 43 Jy (Figure 1, left panel). Our targets fill in the gaps in the IRAS two-color diagram where pAGB stars and PNs are expected to be located and that were scarcely populated by object samples in earlier survey studies (Figure 1, right panel). The distribution of our targets in the NIR color–color diagram (Figure 2) shows clear H − K excesses for a fraction of them, which are located above the blackbody line, indicative of the presence of warm dust near the star.

Figure 1. Left: histogram with the IRAS 60 μm flux of our sample. Right: distribution of our targets in the IRAS two-color diagram (large open circles). The 10 regions that separate different sorts of gas-dust envelopes defined by van der Veen & Habing (1988) are outlined. The IRAS colors of the targets in the interferometric CO surveys by Neri et al. (1998), Fong et al. (2006), and Castro-Carrizo et al. (2010)—referred to as NFCC sample—are shown for comparison (gray dots).
Download figure:
Standard image High-resolution image
Figure 2. Distribution of our targets in the (J−H)–(H−K) color–color diagram. Triangles are used for upper limits. For the PN IRAS 19234+1627 (asterisk symbol), the NIR colors are measured at the walls of its extended, shell-like nebula. For the rest of the sources, the NIR magnitudes used are integrated over the whole envelope. The solid line represents the locus of blackbody emitters for temperatures in the range 500–8000 K; the tick marks correspond to the temperatures indicated. The reddening vector for AJ = 1 mag is shown.
Download figure:
Standard image High-resolution imageConsidering our target selection criteria (see above), we do not expect our sample to be strongly biased toward any of the properties listed in Table 1, except maybe to O-rich sources. However, we add a cautionary note for readers who wish to generalize some of the results from this work: (1) Our sample size is still modest and (2) the various classes of objects may or may not be represented in their correct proportions.
Finally, our original sample also included two objects, IRAS 05506+2414 and IRAS 19520+2759, considered to be pAGB candidates in our earliest surveys based on their PPN-like IRAS colors and OH maser emission (see, e.g., Sánchez Contreras et al. 2008). Our 12CO (J = 1–0) OVRO maps as well as additional data sets favor a young stellar object nature in both cases (Sahai et al. 2008; Palau et al. 2012) and, therefore, these sources will not be discussed in this paper.
2.2. Interferometric Mapping with OVRO
Interferometric mapping of the 12CO (J = 1–0) transition for 27 objects was carried out using the six 10.4 m antennae millimeter array of the OVRO, which is now part of The Combined Array for Research in Millimeter-wave Astronomy (CARMA4). Observations were performed as part of a CO SNAPshot survey program in different runs between 2002 and 2004. A log of the observations is provided in Table 2, with the list of sources, coordinates of the tracking center, observation dates, array configurations, the half-power beam width (HPBW), the orientation of the clean beam major axis, gain, passband and flux calibrators, and baseline ranges (in the uv plane).
Table 2. Observing Log
| Source | R.A.a | Decl.a | Date | OVRO | HPBW | P.A. | Calibrators | UV Range |
|---|---|---|---|---|---|---|---|---|
| (IRAS No.) | (J2000) | (J2000) | (mm-dd-yyyy) | Config. | ('' × '') | (°) | (kλ) | |
| 03206+6521 | 03h25m08 80 80 |
+65°32'0700 |
09-18-2003 | C | 9.7 × 7.7 | 59.7 | 3c454.3, 3c84,j0359+509 | 6.2–18.4 |
| 18055−1833 | 18h08m2647 |
−18°33'1080 |
05-11-2003, 05-14-2003 | C | 12.2 × 9.4 | 12.1 | 3c273, j1833-210, Neptune | 4.0–19.0 |
| 18135−1456 | 18h16m2558 |
−14°55'1524 |
03-13-2004 | E | 4.2 × 3.6 | −9.0 | 3c273, j1833-210, Uranus | 7.1–44.2 |
| 18167−1209 | 18h19m3545 |
−12°08'1248 |
02-28-2003, 03-3-2003 | E | 7.3 × 4.6 | 69.2 | 3c345, j1833-210, Neptune | 7.5–41.2 |
| 18276−1431 | 18h30m3074 |
−14°28'5628 |
09-29-2002 | C | 10.7 × 7.7 | 78.3 | 3c273, j1833-210, Uranus | 4.1–18.9 |
| 18348−0526 | 18h37m3252 |
−05°23'5784 |
02-17-2003 | E | 4.2 × 3.7 | −48.4 | 3c273, j1743-038, Uranus | 7.7–46.0 |
| 18420−0512 | 18h44m4178 |
−05°09'1440 |
02-19-2003, 03-23-2004 | E,L | 5.1 × 3.6 | −9.5 | 3c273, j1743-038, Neptune | 4.4–46.0 |
| 18460−0151 | 18h48m4323 |
−01°48'2772 |
12-03-2003 | E | 4.7 × 3.7 | −56.7 | 3c273, j1743-038, Uranus | 8.8–45.8 |
| 18560+0638 | 18h58m3008 |
+06°42'5770 |
09-23-2002 | C | 10.5 × 6.6 | 82.9 | 3c84, 3c273, j1925+211, Neptune | 4.1–21.1 |
| 19024+0044 | 19h05m0211 |
+00°48'5328 |
10-23-2002 | L | 5.0 × 3.5 | −21.3 | 3c454.3, j1751+096 | 4.1–44.2 |
| 19134+2131 | 19h15m3528 |
+21°36'3168 |
05-31-2003, 09-27-2003 | C | 11.7 × 7.3 | 74.8 | 3c345, j1925+211, Uranus | 4.6–21.1 |
| 19234+1627 | 19h25m4059 |
+16°33'0468 |
05-29-2003 | C | 10.1 × 6.2 | 78.7 | 3c345, 3c454.3, j1925+211 | 5.7–20.7 |
| 19255+2123 | 19h27m4423 |
+21°30'0648 |
10-21-2002, 01-23-2003 | L,C | 6.4 × 5.8 | −77.6 | 3c84, 3c345, j1925+211, Uranus | 4.0–44.3 |
| 19292+1806 | 19h31m2526 |
+18°13'0912 |
09-26-2002 | C | 10.3 × 6.2 | 84.7 | 3c454.3, j1925+211, Uranus | 4.2–21.2 |
| 19306+1407 | 19h32m5500 |
+14°13'3504 |
01-19-2003, 01-23-2003 | C | 10.0 × 6.3 | 75.4 | 3c84, 3c273, j1925+211, Uranus | 4.0–21.2 |
| 19374+2359 | 19h39m3557 |
+24°06'2772 |
05-06-2003, 09-18-2003 | C | 9.8 × 7.0 | 71.6 | 3c84, 3c273, j1925+211, Uranus | 4.1–21.0 |
| 19475+3119 | 19h49m2974 |
+31°27'1630 |
01-29-2003, 05-22-2003 | C | 9.6 × 6.9 | 82.3 | 3c345, j2015+371,Uranus | 4.1–21.2 |
| 19548+3035 | 19h56m4843 |
+30°43'5988 |
03-23-2003 | L | 4.3 × 3.0 | −34.8 | 3c84, 3c273, j2015+371 | 4.1–44.4 |
| 19566+3423 | 19h58m3220 |
+34°31'3252 |
01-28-2003 | C | 9.8 × 6.7 | 84.0 | 3c345, j2015+371,Uranus | 5.1–21.2 |
| 20000+3239 | 20h01m5940 |
+32°47'3040 |
09-20-2003 | C | 10.2 × 6.4 | 65.2 | 3c454.3, j2015+371, Uranus | 5.4–19.1 |
| 20462+3416 | 20h48m1663 |
+34°27'2431 |
05-28-2003, 10-05-2003 | C | 10.6 × 6.9 | 82.8 | 3c345, 3c454.3, j2015+371 | 4.7–21.1 |
| 22036+5306 | 22h05m3043 |
+53°21'3276 |
09-21-2002, 05-29-2004 | C,L,H | 2.6 × 2.1 | −80.9 | 3c84, 3c345, bllac, Uranus | 5.0–92.0 |
| 22177+5936 | 22h19m2815 |
+59°51'2340 |
05-13-2003 | C | 9.6 × 7.7 | 89.4 | 3c84, 3c273, j2038+513 | 4.0–19.6 |
| 22223+4327 | 22h24m3143 |
+43°43'1098 |
03-5-2003, 12-22-2003 | L,H | 3.1 × 2.4 | −38.3 | 3c84, 3c345, bllac, Uranus | 5.3–93.2 |
| 22568+6141 | 22h58m5122 |
+61°57'4321 |
03-7-2003, 04-16-2003 | L | 5.2 × 3.2 | −47.9 | 3c84, 3c345, j0102+584, Neptune | 5.4–44.4 |
| 23166+1655 | 23h19m1224 |
+17°11'3336 |
03-13-2003, 12-13-2003 | L,H | 3.0 × 2.2 | −8.0 | 3c84, 3c454.3g, Neptune | 6.2–93.2 |
| 23304+6147 | 23h32m4490 |
+62°03'5040 |
01-27-2003, 12-9-2003 | C,E,H | 2.9 × 2.7 | −68.4 | 3c84, 3c345, j0102+584, Uranus | 4.0–88.4 |
Note. aCoordinates of the phase tracking center.
Download table as: ASCIITypeset image
For most sources, the digital spectral line correlator was configured to provide a total bandwidth of 128 MHz (∼330 km s−1) with a channel spacing of 1 MHz (∼2.6 km s−1). In some cases, a different configuration was used, providing a smaller bandwidth of 90 MHz (∼235 km s−1). These bandwidths cover the full width of the 12CO profiles expect for two objects, IRAS 22036+5306 and IRAS 19374+2359, which were discovered to have exceptionally broad (>300 km s−1) emission wings. For some targets, we performed simultaneous observations of the 13CO and C18O (J = 1–0) transitions. For 13CO (J = 1–0), the bandwidth and spectral resolution are similar to that of 12CO (J = 1–0). For C18O (J = 1–0), the units of the cross-correlator were set to bandwidths of 32 MHz (∼85 km s−1) with channel spacing of 1 MHz (2.7 km s−1). The 2.6 mm continuum emission was observed simultaneously using the dual-channel analog continuum correlator. Our continuum maps have a bandwidth of 3 GHz since one of the four 1 GHz wide bands of the continuum correlator, which contained the 12CO emission line, has not been used to generate the final maps.
Data calibration was performed using the MMA software package (Scoville et al. 1993). Gain calibration was done against nearby quasars that were observed at regular time intervals of ∼15–20 minutes before and after each target observation. Bright quasars were also observed at the beginning and end of the track for passband calibration. Absolute flux calibration was obtained by observing planets. Quasars were also used as secondary flux calibrators after carefully examining their flux history. Flux calibration errors could be of up to 20%–30%.
In one case, the yPN IRAS 19255+2123, the relatively intense continuum emission had to be subtracted from the original 12CO and 13CO (J = 1–0) visibilities to produce pure line emission maps; this was done using the MIRIAD task uvlin.
Reconstruction of the maps from the visibilities was done using standard tasks of the Multichannel Image Reconstruction, Image Analysis and Display (MIRIAD) software. After Fourier transforming the measured visibilities with robust weighting, data were cleaned and maps restored.
3. RESULTS
We have searched for CO emission in a total of 27 evolved stars (Tables 1 and 2). Circumstellar 12CO (J = 1–0) emission has been detected in 24 targets (Table 3), i.e., all objects except for IRAS 19134+2131, which belongs to the water-fountain subclass of PPNs, the PN IRAS 19234+1627, and the yPN IRAS 20462+3416. For these sources, which exhibit the lowest f60 fluxes in our sample (<16 Jy), we provide new upper limits to the intensity of the 12CO emission.
Table 3. CO Line Parameters
| Source | Transition | VLSR | FWHM | FWZI | ICO [rms = 1σ] | ∫ICOdVa |
|---|---|---|---|---|---|---|
| (IRAS No.) | (v = 0) | (km s−1) | (km s−1) | (km s−1) | (Jy beam−1) | (Jy km s−1) |
| 03206+6521‡ | 12CO (J = 1–0) | −36.5[±0.7] | 16 | 16 | 0.29 [0.04] | 3.2 [±0.3] |
| 18055−1833 | 12CO (J = 1–0) | 25[±2] | 50 | 50 | 0.82 [0.04] | 29.5 [±0.5] |
| ... | 13CO (J = 1–0) | ... | ... | ... | ... [0.04] | ... |
| 18135−1456 | 12CO (J = 1–0) | 0[±1] | 23 | 50 | 0.99 [0.07] | 30 [±2] |
| 18167−1209 | 12CO (J = 1–0) | 177[±2] | 16b | 16b | 0.25 [0.08] | 3.5 [±0.5] |
| ... | 13CO (J = 1–0) | ... | ... | ... | ... [0.05] | ... |
| 18276−1431* | 12CO (J = 1–0) | 62[±2] | 23 | 34 | 1.35 [0.08] | 27.5 [±0.5] |
| ... | 13CO (J = 1–0) | 71[±2] | 40 | 40 | 0.16 [0.06] | 4 [±1] |
| 18348−0526* | 12CO (J = 1–0) | 30[±1] | 18 | 24 | 0.59 [0.05] | 12.5 [±0.5] |
| ... | 13CO (J = 1–0) | 28[±4] | 22 | 22 | 0.1 [0.03] | 3.5 [±0.5] |
| 18420−0512 | 12CO (J = 1–0) | 106[±1] | 24 | 34 | 0.49 [0.04] | 11.5 [±0.5] |
| ... | 13CO (J = 1–0) | 104[±2] | 29 | 33 | 0.13 [0.03] | 3.5 [±1.5] |
| 18460−0151 | 12CO (J = 1–0) | 126[±1] | 25 | 32 | 0.51 [0.04] | 11.6 [±0.3] |
| 18560+0638‡ | 12CO (J = 1–0) | 17b | 26 | 43 | 0.45 [0.05] | 11.3b |
| ... | 13CO (J = 1–0) | 20[±1] | 25 | 35 | 0.20 [0.03] | 3.5 [±0.8] |
| ... | C18O (J = 1–0) | ... | ... | ... | ... [0.03] | ... |
| 19024+0044* | 12CO (J = 1–0) | 50[±1] | 18b | 33b | 0.79 [0.05] | 11.8 [±0.3] |
| 19134+2131* | 12CO (J = 1–0) | ... | ... | ... | ... [0.03] | ... |
| 19234+1627* | 12CO (J = 1–0) | ... | ... | ... | ... [0.05] | ... |
| 19255+2123‡ | 12CO (J = 1–0) | 23[±3] | 25 | 36 | 0.23 [0.04] | 8.9 [±0.4] |
| ... | 13CO (J = 1–0) | 24b | 22b | 22b | 0.16 [0.03] | 3.0 [±1.5] |
| 19292+1806 | 12CO (J = 1–0) | 11[±1] | 21 | 30 | 0.94 [0.05] | 21.5 [±0.5] |
| ... | 13CO (J = 1–0) | 12[±2] | 20 | 24 | 0.26 [0.04] | 4 [±1] |
| ... | C18O (J = 1–0) | ... | ... | ... | ... [0.03] | ... |
| 19306+1407* | 12CO (J = 1–0) | 98[±1] | 5 | 16b | 0.28 [0.04] | 3.0 [±0.4] |
| ... | 13CO (J = 1–0) | 107* | ... | ... | ≲0.1 [0.03] | ... |
| 19374+2359 | 12CO (J = 1–0) | −37[±2] | 95 | 160 | 0.54 [0.04] | 44.6 [±0.2] |
| ... | 13CO (J = 1–0) | −31[±4] | ... | ... | ≲0.1 [0.03] | 4 [±1] |
| 19475+3119 | 12CO (J = 1–0) | 17.7[±0.5] | 23 | 65 | 1.59 [0.04] | 38.1 [±0.3] |
| ... | 13CO (J = 1–0) | 17.7[±0.5] | 22 | 30 | 0.52 [0.03] | 12 [±1] |
| 19548+3035 | 12CO (J = 1–0) | 5.3[±0.5] | 32 | 45 | 1.37 [0.04] | 157 [±3] |
| ... | 13CO (J = 1–0) | 5.9[±0.8] | 30 | 44 | 0.4 [0.03] | 20 [±2] |
| 19566+3423* | 12CO (J = 1–0) | −40[±2] | 13 | 47b | 0.27 [0.04] | 4.1 [±0.6] |
| ... | 13CO (J = 1–0) | ... | ... | ... | ... [0.03] | ... |
| 20000+3239‡ | 12CO (J = 1–0) | 13.0[±0.5] | 15 | 28 | 2.09 [0.04] | 36 [±0.7] |
| 20462+3416* | 12CO (J = 1–0) | ... | ... | ... | ... [0.03] | ... |
| 22036+5306 | 12CO (J = 1–0) | −43[±1] | 31b | 120 | 0.47 [0.02] | 27.1 [±0.2] |
| ... | 13CO (J = 1–0) | −40[±1.5] | 25 | 90 | 0.16 [0.01] | 6.5 [±1.0] |
| ... | C18O (J = 1–0) | ... | ... | ... | ... [0.02] | ... |
| 22177+5936‡ | 12CO (J = 1–0) | −27[±1] | 27 | 38 | 0.49 [0.05] | 10.8 [±0.4] |
| ... | 13CO (J = 1–0) | −26[±3] | 22 | 27 | 0.17 [0.04] | 2 [±0.5] |
| 22223+4327 | 12CO (J = 1–0) | −30[±1] | 20 | 55 | 0.79 [0.03] | 36.3 [±0.5] |
| ... | 13CO (J = 1–0) | −31[±1.3] | 22 | 25 | 0.1 [0.02] | 2.0 [±0.3] |
| 22568+6141 | 12CO (J = 1–0) | −85[±2] | 20 | 55 | 0.30 [0.05] | 6.8 [±1.7] |
| ... | 13CO (J = 1–0) | ... | ... | ... | ... [0.04] | ... |
| 23166+1655 | 12CO (J = 1–0) | −30.1 [±0.5] | 18 | 33 | 2.52 [0.03] | 133.3 [±0.5] |
| ... | 13CO (J = 1–0) | −30 [±1] | 30 | 30 | 0.32 [0.02] | 14 [±2] |
| 23304+6147 | 12CO (J = 1–0) | −16.1 [±0.3] | 16 | 37 | 1.17 [0.03] | 48.5 [±0.5] |
| ... | 13CO (J = 1–0) | −13 [±]2 | 17 | 31 | 0.07 [0.02] | 1.3 [±0.4] |
Notes. First time 12CO (J = 1–0) detections from this work are boldfaced. Previous 12CO (J = 1–0) marginal detections and non-detections from older data sets are marked by ‡ and * symbols, respectively. aThis is the spatially integrated emission when the source is partially resolved (see Section 3.2). bUncertain value—see details in Section 3.2.
Download table as: ASCIITypeset image
We find 13 first-time detections in the 12CO (J = 1–0) line, some of which were preliminarily reported by us in Sánchez Contreras & Sahai (2004b). Out of these 13 sources, 11 are first-time detections of any CO transition; the other two, IRAS 18276−1431 and IRAS 18348−0256, had been detected previously in the J = 2–1 line (Heske et al. 1990). We included in our survey some sources where 12CO (J = 1–0) emission had been searched for in the past. Among these, we have confirmed the presence of circumstellar 12CO emission in IRAS 03206+6521, IRAS 18560+0638, IRAS 19255+2123, IRAS 20000+3239, and IRAS 22177+5936, with marginal (≲3σ) detections prior to these observations (see references in Section 3.2). For sources with previous 12CO (J = 1–0) circumstellar (>3σ) detections, we have improved the spatial resolution or/and sensitivity of older data sets.
For 18 sources we have also observed the 13CO (J = 1–0) transition, out of which 15 are detected (including one marginal detection in IRAS 19036+1407). No C18O (J = 1–0) detections are reported among the three targets observed in this transition.
Our 12CO (J = 1–0) maps are presented in Figure Set 3 (available in the electronic edition of the paper). The electronically available material is presented in a format similar to that shown in Figure 3 in the print edition (Figure 3.1 in the figure set). The 12CO and 13CO line profiles for circumstellar detections are shown in Figures 4 and 5. The line profiles from some of the targets are contaminated by narrow absorption or emission features from interstellar clouds that are also present in the interferometric maps.

Figure 3.
12CO (J = 1–0) maps of IRAS 19255+2123 from OPACOS shown as an example. Maps for all detected sources are available in the online version of the journal (Figures 3.1–3.25). Top: velocity-channel maps across the CO line profile. The channel LSR velocities are indicated within the boxes in km s−1 units. The contour level step is 40 mJy beam−1. In the last panel, the map of the 2.6 mm continuum is shown (gray scale and red contours); level spacing is −2σ, −1σ, 3σ, 6σ, 9σ, 12σ, 15σ, and higher levels in steps of 5σ (the value of σ = rms is provided in Table 4). The half-power beam width of the clean beam (HPBW; Table 2) is represented by the filled ellipse. Bottom left: velocity-integrated 12CO (J = 1–0) map. Level step and value of σ is shown in the top right corner of the box. The (0'', 0'') position corresponds to the phase tracking center (Table 2). Bottom right: maps of the 12CO (J = 1–0) emission integrated over the red and blue sides of the line (red and blue contours, respectively); the VLSR velocity range for the different profile components are indicated within the box (in units of km s−1). The CO maps are overplotted on the HST F606W optical image of the nebula. The white cross indicates the position of the 2.6 mm continuum emission peak. (The color figure and the complete figure set (25 images) are available in the online journal)
Download figure:
Standard image High-resolution image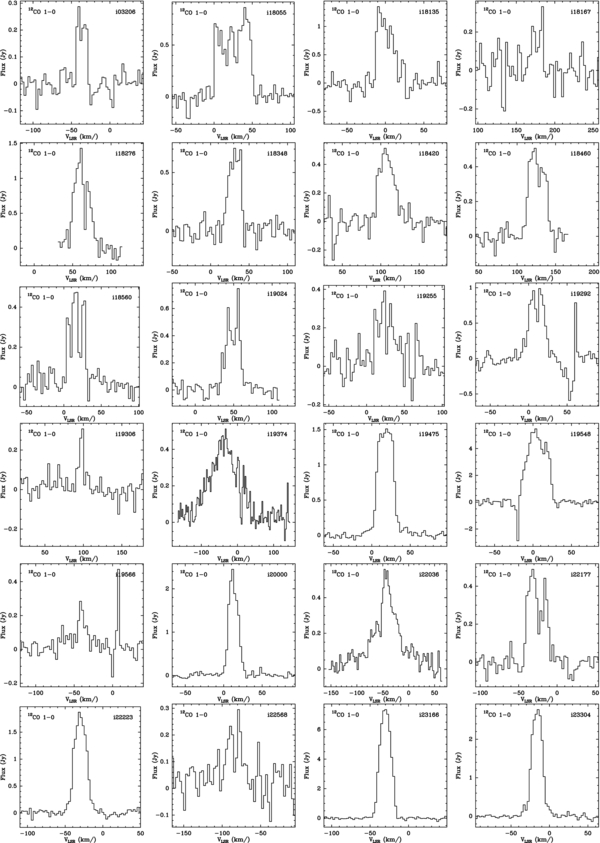
Figure 4. 12CO (J = 1–0) emission profile for circumstellar detections obtained from our maps integrating spatially over the CO-emitting region.
Download figure:
Standard image High-resolution image
Figure 5. Same as in Figure 4 but for the 13CO (J = 1–0) transition.
Download figure:
Standard image High-resolution imageLine parameters derived from the CO emission are presented in Table 3. In this table, (1) the center or systemic velocity, VLSR, has been obtained by fitting a symmetric function to the profile, (2) the line full width at half-maximum (FWHM) and the full width at zero intensity level (FWZI) have been measured directly on our spectra and have typical errors of one half and one full channel, i.e., 1.3 and 2.6 km s−1, respectively, (3) the parameter ICO is the peak surface brightness measured on the 2.6 km s−1 wide velocity-channel maps toward the target, and (4) the parameter ∫ICOdV is the CO flux spectrally and spatially integrated over the line profile and the CO-emitting region, respectively. As discussed in Section 4.1.1, interferometric flux losses are unlikely to affect most of our maps, except for IRAS 23166+1655, for which our 12CO (J = 1–0) interferometric data recover only 20%–30% of the total single-dish flux, and maybe for IRAS 22036+5306 and IRAS 22568+6141.
Our measurements of the 2.6 mm continuum flux are provided in Table 4 together with AKARI fluxes at 65 and 90 μm (f65 and f90). For 2.6 mm continuum non-detections, the rms noise (1σ) is given within brackets. Continuum emission is detected in 10 out of 27 targets, including the PN IRAS 19234+1627, which is a CO non-detection. In Table 4 we also list the values of the spectral slope, α, adopting a frequency power law for the continuum flux Sν∝να. The parameters α65 and α90 represent the continuum spectral slope between 2.6 mm and 65 μm and between 2.6 mm and 90 μm, respectively. For non-detections, lower limits to the spectral slope are computed adopting 3σ upper limits to the 2.6 mm fluxes. The continuum-emitting region is extended in 4 out of 10 sources, namely, IRAS 19234+1627, IRAS 19548+3035, IRAS 22568+6141, and IRAS 23166+1655.
Table 4. Continuum Fluxes
| Source | S2.6mm [1σ] | f65 | f90 | α65 | α90 |
|---|---|---|---|---|---|
| (IRAS No.) | (mJy) | (Jy) | (Jy) | ||
| 03206+6521 | ... [1.1] | 20.1 | 12.3 | >2.4 | >2.4 |
| 18055−1833 | ... [1.5] | 29.8 | 14.7 | >2.4 | >2.4 |
| 18135−1456 | 11 [2.7] | 142.4 | 54.7 | 2.5 | 2.5 |
| 18167−1209 | ... [1.7] | 15.8 | 7.3 | >2.2 | >2.2 |
| 18276−1431 | 11 [3.2] | 92.5 | 61.3 | 2.4 | 2.6 |
| 18348−0526 | ... [1.0] | 354.9 | 115.1 | >3.2 | >3.1 |
| 18420−0512 | ... [1.0] | 25.8 | 11.3 | >2.5 | >2.4 |
| 18460−0151a | ... [1.0] | 277.0L | 291.0: | ... | >3.5 |
| 18560+0638 | ... [1.2] | 61.7 | 30.3 | >2.6 | >2.7 |
| 19024+0044 | ... [1.7] | 30.2 | 16.0 | >2.4 | >2.4 |
| 19134+2131 | ... [0.6] | 7.8 | 6.3 | >2.3 | >2.4 |
| 19234+1627b | 72 [1.8] | 13.4 | 10.7 | 1.4 | 1.5 |
| 19255+2123 | 85 [1.0] | 37.7 | 19.5 | 1.7 | 1.6 |
| 19292+1806a | ... [1.5] | 28.8: | 319.0L | >2.3 | ... |
| 19306+1407 | ... [1.2] | 26.8 | 17.4 | >2.4 | >2.5 |
| 19374+2359 | ... [1.0] | 63.6 | 37.6 | >2.7 | >2.8 |
| 19475+3119 | 3.8 [0.7] | 44.7 | 27.0 | 2.5 | 2.6 |
| 19548+3035b | 6 [1.1] | 52.9 | 23.7 | 2.5 | 2.5 |
| 19566+3423 | ... [1.0] | 36.1 | 23.2 | >2.5 | >2.7 |
| 20000+3239 | 6 [1.1] | 24.8 | 14.9 | 2.3 | 2.3 |
| 20462+3416 | ... [0.8] | 8.1 | 7.0 | >2.2 | >2.4 |
| 22036+5306 | 8.9 [0.7] | 100.4 | 69.0 | 2.5 | 2.7 |
| 22177+5936 | ... [2.0] | 112.2 | 59.5 | >2.7 | >2.7 |
| 22223+4327 | ... [0.8] | 17.6 | 12.8 | >2.4 | >2.6 |
| 22568+6141b | 9 [1.4] | 10.8 | 11.0 | 1.9 | 2.1 |
| 23166+1655b | 11 [0.8] | 201.3 | 114.6 | 2.7 | 2.8 |
| 23304+6147 | ... [0.8] | 18.5 | 11.8 | >2.4 | >2.5 |
Notes. Fluxes are from the AKARI Point Source Catalogue. Whenever AKARI fluxes are not available, IRAS f60 and f100 fluxes are used to derive α60 and α100 instead of α65 and α90 (Section 3). aAKARI fluxes not available, IRAS fluxes used instead. IRAS quality flags as in IRAS catalog, i.e., L= upper limit, := moderate quality. bSpatially resolved emission. The value of the flux is obtained by integrating the emission over the continuum-emitting area.
Download table as: ASCIITypeset image
3.1. Envelope Parameterization
We have used our maps to characterize the CO and 2.6 mm continuum-emitting envelopes. In Table 5 we list the main envelope parameters obtained as follows. First, the MIRIAD task imfit has been used to fit a two-dimensional elliptical Gaussian to the maps. This procedure yields the position, major and minor axes (at half the maximum intensity), and orientation of the fitted ellipse and their errors, the latter being mainly dependent on the quality of the fit and the signal-to-noise ratio (S/N) in the maps. By comparing the output parameters of the fit with the shape and orientation of the clean beam, the algorithm determines whether a given source is extended or point-like.
Table 5. Deconvolved Geometry Parameters of the Envelope
| CO (J = 1–0) | 2.6 mm Continuum | |||||||||
|---|---|---|---|---|---|---|---|---|---|---|
| Source | VLSR Range | R.A., Decl. | θ1/2 | θmax | a/b | P.A. | R.A., Decl. | θ1/2 | a/b | P.A. |
| (IRAS No.) | (km s−1) | Offsets | ('') | ('') | (deg) | Offsets | ('') | (deg) | ||
| 03206+6521 | [−42.9:−29.9] | −42, +08 |
<2.2 | <16.2 | ... | ... | ... | ... | ... | ... |
| 18055−1833 | [+1.3:+50.7] | +03, +22 |
5.4 (0.4) | 23.7 | 1.9 (0.3) | −80 (30) | ... | ... | ... | ... |
| 18135−1456 | [−24.7:+19.4] | +23, +10 |
2.4 (0.3) | 10.7 | 1.7 (0.4) | −70 (20) | +16, +23 |
<1 | ... | ... |
| 18167−1209 | [+155.5:+197.1] | +09, +47 |
<1.4 | <9.1 | ... | ... | ... | ... | ... | ... |
| 18276−1431 | [+48.1:+76.7] | −13, −15 |
3.9 (0.6) | 16.7 | 1.6 (0.5) | +80 (10) | +0, −1 | <2.5 | ... | ... |
| 18348−0526 | [+15.7:+46.9] | +04, −14 |
3.8 (0.2) | 6.9 | 1.3 (0.2) | −85 (10) | ... | ... | ... | ... |
| 18420−0512 | [+61.5:+152.5] | −18, −24 |
2.1 (0.4) | 9.0 | 2.9 (0.8) | −1 (10) | ... | ... | ... | ... |
| 18460−0151 | [+110.5:+141.7] | −31, −27 |
1.0 (0.5) | 7.5 | 4.4 (4.0) | +50 (30) | ... | ... | ... | ... |
| 18560+0638a | [+1.0:+41.8] | +13, +05 |
3.6 (0.7) | 18.2 | 2.1 (0.7) | −50 (15) | ... | ... | ... | |
| 19024+0044 | [+32.5:+71.5] | −11, −23 |
1.0 (0.5) | 7.6 | ... | +45 (10) | ... | ... | ... | |
| 19234+1627 | ... | ... | ... | ... | ... | ... | −25, +00 |
5.1 (0.2) | 1.2 (0.1) | +4 (5) |
| 19255+2123 | [+10.9:+47.3] | −37, −35 |
5.7 (1.2) | 16.9 | 2.2 (0.7) | −85(15) | −30, −29 |
<1.6 | ... | ... |
| 19292+1806 | [−3.9:+27.3] | +11, +14 |
2.0 (0.2) | 18.3 | 1.4 (0.3) | −45 (10) | ... | ... | ... | ... |
| 19306+1407 | [+91.3:+106.9] | +02, +01 |
<2.0 | <13.6 | ... | ... | ... | ... | ... | ... |
| 19374+2359 | [−115.7:+32.5] | +06, −10 |
<2.1 | <18.5 | ... | ... | ... | ... | ... | ... |
| 19475+3119 | [−30.1:+60.9] | −24, −04 |
2.1 (0.2) | 14.9 | 1.6 (0.2) | +87 (5) | −3, +1 | <2.1 | ... | ... |
| 19548+3035 | [−17.1:+27.1] | −03, +05 |
5.4 (0.2) | 16.6 | 1.3 (0.2) | −11 (10) | +07, +03 |
1.5 (0.2) | 1.3 (0.3) | +50 (15) |
| 19566+3423 | [−49.5:−31.3] | +11, +14 |
<2.0 | <14.8 | ... | ... | ... | ... | ... | ... |
| 20000+3239 | [−1.3:+27.3] | +12, +23 |
2.1 (0.4) | 18.3 | 3.2 (0.8) | +11 (10) | +0, +4 | <2.1 | ... | ... |
| 22036+5306 | [−150.3:+52.6] | −12, +01 |
1.5 (0.2) | 5.5 | 1.8 (0.4) | +58 (15) | −13, +04 |
<0.6 | ... | ... |
| 22177+5936 | [−41.9:−10.7] | −38, −10 |
<2.1 | <16.6 | ... | ... | ... | ... | ... | ... |
| 22223+4327 | [−59.9:+2.5] | −01, +03 |
2.8 (0.1) | 9.6 | 1.2 (0.15) | +15 (15) | ... | ... | ... | ... |
| 22568+6141 | [−109.9:−47.5] | +33, +09 |
2.9 (2.0) | 11.3 | 5.6 (3.6) | −65 (10) | +28, +09 |
3.7 (2.4) | 4.4 (2.7) | −45 (15) |
| 23166+1655b | [−53.1:−11.5] | +52, −02 |
1.9 (0.2) | ... | 1.6 (0.3) | +40 (10) | +53, −02 |
1.6 (0.2) | 2.6 (0.6) | −70 (15) |
| 23166+1655b | [−53.1:−11.5] | +52, −02 |
5.1 (0.3)c | 11.7c | 1.2 (0.1) | −45 (10) | +53, −02 |
1.6 (0.2) | 2.6 (0.6) | −70 (15) |
| 23304+6147 | [−45.9:+16.5] | −10, −13 |
3.0 (0.1) | 8.6 | 1.4 (0.1) | −70 (10) | ... | ... | ... | ... |
Notes. See Section 3.2 for more details on parameter uncertainties. aParameters derived from our 13CO (J = 1–0) maps, which are less affected by ISM than the 12CO (J = 1–0) emission (Section 3.2). bResults from a double Gaussian ellipse fit to the CO map indicative of two (inner and outer) envelope components. c70%–80% flux losses in our interferometric CO data suggest a larger size for the outer molecular envelope.
Download table as: ASCIITypeset image
For extended sources (18 of 24 in our sample), imfit performs the beam deconvolution of the image and yields beam-deconvolved parameters such as the major and minor axes of the envelope at half the maximum intensity (θa and θb), and the orientation of θa measured from north to east (i.e., its position angle, P.A.). We have computed the geometric mean of θa and θb, which we refer to as half-maximum diameter, θ1/2, as well as the asymmetry parameter a/b ≡ θa/θb. In Table 5, we list these beam-deconvolved parameters together with the R.A. and decl. offsets of the peak intensity relative to the coordinates of the phase tracking center (in Table 2); errors to θ1/2, a/b, and P.A. are given within parenthesis. We also provide the velocity range of the velocity-integrated CO maps used to derive the envelope parameters as well as the maximum envelope extent (θmax), measured down to a 1σ level and deconvolved taking into account the size of the beam. For envelopes with large-scale asymmetries, θmax represents the geometric mean of the corresponding values along the major and minor axes.
Considering the typical S/N in our data, the angular size of the smallest structure that will appear extended in our maps (i.e., that will be observed with a half-maximum diameter larger than the beam) is θ1/2 ∼ 0.25 × HPBW. For this and larger sizes, imfit performs the beam deconvolution of the maps and derives beam-deconvolved envelope parameters. For smaller sizes, however, the algorithm indicates that the source is point-like; this enables placing upper limits to θ1/2 < 0.25 × HPBW for such point-like sources (also given in Table 5).
We stress that all the envelope parameters presented in Table 5 and discussed later in this paper have been derived from the original maps after beam deconvolution; therefore, the influence of the beam shape and orientation, which remains present in the original maps (shown in Figure Set 3), has been removed in such parameters.
3.2. Individual Sources
In this section, we discuss with some detail our targets with 12CO (J = 1–0) or 2.6 mm continuum detections. We first provide background information on the optical/NIR nebular morphology, the spectral type of the central star, chemistry, and previous molecular emission detections (including masers). Then we describe our data from OPACOS and the main envelope characteristics deduced from our maps. The nature of the 2.6 mm continuum emission is concisely discussed for each source (SED plots and modeling will be presented in Paper II). Finally, we discuss the distance d adopted for each object based on different estimates in the literature (if available) and from this work. The latter includes (1) the kinematic distance (dk) determined from the target radial velocity and the galactic coordinates (l,b) by assuming a simple galactic rotation law and adopting a value for the A Oort constant of 14.4 km s−1 kpc−1 and a galactocentric radius of 8.5 kpc (Kerr & Lynden-Bell 1986) and (2) the "luminosity" distance (dL) estimated by adopting an intrinsic total luminosity of 6000 L☉, typical of pAGB objects (e.g., Bloecker 1995), to be compared with the bolometric flux (Fbol) computed by integrating the source SED. The visual ISM extinction (AV) toward the target is also estimated using the numerical algorithm provided by Hakkila et al. (1997), or the IRSA Galactic Dust Reddening and Extinction (GDR&E) calculator5 for upper limits to AV. This value of AV is used to calculate the dereddened Fbol adopting a λ−1 extinction power law.
3.2.1. IRAS 03206+6521 (OH 138.0+7.2, RAFGL 5093)
This Mira variable (Groenewegen et al. 1999) appears to be point-like in our HST survey of candidate PPNs (Sahai et al. 2007a). It shows a strong 9.7 μm silicon dust feature (Heske et al. 1990) and SiO and OH maser emission (Nyman et al. 1998; Omont et al. 1993, and references therein), indicative of O-rich chemistry. The double-peaked OH maser line suggests a molecular shell expanding at about 9–10 km s−1 (Heske et al. 1990; Engels & Jiménez-Esteban 2007). No spectral type of the central star is available in the literature: Based on variability and O-rich chemistry, it is likely to be a late M type.
12CO (J = 1–0) single-dish spectra have been previously reported (Loup et al. 1993; Groenewegen et al. 1999). Our maps show a point-like 12CO (J = 1–0) emission source with a line profile centered at  km s−1 and full width similar to that spanned by the OH maser, ∼16 km s−1 (Figures 3.1 and 4). The 12CO profile and total line flux are comparable (within the errors) to the single-dish spectrum, therefore major flux losses are not present in our interferometric data.
Taking into account the galactic coordinates and radial velocity of IRAS 03206+6521 (l = 137 97, b = +0726, and
  km s−1), we derive a value of the kinematic distance of dk = 3.6 kpc. For this object, there is an estimate of the OH maser phase-lag distance, d = 3.4 kpc (Herman et al. 1986), which we adopt in this paper. (There is another estimate of the distance obtained by comparing the linear and angular sizes of the OH shell, d = 6.4 ± 3.6 kpc. This geometric distance is, however, quite uncertain because the linear size of the OH shell is indirectly estimated from a model and the angular size of the envelope has large error bars (04 ± 015); Chapman et al. 1984.) The bolometric flux of this object is Fbol ∼ 1250 L☉ kpc−2, from which we derive a value of dL = 2.2 kpc. For d ∼ 3 kpc, the visual ISM extinction toward the source is AV ∼ 0.7 mag and, therefore, the intrinsic (dereddened) bolometric flux is Fbol ∼ 1280 L☉ kpc−2, which implies a total luminosity of 1.2 × 10⁴ L☉ at d = 3 kpc. This is at the high end of the range of typical luminosities for pAGB objects.
3.2.2. IRAS 18055−1833 (V* AX Sgr)
This semiregular variable appears to be a bright point-like source in our HST survey of candidate PPNs (Sahai et al. 2007a). Its spectral type is ∼G8 Ia (G8-M2 as per the Variable Stars Catalogue). It has also been classified as a yellow supergiant (Mv = −7.2 to −8 mag, which is consistent with luminosity class I), so there is some possibility that its progenitor was a massive (≳8 M☉) star. Based on the presence of silicate dust features in the mid-IR and its classification as 2.SE7 by Sloan et al. (2003), this is an O-rich source. No SiO or OH maser emission has been detected so far (Nyman et al. 1998; Omont et al. 1993).
No CO emission detection has been reported for this object before: 12CO (J = 2–1) emission was unsuccessfully searched for by Omont et al. (1993). Our observations show a 12CO (J = 1–0) emission line with sharp edges centered at VLSR ∼ +25 km s−1 and rather affected by ISM contamination (Figures 3.2 and 4). The relatively large expansion velocity inferred from the CO line core (FWHM = FWZI ∼ 25 km s−1) supports a high-mass nature in this case. The velocity-channel maps show structured emitting regions; some of these structures are partially due to the presence of absorption and emission by intervening or nearby interstellar clumps. The velocity-integrated CO map shows an extended source with a beam-deconvolved half-maximum size of 75 × 39 and roughly oriented along the EW direction. Our data indicate a velocity gradient approximately in the perpendicular direction: The blue- and red-wing emission clumps are offset by ±1'' to the north and south, respectively (Figure 3.2, bottom-right panel). The elongation and velocity gradient found could indicate an equatorially dense expanding torus, however, the origin of the velocity gradient and asymmetry observed cannot be firmly established as predominantly circumstellar (but, rather, may be an artifact due to the strong ISM contamination) and, therefore, we consider this result very tentative.
The distance to IRAS 18055−1833 is extremely uncertain. Given the low galactic longitude and latitude of this source (l = 116, b = 07), the values of the near and far kinematic distance are unreliable due to non-circular motions close to the galactic center. The bolometric flux of this object is Fbol ∼ 5400 L☉ kpc−2, from which we derive a value of dL = 1.05 kpc. For d ∼ 1 kpc, the visual ISM extinction toward the source is AV = 0.5 mag and, therefore, the intrinsic (dereddened) bolometric flux is  L☉ kpc−2. For a larger value of d, e.g., dk(near) = 3.3 kpc, we expect AV = 2 mag and Fbol ∼ 1.1 × 10⁴ L☉ kpc−2, implying a rather high luminosity of ≈105 L☉ at such a distance, which is more typical of a massive supergiant star. Here we adopt d = 2 kpc, which is intermediate to dL and dk(near).
3.2.3. IRAS 18135−1456 (OH 15.7, RAFGL 5458)
This non-variable OH/IR star (van der Veen et al. 1989) appears as a point-like source in our HST survey of candidate PPNs (Sahai et al. 2007a; Siódmiak et al. 2008) and in 8 μm subarcsecond-resolution images (Lagadec et al. 2011). SiO, H2O, and OH masers have been detected, which, together with the presence of 9.7 μm silicate absorption, indicates an O-rich chemistry (Nakashima & Deguchi 2007; Omont et al. 1993; Deguchi et al. 2007, and references therein). The stellar spectral type is unknown, but since CO bandheads appear in absorption in the NIR spectrum of this object implying a photospheric temperature of ∼3000–5000 K (Oudmaijer et al. 1995), it may be G5-K0 (assuming it is a supergiant). The double-peaked OH maser emission profile is consistent with shell expansion at ∼15 km s−1 (Engels & Jiménez-Esteban 2007).
No CO emission has been previously reported for this object. Our data (Figures 3.3 and 4) show a 12CO (J = 1–0) emission line centered at  km s−1, and with a peculiar triple-peaked profile: There is a relatively intense central emission component with a full width similar to that spanned by the OH masers; at both red and blue sides of the line core (approximately at
  km s−1), there are two narrow emission features indicative of faster motions. The redshifted narrow feature is significantly altered by strong ISM contamination, especially in the range VLSR = [+22:+27] km s−1. A similar triple-peaked profile is observed in the 13CO (J = 1–0) single-dish spectrum of CRL 2688 by Quintana-Lacaci et al. (2007). As shown by those authors, a bipolar wind with a low inclination (with respect to the plane of the sky) leads to wings like those observed in IRAS 18135−1456, that is, narrow and detached from the central line core.
Our velocity-integrated 12CO map, excluding channels with ISM contamination, has a deconvolved half-maximum size of ∼31 × 18 with its major axis roughly oriented along the EW direction. The centroids of the red- and blue-velocity-integrated maps at VLSR = [+14.3:+11.7] and [−14.3:−11.7] km s−1, i.e., adjacent to the line core, are offset to the south and north, respectively (see Figure 3.3, bottom-right panel). The elongation of the velocity-integrated intensity map orthogonal to the NS velocity gradient is consistent with the bulk of the low-velocity emission arising in an expanding equatorial torus. The rms noise in our maps and ISM contamination of the circumstellar profile does not enable us to reliably locate the emission from the weak, broad wings of the profile (beyond ±14.3 km s−1) and, therefore, the presence of a fast bipolar flow, suggested by the triple-peaked profile, cannot be confirmed.
We detect 2.6 mm continuum emission from a point-like source with a total flux ∼11 mJy, consistent with thermal ≈100 K dust emission according to the slope of the SED from the IR to the millimeter-wavelength spectral region.
The distance to IRAS 18135−1456 is uncertain. Given its low galactic longitude (l = 157), the values of the near and far kinematic distance are unreliable due to non-circular motions close to the galactic center. We adopt here d = dL = 2.5 kpc, taking into account the bolometric flux of this object Fbol ∼ 980 L☉ kpc−2. For such a distance the visual ISM extinction is AV = 1.5–2.0 mag and, thus, the intrinsic (dereddened) bolometric flux is Fbol ∼ 1020 L☉ kpc−2, which implies an insignificantly smaller value of the distance, dL ∼ 2.4 kpc.
3.2.4. IRAS 18167−1209 (OH 18.5+1.4)
This OH/IR star appears as a point-like object in our optical HST survey of candidate PPNs (Sahai et al. 2007a). The central star has a spectrum consistent with an F 7 classification and it is surrounded by a compact Hα-emitting region (Sánchez Contreras et al. 2008). It shows strong OH maser emission with a double-peaked profile in the LSR range [+164.6:+187.8] km s−1; no SiO maser emission has been detected (van Langevelde et al. 1990; Nyman et al. 1998; Engels & Jiménez-Esteban 2007).
12CO (J = 1–0) and (J = 2–1) single-dish spectra have been reported by Winnberg et al. (1991): The emission is centered at VLSR = +176 km s−1 and its profile is consistent with expansion at ∼12 km s−1. Our data show a weak, spatially unresolved 12CO (J = 1–0) emission source around VLSR = +176 km s−1 (Figures 3.4 and 4). Our measurement of the line flux (Table 3) is smaller than that obtained from single-dish observations (∼0.5 ± 0.25 Jy). The flux discrepancy may be attributed, at least partially, to the large flux error bars in both data sets (of up to 50%). Although we cannot rule it out completely, we think our data, with relatively low resolution (HPBW ∼ 5''), are unlikely to be affected by significant interferometric flux losses, which would imply the presence of a CO envelope with an angular diameter ≳18''. The presence of such a large envelope is improbable because, as for most PPNs, the outer radius of the CO envelope is unlikely to be larger than few × 1017 cm (Neri et al. 1998), implying an upper limit to the angular radius of the CO-emitting nebula of less than ∼1'' given the probable large distance to this object (see the next paragraph).
As discussed by Winnberg et al. (1991), considering its galactic coordinates (l = 1852, b = +141), the radial velocity of IRAS 18167−1209,  km s−1, is close to the maximum allowable velocity for circular motions and, therefore, it is probably located near the tangent point, i.e., dk ∼ 7–8 kpc. Since the bolometric flux of this object is Fbol ∼ 100 L☉ kpc−2, we derive a very similar value for dL = 7.7 kpc. For d ∼ 7–8 kpc, the visual ISM extinction is AV = 1.5–3.5 mag and the intrinsic (dereddened) bolometric flux is Fbol ∼ 100–140 L☉ kpc−2, which consistently implies a similar value for dL of 6.5–7.6 kpc. No reliable OH maser phase-lag distance has been determined in this case because of its weak variability. We adopt a distance to IRAS 18167−1209 of d ∼ 7 kpc.
3.2.5. IRAS 18276−1431 (OH 17.7−2.0, AFGL 5497)
This young O-rich PPN has been imaged in our optical/HST and NIR/adaptive optics (AO) surveys of candidate PPNs (Sahai et al. 2007a; Sánchez Contreras et al. 2006b). It appears as a bipolar object with searchlight beams and arcs, and has been studied in detail by Sánchez Contreras et al. (2007). The spectral type of the central star is earlier than ∼K 5 (Le Bertre et al. 1989). The progressive disappearance of H2O maser emission is consistent with a recent drop of the mass-loss rate from ≈10−5 M☉ yr−1 to well below ≈10−7 M☉ yr−1 (Engels 2002). The non-detection of SiO masers in IRAS 18276−1431 is also consistent with its pAGB nature (Nyman et al. 1998). Strong OH maser emission is observed in a dense, equatorial region elongated in the direction of P.A. = 110°, i.e., approximately perpendicular to the bipolar lobes (Bains et al. 2003). The bipolar lobes are marginally resolved in subarcsecond-resolution 8–12 μm images by Lagadec et al. (2011).
Single-dish 12CO (J = 2–1) emission has been previously reported by Heske et al. (1990). The 12CO (J = 1–0) transition was observed by Knapp et al. (1989) and Likkel et al. (1991) but undetected with rms ∼0.2 Jy. Data from this survey, therefore, represent the first detection of 12CO (J = 1–0) emission from this target. Our CO maps from OPACOS (Figure 3.5) were presented and analyzed prior to this paper in Sánchez Contreras et al. (2007); here, we briefly summarize these results. We find an extended CO envelope with a deconvolved half-maximum size of 5'' × 3''; this size similar to that of the halo observed in the NIR (Sánchez Contreras et al. 2007). The long axis of the CO envelope appears to be roughly oriented along the EW direction (after beam deconvolution of the maps), that is, similarly to the equatorially dense structure probed by OH maser emission and visible as a dark waist separating the lobes in the optical and NIR images. Therefore, a significant part of the CO emission probably arises in an equatorially dense toroidal structure. We note, however, that the envelope parameters deduced from our CO maps are relatively uncertain due to the ISM contamination of the circumstellar profile and moderate angular resolution.
Given the flux of the 12CO (J = 1–0) line derived from our data (∼1.5 Jy), this line should have been detected in Knapp et al. (1989) and Likkel et al. (1991) single-dish studies. We do not know the reason for this inconsistency, but large errors in the absolute flux calibration, pointing, and/or strong ISM contamination in the single-dish data could explain the flux discrepancy. In any case, flux losses are unlikely to affect our data. We detect 13CO (J = 1–0) emission from this source for the first time. The profile, although noisy, is consistent with a double-peaked shape centered at a few km s−1 redward from the 12CO line (Figure 5).
A compact source of 2.6 mm continuum emission is detected toward IRAS 18276−1431. As discussed in detail by Sánchez Contreras et al. (2007), a population of big dust grains (radius ≳4 mm) with temperatures ∼20–150 K can explain the observed millimeter and submillimeter flux.
OH maser phase-lag measurements indicate a distance to IRAS 18276−1431 in the range d = 2–5.4 kpc (Bowers et al. 1983; Herman & Habing 1985). The near kinematic distance is dk = 4.5 kpc (Le Bertre et al. 1989). In this paper, we adopt an intermediate value of d = 3 kpc, which is also close to the value of dL derived from the bolometric flux of this object, Fbol ∼ 870 L☉ kpc−2. For d ∼ 3 kpc, the visual ISM extinction is AV = 1.0–2.0 mag and, therefore, the intrinsic (dereddened) bolometric flux is Fbol ∼ 900–915 L☉ kpc−2, which consistently implies a similar value of dL ∼ 2.6 kpc.
3.2.6. IRAS 18348−0526 (OH 26.5+0.6, RAFGL 2205, V* V437 Sct)
This is an O-rich Mira-type variable near the tip of the AGB phase. It was observed but not detected in our HST optical survey of candidate PPNs (Sahai et al. 2007a). The source has very bright Two Micron All Sky Survey (2MASS) and Midcourse Space Experiment (MSX) counterparts. It shows strong 9.7 and 18 μm silicate features and water ice far-IR bands (Sylvester et al. 1999). It has a spectral type of M (as per SIMBAD database). OH and SiO masers are detected. The OH maser emission arises in an elongated shell of radius ∼25 with its major axis oriented along P.A. = 95° (Herman et al. 1985; Bowers & Johnston 1990; Etoka & Diamond 2010). SiO maser emission, mapped with the Very Long Baseline Array, reveals a rather chaotic, asymmetric ring-like distribution with a characteristic radius ∼001 and maser plumes roughly oriented along the NS direction (Cotton et al. 2008).
Single-dish spectra of 12CO (J = 1–0) and higher-J transitions have been previously reported by, e.g., Heske et al. (1990) and Justtanont et al. (1996): Strong galactic contamination of the single-dish 12CO (J = 1–0) profile is noticed. Interferometric 12CO (J = 1–0) maps with 98 × 7'' resolution also exist (Fong et al. 2002). We find 12CO emission over a full velocity range of ∼24 km s−1, similar to that spanned by the OH masers (Figures 3.6 and 4). The 12CO profile has a hint of asymmetry, the blue side is weaker, maybe due to self-absorption or absorption by intervening ISM components. The upper limit to the 12CO (J = 1–0) line flux published by Heske et al. (1990) from single-dish observations, ≲0.5 Jy, is consistent with our measurement, ∼0.6 Jy, within 20%–30% absolute flux errors. This indicates that there are no significant flux losses in our interferometric data. The 12CO (J = 1–0) flux measured by Fong et al. (2002) with a ∼9'' beam is also ∼0.6 Jy.
The object appears extended in our 12CO (J = 1–0) maps (Figure 3.6): The deconvolved, half-maximum size of the velocity-integrated CO map is 43 × 38, with its long axis oriented roughly along the EW direction, i.e., parallel to the major axis of the OH shell and dusty environment probed by mid-IR emission (Bowers & Johnston 1990; Chesneau et al. 2005). This result is consistent with CO probing an equatorially dense toroidal structure. The deconvolved, half-maximum size of the CO envelope measured in our data is smaller than that measured by Fong et al. (2002), ∼85 × 55, in their lower (HPBW ∼ 9'') resolution maps. This discrepancy is unlikely to result from interferometric flux losses or the sensitivity limit in our maps given the good agreement between the line flux measured by us and that obtained from single-dish data and the interferometric maps by Fong et al. (2002) themselves (see the previous paragraph). The different size of the CO envelope derived from maps with different angular resolution may reflect the two distinct mass-loss regimes presumably undergone by this object (see Justtanont et al. 1996).
We find a velocity gradient in the nebula along the NS direction: The redshifted (blueshifted) emission is systematically offset toward the north (south). Although we cannot rule out such a gradient being an artifact produced by ISM absorption of the circumstellar profile, the remarkable symmetry of the contours of the velocity map around the CO emission peak favors a circumstellar origin. In fact, an expanding torus with its symmetry axis projected along the NS direction and tilted with respect to the line of sight in such a way that the back (receding) and front (approaching) sides of the torus are offset to the north and south, respectively, could satisfactorily explain both the EW elongation of the CO envelope and the NS velocity gradient observed. Alternatively, the velocity gradient may indicate the presence of a compact bipolar outflow running along the NS direction (i.e., orthogonally to the torus), co-linear with the asymmetric distribution of the SiO maser plumes. Higher-angular resolution CO mapping is needed to unambiguously characterize the structure and kinematics of the molecular envelope in this compact object.
We report the detection of weak 13CO (J = 1–0) emission in the range VLSR = [+15:+35] km s−1 (Figure 5).
We adopt a distance to this object of d = 1.1 kpc, which is the average of two independent estimates of the OH maser phase-lag distance (d = 1.4 and 0.9 kpc, respectively; van Langevelde et al. 1990; Bowers & Johnston 1990). The bolometric flux of this object is Fbol ∼ 6300 L☉ kpc−2, which yields a value for the luminosity distance of dL ∼ 1 kpc. For d ∼ 1 kpc, the visual ISM extinction is AV = 0.1–1.0 mag (Hakkila et al. 1997) and, therefore, the intrinsic (dereddened) bolometric flux is not significantly higher, Fbol ∼ 6300–6600 L☉ kpc−2.
3.2.7. IRAS 18420−0512 (OH 27.5−0.9)
This OH/IR object was imaged in our optical/HST and NIR/AO surveys of candidate PPNs and shows a central bipolar shape (oriented along P.A. ∼ −60°) surrounded by an extended halo traced out to a radius of ∼3'' with centrosymmetric arc-like features (Sahai et al. 2007a; Sánchez Contreras et al. 2006b). One, possibly two, secondary (minor) lobes with collimated shapes (oriented along P.A. ∼ 75°–80°) emanate from the central region.6 The central star has been assigned an M 1I spectral type (Suárez et al. 2006). A double-peaked OH maser emission profile indicates a dense molecular shell expanding with Vexp ∼ 14 km s−1 (Engels & Jiménez-Esteban 2007). No SiO or H2O maser emission has been reported (Gómez et al. 1990).
No CO detection has been previously reported for this object. Our data show 12CO (J = 1–0) emission with a slightly asymmetric profile over a total velocity range a little larger than the OH maser line (Figures 3.7 and 4). The CO emission arises in an elongated envelope with a deconvolved half-maximum size of ∼35 × 12 and roughly oriented along the NS direction. We identify a velocity gradient along the same axis: The redshifted and blueshifted emission regions are systematically displaced toward the north and south, respectively. The similar orientation of the long axis of the CO envelope and the direction along which the velocity gradient is observed suggest that the CO emission probes a bipolar molecular outflow. This outflow may be tracing a (third) bipolar ejection distinct from those probed by the optical HST images. 13CO (J = 1–0) emission is also detected (Figure 5). The envelope traced by this transition, which is also extended, has a deconvolved half-maximum size of ∼56 × 42 and similar orientation (within the errors) to the 12CO envelope.
The near and far kinematic distances to IRAS 18420−0512 taking into account its galactic coordinates and radial velocity (l = 2757, b = −085,  km s−1) are dk(near) = 6 and dk(far) = 9 kpc. As discussed by de Jong (1983) and Herman et al. (1985), since the radial velocity is close to the maximum velocity allowed in that direction, IRAS 18420−0512 could be at the tangent point (d ∼ 7.5 kpc). The bolometric flux of this object is Fbol ∼ 160 L☉ kpc−2 from which we derive dL = 6.1 kpc. At such a distance (6–7 kpc), the visual ISM extinction in the direction to IRAS 18420−0512 is AV = 2–4 mag and, thus, the dereddened bolometric flux is Fbol ∼ 190–230 L☉ kpc−2, which yields a consistent value for the distance of dL = 5–5.6 kpc. We adopt a value for the distance to this object of d = 6 kpc.
3.2.8. IRAS 18460−0151 (OH 31.0−0.2)
This OH/IR star shows H2O maser emission spread over a very wide velocity range (≳200 km s−1) and likely belongs to the class of "water-fountain" PPNs (Deguchi et al. 2007, and references therein). Although no 2MASS counterpart could be found for this object, it has a bright MSX match and it is also identified at wavelengths 3.5–5.8 μm in the Spitzer/GLIMPSE survey (Deguchi et al. 2007). The rising mid-IR spectrum toward longer wavelengths points to a thick dust envelope, which is spatially unresolved in 8–12 μm subarcsecond-resolution images (Lagadec et al. 2011). In addition to the very fast outflow probed by the H2O masers, the double-peaked OH maser emission profile (with peaks at VLSR = +110 and +140 km s−1) indicates a dense shell expanding at Vexp ∼ 15 km s−1 (Engels & Jiménez-Esteban 2007). The optical counterpart to IRAS 18460−0151, which is expected to be very faint, cannot be unambiguously identified in our optical/HST images,7 which show several faint, point-like objects near the MSX and OH maser source.
No CO detection has been previously reported toward this object. Our data show 12CO (J = 1–0) emission over a total velocity range similar to that of the OH maser line (Figures 3.8 and 4). There is strong ISM contamination of the maps near the source but at velocities outside the circumstellar profile (at VLSR ∼ [+103:+108] and ∼90 km s−1). The CO envelope is marginally extended with a deconvolved half-maximum size of 21 × 05 and oriented along P.A. ∼ 50°. We find a tentative velocity gradient along the NS direction: The redshifted and blueshifted emission are systematically displaced toward the north and south, respectively. Since this source is only marginally resolved, the errors in the envelope parameters derived, in particular the CO envelope orientation and asymmetry, are expected to be larger than the average. Therefore, the relative orientation of the CO envelope and the tentative gradient found is uncertain and we cannot elucidate the structure(s) responsible for the asymmetries observed.
As discussed, e.g., by de Jong (1983) and Deguchi et al. (2007), the radial velocity of IRAS 18460−0151 ( km s−1) is close to the maximum velocity allowed in that direction (l = 3101, b = −022) and, therefore, this object is probably at the tangent point, implying a distance of dk ∼ 7 kpc, which we adopt. The bolometric flux of this object is Fbol ∼ 600 L☉ kpc−2. At a distance of ∼7 kpc, the visual ISM extinction in the direction to IRAS 18420−0512 is AV ∼ 3.5 mag and, therefore, the dereddened bolometric flux is Fbol ∼ 690 L☉ kpc−2. This implies a total luminosity of the source L = 3 × 10⁴ L☉ at d = 7 kpc, which is at the high end of the typical luminosity range for pAGB objects. The luminosity distance for this object is dL = 3 kpc.
3.2.9. IRAS 18560+0638 (OH 39.7+1.5, V1366 Aql, AFGL 2290)
This Mira-type variable star does not have an optical counterpart down to a limit of ∼20 mag in the F photographic band of The Guide Star Catalog, Version 2.3.2 (GSC2.3). A very deep 9.7 μm silicate feature indicates an optically thick envelope with O-rich chemistry (Heske et al. 1990). OH, H2O, and SiO masers have been detected (Omont et al. 1993; Deguchi et al. 2007; Nyman et al. 1998). The H2O maser profile varies with time in a unique manner, exhibiting a double-peaked profile similar to the 1612 MHz OH maser line during the bright phase of the star and a single line close to the stellar radial velocity while the star was dim (Engels et al. 1997).
12CO (J = 2–1) emission was reported by Heske et al. (1990) with a profile severely affected by ISM contamination. Heske et al. (1990) and Neri et al. (1998) published a marginal detection of 12CO (J = 1–0) with the IRAM 30 m radio telescope. Our data (Figures 3.9 and 4) show circumstellar CO emission over a total velocity range slightly larger than the OH maser profile, VLSR ∼ [0:+43] km s−1. There are ISM absorption and emission clumps near IRAS 18560+0638, which results in a triple-peaked CO profile with very sharp edges. Due to ISM contamination, it is very difficult to obtain an accurate value for the CO flux (the value in Table 3 is probably a lower limit). The 12CO (J = 1–0) intensity at the line peak from single-dish data (references above), 0.8 ± 0.4 Jy, and from OPACOS (0.45 Jy) are comparable taking into account the mentioned flux uncertainties. Therefore, and considering also the relatively large beam in our maps of IRAS 18560+0638, it is unlikely that significant flux losses affect our interferometric data.
The velocity-integrated CO map, using only channels with weak or no ISM contamination, as well as the individual velocity-channel maps indicates an extended CO envelope, with a deconvolved half-maximum size of ∼3''–5'' and oriented roughly along P.A. ≈ −30°. A velocity gradient is found along this axis: The redshifted (blueshifted) emission is displaced toward the north (south). We detect 13CO (J = 1–0) emission for the first time in this object. The line is centered at VLSR = +20 km s−1 with a full velocity extent comparable to that of the 12CO line (Figure 5). Our velocity-integrated 13CO map also suggests an extended envelope with a deconvolved half-maximum size of 52 × 25 with its long axis oriented similarly to the 12CO envelope. The alignment (within errors) of the velocity gradient and the long axis of the 12CO and 13CO envelope suggest a bipolar outflow in that direction. However, due to the strong ISM contamination of the 12CO maps and also because of the moderate S/N and angular resolution of the 13CO (J = 1–0) data set, we consider this result tentative.
The distance to IRAS 18560+0638 is estimated to be d = 1–2 kpc from OH maser phase-lag measurements (van Langevelde et al. 1990). This value is in excellent agreement with our estimate of the near kinematic distance, dk = 1.4 kpc (l = 3971, b = +149, and VLSR = +20 km s−1), which we adopt in this paper. At a distance of ∼1–2 kpc, the visual ISM extinction in the direction to IRAS 18560+0638 is AV ∼ 0.1–1.4 mag and, therefore, the dereddened bolometric flux is Fbol ∼ 9050–104 L☉ kpc−2. At d = 1.4 kpc the total luminosity is L ∼ 1.8 × 10⁴ L☉.
3.2.10. IRAS 19024+0044 (OH 35.21−2.65)
This object is a young O-rich PPN as deduced from the detailed multiwavelength study by Sahai et al. (2005), which included our 12CO (J = 1–0) maps from OPACOS. HST optical images show a multipolar nebula of size ∼37 × 23, with at least six lobes emanating from the central source. A central compact region shows Hα emission with very broad wings (FWZI ∼ 2400 km s−1) and a P Cygni like profile, indicating the presence of a ≈100 km s−1 outflow (Sánchez Contreras et al. 2008). The central star, which is obscured by a dusty equatorial structure in the optical images, has a spectral type G 0-5 (Sahai et al. 2005). OH maser emission suggests the presence of a dense expanding envelope at Vexp = 13–14 km s−1 (Sevenster 2002). H2O maser emission is not detected (Suárez et al. 2007).
12CO (J = 1–0) emission was first detected in this object as part of OPACOS and reported by us in Sahai et al. (2005). Likkel et al. (1991) sought 12CO (J = 1–0) with the 30 m IRAM telescope but emission was not detected down to a 1σ level of ∼0.13 Jy. According to the peak line intensity measured by us (∼0.7 Jy), the line should have been detected by these authors, however, pointing errors in the single-dish observations, or flux calibration uncertainties and/or ISM contamination of the profile in both data sets may be the origin of the observed discrepancy. In spite of these uncertainties and, since we measure more flux than the rms of the single-dish data, we conclude that flux losses are improbable.
Our data (Figures 3.10 and 4) show a relatively broad 12CO (J = 1–0) profile centered at VLSR = +50 km s−1 and affected by ISM contamination in several channels (e.g., at VLSR = +37.7 and +50.7 km s−1). The velocity-integrated CO map is spatially unresolved, however, the emission from the individual channels is centered at slightly different offsets that lie within a ∼25-long region oriented along P.A. ∼ +45°, i.e., well aligned with the optical lobes. Therefore, the CO nebula probed by our maps is marginally extended, with a value of θ1/2 ≈ 1''. The velocity gradient found (see Figure 3.10, bottom-right panel) is consistent with the presence of a molecular bipolar outflow.
Here we revise our value for the distance to IRAS 19024+004 as estimated in Sahai et al. (2005). We adopt d = 10 kpc, which is the far dk (l = 3521, b = −0265, and VLSR = +50 km s−1). The bolometric flux is Fbol = 260 L☉ kpc−2, which would imply a very low luminosity of L ∼ 3500 L☉ for the near dk = 3.7 kpc. For the far dk the luminosity, L ∼ 2.6 × 10⁴ L☉, is at the high end of the typical range for pAGB objects and in excellent agreement with the independent estimate of the luminosity obtained from the strength of the luminosity-dependent O i 7771–5 Å IR triplet (Sánchez Contreras et al. 2008). The compactness of the optical and CO nebula also supports a large distance to this object.8 At a distance of ∼10 kpc, a value of AV ∼ 2.2 mag is derived using the algorithm by Hakkila et al. (1997), which leads to a dereddened Fbol = 270 L☉ and a total luminosity of L ∼ 2.7 × 10⁴ L☉.
3.2.11. IRAS 19234+1627 (PN G051.5+00.2)
Ground-based optical imaging and spectroscopy indicates a PN nature for this IRAS source (Kerber et al. 1996). HST optical images show a roughly elliptical, limb-brightened nebula of angular dimensions ∼11'' × 8'' with its long axis oriented at P.A. ∼ 15° (Sahai et al. 2011b). A faint point-like source is observed at the nebula center, which is very likely the central star. Radio emission maps and IR images from the Spitzer/GLIMPSE survey (Urquhart et al. 2009) show a nebular morphology similar to that in the optical.
Our maps show several CO emission clumps in the velocity range VLSR = [+51:+66] km s−1 (Figure 3.11). None of the clumps coincide with the location of the central star of IRAS 19234+1627 or the 2.6 mm continuum source and, therefore, the detected CO emission is likely to have an interstellar origin.
Intense continuum emission at 2.6 mm is detected, F2.6 mm = 70 mJy. The continuum source is extended and has a deconvolved half-maximum size of ∼55 × 47 (Table 5). The orientation of the 2.6 mm continuum envelope is the same as that of the optical, IR, and radio nebulae. The origin of the millimeter-wave continuum emission is probably free–free emission from the ionized nebula.
Since the VLSRsys of IRAS 19234+1627 is unknown, we are unable to estimate dk. From the bolometric flux of the source, Fbol = 60 L☉ kpc−2, we derive a large value of the luminosity distance of dL = 10 kpc. At a distance of ∼10 kpc, the visual ISM extinction is AV < 6.5 mag, which leads to a dereddened Fbol < 70 L☉ and a lower limit to the distance of dL > 9.2 kpc. Here we adopt d = 9.5 kpc.
3.2.12. IRAS 19255+2123 (OH 56.1+2.1, K 3-35)
This is a very young O-rich PN characterized by a bipolar radio continuum emission morphology (Aaquist 1993; Miranda et al. 2001). The characteristic S-shape morphology of the radio lobes can be successfully reproduced by a precessing jet, evolving in a dense circumstellar medium (Velázquez et al. 2007). Our optical/HST and NIR/AO images show bipolar nebula with a well-defined point-symmetric structure (Sahai et al. 2007a; Sánchez Contreras et al. 2006b). Ground-based optical images and R−I color map are consistent with the presence of a dense structure in the equatorial plane of the nebula (Miranda et al. 2000). Both OH and H2O maser emission are observed, suggesting that IRAS 19255+2123 departed from the PPN phase only a few decades ago (Miranda et al. 2001; Tafoya et al. 2007). The H2O maser emission is found in the equatorial regions and at the tips of the lobes (Miranda et al. 2001); SiO maser emission is not detected (Jewell et al. 1991). From the presence of He ii emission in the optical spectrum, a temperature of Teff ⩾ 60,000 K has been inferred for the central star (de Gregorio-Monsalvo et al. 2004; Miranda et al. 2000).
Single-dish 12CO (J = 2–1) observations have been reported by Tafoya et al. (2007), who detected an intense, narrow ISM feature at VLSR ∼ +10 km s−1 plus a weak, broad component observed over a velocity range of VLSR ∼ [0:+40] km s−1 that is most likely associated with IRAS 19255+2123. A tentative (3σ) detection of circumstellar 12CO (J = 1–0) emission is also reported by these authors.
Our data confirm the presence of circumstellar 12CO (J = 1–0) emission from this object with a relatively broad profile, over the velocity range VLSR = [+10.9:+47.3] km s−1 (Figures 3.12 and 4). At VLSR = +10.9 km s−1, we identify a 12CO emission clump east of IRAS 19255+2123 that is most likely the main contributor to the narrow ISM emission component found at this velocity in previous single-dish spectra. This ISM feature is less intense in our interferometric data than in single-dish spectra, suggesting that the extended emission from the ISM cloud is partially filtered out by the interferometer. The flux of the broad, circumstellar component of the CO profile measured by us and by Tafoya et al. (2007) from their single-dish spectra is in agreement, which implies that there are no interferometric flux losses of the circumstellar CO emission in our data.
Our velocity-integrated CO map shows an extended source with a deconvolved size of 84 × 39 and with its long axis roughly perpendicular to the optical lobes.9 The redshifted (blueshifted) emission arises from the west (east) side of the equatorially extended structure: The absolute angular offset between these two emission components, both also elongated along the EW direction, is ΔR.A. ∼ 2''. The observed elongation and velocity gradient may point to elongated outflows running along a direction perpendicular to the long axis of the radio and optical lobes. The presence of multi-directed and nearly orthogonal molecular flows are observed in other PPNs (e.g., CRL 2688; Cox et al. 2000). A large, rotating equatorial structure can be ruled out as an alternative interpretation of the velocity gradient observed in IRAS 19255+2123 since in that case the inferred mass for the central star would be unrealistically high (over ≈100 M☉).
We detect for the first time 13CO (J = 1–0) emission from IRAS 19255+2123 (Figure 5). Our maps show a point-like source centered near the redshifted 12CO (J = 1–0) clump. The 13CO line peaks around VLSR = +30km s−1, which is consistent with a double-peaked profile with the blue side of the line weaker than the red one. The full width of the line is uncertain due to limited S/N in our maps and ISM contamination. We believe circumstellar emission is confirmed in the LSR velocity range [+12.6:+34.4] km s−1.
Intense 2.6 mm continuum emission is detected from a point-like region near the blueshifted 12CO (J = 1–0) emission clump (see Figure 3.12). The origin of the millimeter-wave continuum emission is probably free–free emission from a compact, ionized structure.
We are intrigued by the separation (|ΔR.A.| ∼ 2'', equivalent to ∼8000 AU at d = 4 kpc, see the next paragraph) of the redshifted 12CO and 13CO (J = 1–0) emission clumps relative to the continuum source; the latter is well aligned with the blueshifted 12CO (J = 1–0) clump and the center of the optical nebula. It cannot be ruled out that this separation is pointing to a different nearby CO-emission source (not necessarily physically associated with IRAS 19255+2123) with slightly different radial velocity. Alternatively, if a bipolar flow is the cause of the elongated CO red and blue clumps (confirmation by higher-angular resolution is needed) then the observed distribution would imply that such an outflow is not symmetric with respect to the central source, i.e., the blue and red clumps may represent two distinct bipolar flows emerging from the nebular core with a different inclination with respect to the line of sight. In particular, the blue lobe may be directed nearly along the line of sight, resulting in a very small lobe length projected in the sky plane, whereas the red lobe may run along a direction closer to the plane of the sky.
There are several distance estimates for this object based on statistical methods with values of d in the range ∼4–6.6 kpc (Cahn et al. 1992; Zhang 1995; Phillips 2004). Taking into account the galactic coordinates and radial velocity of IRAS 19255+2123 (l = 561, b = +021, and  km s−1) we derive values for the near and far dk of 1.8 and 7.5 kpc, respectively. (Our values differ from those obtained by Aaquist (1993), dk = 0.6 and 8.9 kpc, because of the different VLSRsys adopted by these authors, VLSRsys = +10 km s−1.) The bolometric flux of IRAS 19255+2123 is Fbol = 350 L☉ kpc−2, which would imply an unrealistically low luminosity for the near dk. The total visual ISM extinction across the Galaxy toward this object is AV = 7 mag. In particular, at d ∼ 4–6 kpc a smaller value of AV ∼ 1.5–2 mag is expected. This leads to an intrinsic (dereddened) bolometric flux of Fbol ∼ 360 ≲ 410 L☉ kpc−2, implying dL ∼ 4 kpc, a value that we adopt for d. This value is consistent with a recent trigonometric parallax measurement (of H2O masers) by Tafoya et al. (2011).
3.2.13. IRAS 19292+1806 (OH 53.63−0.24)
This object is a young O-rich PPN imaged in our optical/HST and NIR/AO surveys of candidate PPNs (Sahai et al. 2007a; Sánchez Contreras et al. 2006b). These images show a bipolar nebula (lobe length ∼09) surrounded by an elliptical halo that can be traced out to a radius of 25. The central star is probably hot (B-type?); no Hα or other emission lines have been detected so far (Sánchez Contreras et al. 2008). The presence of molecular gas is evidenced by OH maser emission from a spherically symmetric shell with radius ∼05 expanding at Vexp ∼ 13.5 km s−1 (Chapman et al. 1984; Te Lintel Hekkert et al. 1989; Engels & Jiménez-Esteban 2007).
We report a first-time detection of 12CO (J = 1–0) emission toward this object. Our data (Figures 3.13 and 4) show CO emission over a total velocity range similar to that spanned by the OH maser line (∼[−4:+25] km s−1 LSR). There are strong ISM absorption/emission features near IRAS 19292+1806 over the range VLSR = [+45:+65] km s−1 and also around VLSR = −6.5 km s−1. Our velocity-integrated CO map shows an extended source with a deconvolved half-maximum size of 24 × 17 and oriented along P.A. = −45°, that is, along the direction of the optical lobes. We also find 13CO (J = 1–0) emission toward IRAS 19292+1806 with a relatively broad profile, FWZI ∼ 24 km s−1 centered at VLSR ∼ 12 km s−1 (Figure 5). The velocity-integrated 13CO map shows an extended source with a deconvolved half-maximum size of ∼4'' × 2'' and oriented similarly to the 12CO envelope. In this case, both the 12CO and 13CO envelopes are marginally resolved, therefore, the derived values for the envelope size and orientation are uncertain.
The near and far kinematic distance to IRAS 19292+1806 are dk = 0.8 and dk = 9 kpc, respectively (l = 536, b = −024, VLSRsys = 11 km s−1). The bolometric flux is Fbol = 260 L☉ kpc−2, which would imply an unrealistically low luminosity for the near dk. The luminosity distance is dL = 4.8 kpc. At such a distance, the visual ISM extinction toward this object is AV ∼ 2.8 mag and, therefore, the intrinsic (dereddened) bolometric flux is Fbol ∼ 280 L☉ kpc−2, implying dL ∼ 4.6 kpc. We adopt d = 5 kpc in this work, although a larger distance of dk(far)∼9 kpc is possible, yielding an acceptable value for the total luminosity of ≈2 × 10⁴ L☉.
3.2.14. IRAS 19306+1407 (GLMP 923)
This is a yPN candidate (e.g., Hrivnak et al. 2000; Lowe & Gledhill 2007, and references therein). Optical HST images show a bipolar nebula with roughly cylindrical ∼2''-long lobes surrounded by a tenuous round halo that can be traced out to a radius of ∼4'' (Sahai et al. 2007a). The central star, visible through the nebula, has a B0-1 I spectral type (Sánchez Contreras et al. 2008). Hα emission with a P Cygni profile and broad (FWZI ∼ 2600 km s−1) wings is detected toward the nebula core, indicative of ongoing pAGB mass loss (Sánchez Contreras et al. 2008). This object has a mixed C+O chemistry since it shows both carbon- and oxygen-rich dust features (Hrivnak et al. 2000; Hodge et al. 2004; Cerrigone et al. 2009). Emission from several NIR transitions of H2 indicate the presence of a ∼2''-sized molecular component (Kelly & Hrivnak 2005). No OH and H2O maser emission has been detected (Likkel et al. 1991; Suárez et al. 2007).
12CO (J = 1–0) emission was unsuccessfully searched for by Likkel et al. (1991). We have detected 12CO (J = 1–0) emission toward IRAS 19306+1407 for the first time. The line is clearly visible in two adjacent channels at VLSR = 96.5 and 99.1 km s−1 (Figures 3.14 and 4). The good match of the systemic velocity derived from CO, VLSR ∼ +98 km s−1, and from the optical line absorption spectrum of the star, VLSRsys = 95–100 km s−1 (Sánchez Contreras et al. 2008), favors a circumstellar origin for the CO emission in spite of its narrow profile. We observe weak, broader emission wings (at a 3σ level) from the source position over the LSR velocity range [+91.3:+106.9] km s−1. The observed line peak intensity is comparable to the rms noise level in the single-dish data by Likkel et al. (1991), implying that there are no flux losses in our interferometric data. There is also weak emission toward the source at much larger velocities, VLSR = [+190:+203] km s−1. At these velocities there are several emission clumps in the field of view that probably represent dense ISM clouds, so it is likely that this central emission component is interstellar.
The velocity-integrated 12CO (J = 1–0) map is consistent with a point-like source, however, careful examination of the individual velocity-channel maps suggests a velocity gradient along the NS direction, with redshifted (blueshifted) emission arising from the north (south) side of the envelope. The good alignment of the axis along which the velocity gradient is observed with the optical/NIR lobes suggests the presence of a bipolar outflow, but we caution that this is a tentative result given the resolution of our data compared with the angular dimensions of the optical nebula (see above). 13CO (J = 1–0) emission is marginally detected toward IRAS 19306+1407 at VLSR = +107 km s−1.
The observed radial velocity of IRAS 19306+1407 (VLSRsys = +98 km s−1) is close to the maximum value possible in that direction (l = 5030, b = −0248), so this source is probably at the tangent point, i.e., at dk = 5.5 kpc, a value which we adopt for d. The bolometric flux is Fbol = 300 L☉ kpc−2. Adopting a visual ISM extinction of AV = 4.2 mag, estimated by Lowe & Gledhill (2007), the dereddened bolometric flux is Fbol = 380 L☉ kpc−2, which yields a total luminosity of ≈104 L☉ at 5.5 kpc. This value lies within the range of expected luminosities for pAGB objects and is in excellent agreement with the independent estimate of L obtained from the strength of the O i 7771–5 Å IR triplet (Sánchez Contreras et al. 2008).
3.2.15. IRAS 19374+2359
This is a strong IRAS source originally proposed to be a PPN candidate by Kwok et al. (1987). Optical HST images show a ∼3'' × 2'' bipolar nebula, which corroborates its pAGB status (Ueta et al. 2000, also see our Figure 3.15). In these images, we also find an elliptical extended halo (Rhalo ∼ 3'') with a brightness distribution suggestive of a mass-loss rate increasing with time. Recent subarcsecond-resolution 8–12 μm images are consistent with an elliptical detached shell along P.A. ∼ 11°, i.e., roughly aligned with the optical/NIR lobes (Lagadec et al. 2011). We have recently discovered Hα emission with ≳600 km s−1 broad wings from the stellar vicinity, signaling ongoing fast pAGB ejections (Sánchez Contreras et al. 2008). The line absorption spectrum of the central star is consistent with a B 3-6I classification (Sánchez Contreras et al. 2008). The chemistry of the envelope is not certain, but there is some evidence for the presence of the 9.7 μm silicate feature in absorption and, therefore, for an O-rich chemistry (Lawrence et al. 1990). Near IR H2 line emission has been reported showing the presence of shocked molecular gas (Kelly & Hrivnak 2005).
The previous search for 12CO (J = 2–1) emission toward this object by Hu et al. (1994) resulted in no detection. 12CO (J = 1–0) emission is detected for the first time in this work. Our maps reveal a very broad, triangular-shaped line with a full extent of ≳160 km s−1 centered at  km s−1 (Figures 3.15 and 4). Recently, one of us (C.S.C.) has obtained a 12CO (J = 2–1) single-dish spectrum (that will be published elsewhere) showing a similar wing-dominated profile with an even larger full velocity extent (FWZI ∼ 300 km s−1). The absence of a prominent narrow core both in the interferometric and single-dish profiles (otherwise common in PPNs—see Section 1) rules out interferometric flux losses of a presumably extended, slow nebular component as the cause of the atypical wing-dominated profile. The CO envelope appears to be point-like in our velocity-integrated 12CO maps (with an HPBW = 98 × 7''). 13CO (J = 1–0) emission is tentatively detected (at a 3σ level) toward the CO-emission source around VLSR = −31 km s−1 (Figure 5).
We adopt a distance to this object of d = dk = 11 kpc (for l = 5970, b = +096, and VLSRsys = −37 km s−1). The bolometric flux is Fbol = 650 L☉ kpc−2, which would yield dL = 3 kpc. At ∼11 kpc, the total luminosity of this source, L ∼ 7.8 × 10⁴ L☉, is consistent with the strength of the O i 7771–5 Å IR triplet in this source, which independently suggest a luminosity of up to L ≈ 105 L☉ (Sánchez Contreras et al. 2008). The ISM extinction is expected to be high in the direction to IRAS 19374+2359. Adopting a visual ISM extinction of AV = 3.5 ± 1.5 mag, the dereddened bolometric flux is Fbol = 740 ± 40 L☉ kpc−2, which at 11 kpc yields a total luminosity of ∼9 × 10⁴ L☉.
3.2.16. IRAS 19475+3119 (HD 331319, LS II +31 9)
This is an O-rich PPN that has been extensively studied by us using multiwavelength data. Optical HST images reveal a quadrupolar nebula of size about ∼10'' × 5'', with two pairs of elongated lobes emanating from the center; a faint, surface-brightness-limited, diffuse halo surrounds the lobes (Sahai et al. 2007a, 2007b). The central star, which is directly visible through the nebula, has a line absorption spectrum consistent with an F 3Ib classification (Klochkova et al. 2002; Sánchez Contreras et al. 2008). The Hα absorption stellar profile is partially filled by Hα emission indicative of current pAGB mass loss (Sánchez Contreras et al. 2008). Emission features due to crystalline silicates are identified in the Infrared Space Observatory Short Wavelength Spectrometer spectra of the star, which support an O-rich chemistry (Sarkar & Sahai 2006).
Extensive study of 12CO (J = 2–1) emission with 2'' resolution was presented by Sánchez Contreras et al. (2006a). These data probe two distinct molecular components: a slowly expanding, 44 × 44-sized shell and a fast bipolar outflow (∼75 long) oriented along the longer and more tenuous pair of the optical lobes (P.A. ∼ 80°). Our 12CO (J = 1–0) maps (Figure 3.16) are consistent with the nebular morphology and kinematics deduced from the higher-angular resolution J = 2–1 maps: The bulk of the emission arises in an extended shell expanding at Vexp ∼ 15 km s−1, which is probably the remnant AGB CSE; weaker emission is seen from a fast bipolar outflow, which presents a clear velocity gradient: the 12CO emission from the east (west) lobe is redshifted (blueshifted) with respect to VLSRsys. This nebular morphology and kinematics are also confirmed by the more recent ∼1''-resolution CO maps by Castro-Carrizo et al. (2010). By comparing the 12CO (J = 1–0) fluxes obtained from OPACOS and from single-dish data (Sánchez Contreras et al. 2006a) we conclude that no significant flux losses affect our interferometric maps.
A compact source of continuum emission at 2.6 mm is detected. The observed flux, ∼3.8 mJy, is in excess of the value expected from the spectral slope of the SED in the far IR range. As concluded from the detailed analysis/modeling of the SED of this object, the 2.6 mm continuum flux together with previous submillimeter-continuum flux measurements imply a substantial mass of large (radius ≳1 mm), cold (∼30 K) dust grains (Sarkar & Sahai 2006; Sahai et al. 2007b). We note that Castro-Carrizo et al. (2010) do not detect continuum emission at 2.6 mm in their ∼1''-resolution interferometric maps (with an rms limit of 0.4 mJy). Such a discrepancy with our data suggests that the dust continuum emission is extended (possibly associated with the optical diffuse halo) and is partially filtered out in Castro-Carrizo et al.'s interferometric data.
Here we revise our value for the distance to IRAS 19475+ 3119 previously estimated in Sánchez Contreras et al. (2006a). Taking into account its radial velocity (VLSRsys = +18 km s−1) and galactic coordinates (l = 6716, b = +273), this source is probably located at the tangent point and, therefore, dk = 3.5 kpc. At this distance, the visual ISM extinction is AV ∼ 1.3 mag, which leads to a dereddened Fbol = 660 L☉ kpc−2 and, therefore, to a value for dL of 3.0 kpc. We adopt d = 3.5 kpc.
3.2.17. IRAS 19548+3035 (RAFGL 2477)
This is a PPN candidate with a C-rich envelope around an O-rich M6 giant (e.g., Bujarrabal et al. 1994; Groenewegen et al. 1996; Speck et al. 2009, and references therein). HST optical images show a point-like source coincident with the MSX6C G067.3478+01.0186 and 2MASS J19564844+3044026 sources.
Single-dish 12CO (J = 1–0) and J = 2–1 spectra of this source have been previously reported (Likkel et al. 1991; Bujarrabal et al. 2001). We find 12CO (J = 1–0) emission over a total velocity range of ∼44 km s−1 centered at VLSR = +5.5 km s−1 (Figures 3.17 and 4). The blue side of the circumstellar profile is affected by strong ISM absorption, at VLSR = −20 km s−1. The total 12CO (J = 1–0) flux measured by us is consistent with that obtained from single-dish spectra (references above) and interferometric data (Neri et al. 1998; Castro-Carrizo et al. 2010), and, therefore, no flux losses affect our maps.
Our velocity-integrated 12CO map shows an extended structure with a deconvolved half-maximum size of 63 × 48, comparable to that derived by Neri et al. (1998), elongated roughly along P.A. = −11°. The individual velocity-channel maps reveal a velocity gradient nearly along the same direction: The intensity peaks lie on a ∼15-long vector roughly oriented along P.A. ∼ −20° with the blue and redshifted emission arising from the south and north side of the nebula, respectively. Given the large S/N and relatively small beam in our maps, the offset error bars are expected to be ≲01. This velocity gradient suggests the presence of a compact bipolar flow at the center of the source carving out the interior of the outer, more extended envelope. Castro-Carrizo et al. (2010) find that the emission centroids for many of the velocity channels in their interferometric CO maps are displaced by a few fractions of an arcsecond toward the NE, however, they do not make a conclusion about the nature of this displacement. 13CO (J = 1–0) emission is observed in our data with a flat-topped profile and similar velocity extent to the 12CO line (Figure 5). Our velocity-integrated 13CO map also shows an extended source with size and orientation similar to that derived from 12CO within errors.
Continuum emission at 2.6 mm is detected toward the source with flux ∼6 mJy. Our map suggests an extended structure with a deconvolved half-maximum size of ∼18 × 13 and with its long axis roughly perpendicular to the CO envelope. The 2.6 mm flux is in excess of that expected by extrapolating the spectral slope of the SED in the far IR (∼60–140 μm), which is mainly produced by thermal emission by a ∼150 K dust component. An additional population of cooler, big grains could account for the observed mm flux excess in IRAS 19548+3035, as happens for other PPNs (Sahai et al. 2006; Sánchez Contreras et al. 2008). The morphology and orientation of the continuum-emitting region suggests that this cold dust component (or part of it) may be located in a thick, dusty disk or waist perpendicular to the molecular bipolar flow. The 2.6 mm continuum flux measured by Castro-Carrizo et al. (2010) in their ∼1''-resolution maps is <1.3 mJy, that is, smaller than that measured by us with a larger beam, which suggests that part of the dust emission arises in an extended component partially filtered out in Castro-Carrizo et al.'s data.
For IRAS 19548+3035, we derive values for the near and kinematic distance of dk = 0.5 and 6 kpc (l = 06735, b = +0102, VLSRsys = +5.5 km s−1). The bolometric flux is Fbol = 1800 L☉ kpc−2, which would imply an unrealistically low luminosity of L ∼ 500 L☉ for the near dk. For the far dk the luminosity, L ∼ 6.5 × 10⁴ L☉, is at the high end of the expected range for pAGB objects. We derive a value of dL = 1.8 kpc. The ISM extinction in the direction to this object is AV < 8.5 mag and, therefore, the intrinsic (dereddened) luminosity is ≲3000 L☉ kpc−2, implying a lower limit to the distance of dL > 1.4 kpc. Here we adopt d = 4 kpc, which is intermediate to dL and dk(far). At such a distance, AV ∼ 2.1 mag and the dereddened Fbol ∼ 2070 L☉ kpc−2, implying a total luminosity ∼3 × 10⁴ L☉.
3.2.18. IRAS 19566+3423
This is an optically thick OH/IR envelope around a central object with a controversial evolutionary status: It has been suggested to be a hypergiant/supergiant star (Lewis 2001) and an evolved post-main-sequence star located near the tip of the AGB (Zuckerman & Lo 1987; Likkel et al. 1991). The optical and NIR counterparts are rather faint (R = 20.23 mag and 2MASS K = 14.3 mag); no HST optical image is available. The presence of a very deep 9.7 μm silicate feature in the IR spectrum as well as OH and H2O maser emission indicates O-rich chemistry (e.g., Galt et al. 1989; Likkel 1989). Surprisingly, a number of far IR features have been identified recently indicative of a C-rich chemistry, including HCN, C2H2, and C6H6 transitions (García-Hernández et al. 2012, in preparation). Based on this, we classify IRAS 19566+3423 as an object with a mixed C+O chemistry. The OH maser has a peculiar twin-double-peaked profile suggestive of an expanding concentric shell structure (Galt et al. 1989). Unlike most other OH maser sources, the OH lines in IRAS 19566+3423 show strong circular polarization and time variability. The OH emission velocity range is also variable, reaching values as high as >70 km s−1 (Lewis 2001).
We report the first detection of 12CO (J = 1–0) emission toward this peculiar object, coincident with the bright MSX6C G070.7766+02.6836 and 2MASS J19583227+3431337 sources. Our data (Figures 3.18 and 4) show 12CO emission centered at VLSR = −40 km s−1 and with a relatively narrow core (FWHM = 13 km s−1) plus tentative broad wings. By smoothing our maps every three channels, the wings can be traced over a total velocity range VLSR = [−21:−68] km s−1 (i.e., FWZI = 47 km s−1). The CO-emitting region is spatially unresolved in our maps. Likkel et al. (1991) reported a 12CO (J = 1–0) non-detection toward this source within the noise of their single-dish spectrum, rms ∼0.6 Jy. Since the observed line peak intensity in our interferometric data, ∼0.27 Jy, is smaller than the rms noise in the single-dish spectrum, we cannot evaluate possible interferometric flux losses. Given the probable large distance to IRAS 19566+3423 (see below), significant flux losses of an extended nebular component are unlikely to affect our maps.
For IRAS 19566+3423, we estimate a kinematic distance of dk ∼ 9–10 kpc for a radial velocity of VLSRsys = −40 km s−1 and galactic coordinates (l,b) = (7078, +0268). The bolometric flux is Fbol = 800 L☉ kpc−2, which would imply a high, but acceptable, luminosity of L ∼ [6.5–8] × 104 L☉ at 9–10 kpc. Adopting L ∼ 6000 L☉, we derive a value of dL = 2.7 kpc. The ISM extinction in the direction to this object is AV < 4.9 mag and, therefore, the intrinsic (dereddened) bolometric flux is Fbol < 930 L☉ kpc−2, implying a lower limit to the distance of dL > 2.5 kpc. At d ∼ 9 kpc (adopted here), the visual ISM extinction is AV ∼ 2.2 mag and the dereddened Fbol and luminosity are ∼850 L☉ kpc−2 and 7 × 10⁴ L☉, respectively.
3.2.19. IRAS 20000+3239 (GLMP 963)
This object is a C-rich PPN (e.g., Hrivnak et al. 2000, 2010; Gledhill et al. 2002, and references therein). HST images show an elongated (elliptical or bipolar) nebula with an angular size of ∼2'' × 1'' and oriented along P.A. = −75° (Sahai et al. 2007a). This compact nebula is surrounded by a larger, fainter round halo (traced out to a radius of 5'') with a non-uniform radial brightness distribution suggestive of two distinct episodes of time-variable mass loss. The central star, which is variable with a pulsational period of ∼150 days, has a mean spectral type G8 Ia (Hrivnak et al. 2010; Klochkova & Kipper 2006). NIR imaging polarimetry by Gledhill et al. (2001) suggests that multiple scattering is occurring in the core region, and is consistent with a geometry in which the star is surrounded by an obscuring disc or torus. Mid-IR images with ∼1''-resolution show a compact marginally resolved dust component (Meixner et al. 1999).
Circumstellar 12CO (J = 2–1) emission has been found by Likkel et al. (1991), who also report a tentative (∼1.4σ) detection of the J = 1–0 transition with the 30 m IRAM telescope. Both CO single-dish profiles appear strongly affected by ISM absorption at the line center, at VLSR ∼ 13–14 km s−1. Our data show intense 12CO (J = 1–0) emission centered at VLSRsys = +12.4 km s−1 over a full velocity range of ∼28 km s−1; ISM contamination is present in our velocity-channel map at VLSR = 14.3 km s−1 (Figures 3.19 and 4). The line profile observed is consistent with the presence of weak-broad emission wings adjacent to the intense-narrow core, which suggests two distinct kinematic components (see Section 4.2.1).
The circumstellar CO emission arises in an extended region with a deconvolved, half-maximum size 37 × 11 and oriented along P.A. ∼ 11°. This is consistent with the presence of an equatorial torus-like structure roughly perpendicular to the optical lobes. We observe a velocity gradient approximately along the EW direction, with the blue- and red-wing emission arising at the west and east side of the nebula, respectively. In principle, the gradient observed could be due to (1) expansive motions in a tilted torus and (2) a bipolar molecular outflow.
We believe (2) is the most likely explanation in this source because: (1) The angular distance between the redshifted and blueshifted CO emission clumps (∼2'') is similar to the distance between the tips of the east and west optical lobes but larger than the minor axis of the torus possibly identified (θb ∼ 11). Moreover, (2) if the gradient is due to the bipolar outflow then the implied tilt is consistent with that inferred from the different brightness and colors of the optical lobes: The east lobe is fainter and redder and, therefore, more likely to be located behind the front side of the torus. (This is making the reasonable assumption that the lobes run along the symmetry axis of the torus.) Higher-angular resolution maps are needed to robustly identify and characterize the different molecular components (torus and bipolar outflow) tentatively present in this object.
There is a significant difference between the value of VLSRsys derived from the CO profile and that deduced from the metallic absorption line spectrum of the central star, which is VLSRsys(star) = 3.1 ± 2 km s−1 (Klochkova & Kipper 2006). This discrepancy could indicate the presence of a binary system at the core of the nebula, with VLSRsys(CO) = +12.4 km s−1 representing the velocity of the mass center, and VLSRsys(CO)−VLSRsys(star) ∼9 km s−1 being a lower limit to the amplitude of the radial velocity curve of the primary star.
A compact 2.6 mm continuum source is detected toward this object with a total flux of 6 mJy. Continuum emission at 850 μm and 1.2 mm has been previously reported with a spectral slope consistent with thermal dust emission in that range (Gledhill et al. 2002; Buemi et al. 2007). Our measurement of the 2.6 mm flux is in clear excess with respect to the expected emission from such a dust component. This excess could be due to an additional contribution by free–free emission from a dense, compact ionized structure. Since the central star of IRAS 20000+3239 has a low temperature, Teff ∼ 5000 K, and therefore is unable to produce a significant ionizing UV radiation, the 2.6 mm flux excess (if attributable to free–free emission) could point to a binary system with a hot companion and/or an ionized accretion disk. Alternatively, the 2.6 mm continuum excess could be due to cold dust; in this case, the inferred temperature of the grains would have to be rather low (probably as low as 4–5 K) to explain the observed flux. Detailed modeling of the SED as well as continuum flux measurements in the cm-wavelength range are need to obtain a firm conclusion on the nature of the 2.6 mm continuum emission in this PPN.
Taking into account the galactic coordinates and radial velocity (from CO) of IRAS 20000+3239 (l = 6968, b = +116, and VLSRsys = +12.4 km s−1), we derive values for the near and far kinematic distance  = 2.3 and 3.6 kpc, respectively. The bolometric flux is Fbol = 630 L☉ kpc−2, which implies dL = 3.1 kpc. At a distance of ∼3 kpc, The ISM extinction toward IRAS 20000+3239 is estimated to be AV = 2.5 mag (Hrivnak et al. 2000), which yields an intrinsic (dereddened) Fbol ∼900 L☉ kpc−2. Here we adopt an intermediate value of d = 3 kpc, which implies a total luminosity of L = 8100 L☉.
3.2.20. IRAS 22036+5306
This object is an O-rich PPN with an F4-7 I central star that has been studied in detail by us using multiwavelength data (Sahai et al. 2003, 2006, 2007a). HST images show a bipolar nebula, an obscured central waist, and knotty linear structures along the lobes. There is also a round halo traced up to 65 from the center with a non-uniform brightness distribution suggestive of two distinct mass-loss episodes. A bright, unresolved (PSF = 133) 12.5 μm counterpart is reported by Meixner et al. (1999). This source shows OH maser emission (Zijlstra et al. 2001; Sahai et al. 2003), however, SiO or H2O masers have not been detected (Nyman et al. 1998; Suárez et al. 2007). Intense Hα emission, with a remarkable P Cygni profile and broad wings (FWZI ∼ 2500 km s−1), is found, which is indicative of shock-excited/accelerated lobes and nuclear, ongoing pAGB ejections (Sánchez Contreras et al. 2008).
Our first detection of 12CO (J = 1–0) emission in this object as part of the OPACOS project was reported by us in Sánchez Contreras & Sahai (2004b). Follow-up interferometric 12CO (J = 3–2) observations with ∼1''-resolution were presented and analyzed by Sahai et al. (2006) together with 12CO and 13CO (J = 1–0) data subsets from OPACOS (with ∼ 10''-resolution). A significant fraction of the CO emission from IRAS 22036+5306 is found to arise in a fast bipolar flow co-linear with the optical lobes (Figure 3.20). The width of the broad line wings that arise in the bipolar flow is larger in the 12CO (J = 3–2) data (FWZI ∼ 400 km s−1) than in our discovery OPACOS data set (FWZI ∼ 120 km s−1) due to the smaller spectral coverage in the latter. There is a clear velocity gradient along the bipolar outflow, the blueshifted emission arises in the bright (SW) lobe, whereas the redshifted emission arises in the faint (NE) lobe. The low-velocity emission arises in the central parts of the nebula. Our 13CO (J = 1–0) maps show a partially resolved structure with similar size and orientation as that probed by 12CO (Table 5). The total width of the 13CO (J = 1–0) line is smaller probably due to lower S/N in these maps (Figure 5).
A compact 2.6 mm continuum source is detected toward IRAS 22036+5306. As shown by Sahai et al. (2006), the relatively large flux observed at mm wavelengths (in excess of that expected extrapolating the fIR SED) indicates big dust grains (with radius ≳ 1 mm).
The distance to this object is very uncertain. Here we revise our value for the distance (d ∼ 2 kpc) previously adopted in Sahai et al. (2003, 2006), which was guided by keeping our determination of the total mass from the SED fitting below 10 M☉; this mass is based on an assumed gas-to-dust mass ratio of 200, however, we cannot rule out a significantly lower value of the latter. Taking into account its galactic coordinates and radial velocity (l = 9963, b = −184, and VLSRsys = −42 km s−1), we derive dk = 5 kpc. The bolometric flux is Fbol ∼ 530 L☉ kpc−2, which implies dL = 3.4 kpc. The visual ISM extinction in the direction to this object is AV < 3.4 mag and, therefore, the intrinsic (dereddened) bolometric flux is Fbol < 630 L☉ kpc−2, implying a lower limit to the distance of dL > 3.1 kpc. We adopt an intermediate value of d ∼ 4 kpc, which yields an intrinsic luminosity of ∼9000 L☉. This relatively high value, in the upper end of the typical luminosity range for PPNs, is consistent with the central star being massive (≳3–4 M☉), which is indeed independently suggested by the low 12C/13C isotopic ratio measured in this object (see Section 4.3 and Sahai et al. 2006).
3.2.21. IRAS 22177+5936 (OH 104.9+2.4, RAFGL 2885)
This is a highly evolved O-rich AGB star with a dusty, optically thick envelope (e.g., Omont et al. 1993; Riechers et al. 2005). This object appears to be a bright point-like source in our HST survey of candidate PPNs (Sahai et al. 2007a). The central star has a spectrum consistent with an effective temperature of ∼2500 K, i.e., with an M-type spectral classification (Riechers et al. 2005, and references therein). SiO, OH, and H2O maser emission has been detected (Omont et al. 1993, and references therein).
Different CO emission lines in the millimeter and submillimeter range have been detected toward this object (Heske et al. 1990; Neri et al. 1998; Groenewegen et al. 1999; Kemper et al. 2003; Castro-Carrizo et al. 2010). Our 12CO (J = 1–0) data (Figures 3.21 and 4) show emission centered at VLSRsys = −27 km s−1 over a total velocity range, ∼40 km s−1, slightly larger than that displayed by the OH maser profile (Omont et al. 1993). Strong ISM absorption and emission features are observed in our 12CO maps around VLSR = −23.7 km s−1 (narrow, intense emission components are also observed at similar velocities in the single-dish spectra; see references above). The 12CO (J = 1–0) single-dish flux is consistent with our measurement within errors, which allows us to rule out significant interferometric flux losses. Our velocity-integrated 12CO maps show a point-like source coincident with the intense, red MSX and 2MASS sources. The compactness of the CO envelope (<4'') is confirmed by the maps recently obtained by Castro-Carrizo et al. (2010). Weak 13CO (J = 1–0) emission is detected toward the source in the range VLSR = [−13:−40] km s−1 (Figure 5).
We adopt the value of the OH maser phase-lag distance, d = 2.38 ± 0.24 kpc (Herman et al. 1985; van Langevelde et al. 1990). At ∼2.4 kpc, the visual ISM extinction toward this object is AV = 1.2 mag, which implies a dereddened bolometric flux of Fbol ∼ 2800 L☉ kpc−2 and a total intrinsic luminosity of ∼1.6 × 10⁴ L☉. Taking into account the galactic coordinates and radial velocity of IRAS 22177+5936 (l = 1049, b = +241, and VLSRsys = −27 km s−1) we derive dk = 3.0 kpc. The value of the luminosity distance is dL ∼ 1.5 kpc.
3.2.22. IRAS 22223+4327 (DO 41288, V448 Lac)
This is a C-rich PPN with a central semiregular pulsating star (e.g., Klochkova et al. 2010, and references therein). Optical HST images show a central round core with two small lobes protruding on the southern side and one single lobe protruding on the northern side (Sahai et al. 2007a). A prominent halo (radius traced up to 75) surrounds the central aspherical nebula. Faint thin partial shells are seen within the halo. Images at 12.5 and 18 μm show a ∼18 × 18 dusty envelope (Meixner et al. 1999). The central star, which is directly visible in the optical, is classified as F 7-9Ia based on optical spectroscopic detailed studies (e.g., Pereira & Miranda 2007; Suárez et al. 2006; Arkhipova et al. 2003; Decin et al. 1998). The C-rich chemistry of this object is indicated by the presence of 3.3 and 21 μm features and emission from a number of C-bearing molecules (e.g., Omont et al. 1993; Kwok et al. 1995; Decin et al. 1998).
Previous 12CO (J = 1–0) and (J = 2–1) single-dish detections have been reported (Likkel et al. 1991). Our data (Figures 3.22 and 4) show strong 12CO (J = 1–0) emission centered at VLSR = −30km s−1 with an intense central core and weak, broader emission wings. The good agreement of the 12CO (J = 1–0) line flux measured by us and previous single-dish data rules out interferometric flux losses in our maps. The CO envelope, which is spatially resolved, can be traced out to a radius of ∼5'' and has a deconvolved half-maximum size of ∼31 × 26, with its long axis oriented along the optical lobes (P.A. ∼ 15°). A velocity gradient is found along such a direction, with the redshifted (blueshifted) wing emission arising in the NE (SW) lobe of the nebula, consistent with a bipolar outflow. We report for the first time 13CO (J = 1–0) emission toward this object with a flat-topped profile centered around VLSRsys = −31 km s−1 (Figure 5).
We adopt a distance to IRAS 22223+4327 of d = 4 kpc. Taking into account its galactic coordinates and radial velocity (l = 9675, b = −1156, and VLSRsys = −30 km s−1) we estimate dk = 4.6 kpc (see also Klochkova et al. 2010). The bolometric flux of IRAS 22223+4327 is Fbol ∼ 370 L☉ kpc−2, which yields dL = 4 kpc. The ISM extinction in the direction to this object is quite low, AV < 0.4 mag and, therefore, the intrinsic (dereddened) bolometric flux is ∼420 L☉ kpc−2, implying dL ∼ 3.8 kpc.
3.2.23. IRAS 22568+6141 (PN G110.1+01.9)
This is a young, low excitation PN of unknown chemistry around a ∼B 0 central star (García Lario et al. 1991). Our high-angular resolution optical/HST and NIR/AO images (Sahai et al. 2007a; Sánchez Contreras et al. 2006b) show a ∼8'' × 3'' bipolar nebula with highly structured lobes (overall shape is point symmetric); jet-like features and an ansa can be seen at the lobes; a dark waist totally obscures the central star at optical wavelengths.
García Lario et al. (1991) searched for 12CO (J = 2–1) emission toward this source but did not detect emission at any of the positions observed with ≳0.1 K (≳3.9 Jy taking into account the beam size 30'' of the 12 m NRAO antenna used by these authors). We report detection of 12CO (J = 1–0) emission toward IRAS 22568+6141 for the first time: Weak emission is found over a full velocity extent of ∼55 km s−1 centered at VLSR = −85 km s−1 (Figures 3.23 and 4). The line core shows a narrow absorption feature around VLSR = −82 km s−1, which probably has an interstellar origin. Our velocity-integrated 12CO map reveals a bipolar flow with a deconvolved half-maximum size of 67 × 12 oriented along P.A. = −65°, that is, along the optical lobes. An overall point symmetry is suggested by our CO maps. We find a clear velocity gradient along the bipolar molecular outflow, the redshifted (blueshifted) emission arising at the SE (NW) lobe.
We detect 2.6 mm continuum emission arising in an extended region with size and orientation similar within errors to that of the CO bipolar flow. Our measurement of the 2.6 mm flux shows a clear excess with respect to the expected emission from the dust component responsible for the FIR fluxes. The similar overall point-symmetric morphology and extent of the optical, CO and 2.6 mm continuum nebulae together with the relatively hot central star (B 0) suggest a significant contribution to the millimeter-continuum flux by free–free emission from the ionized gas component of the nebula.
We derive a kinematic distance of dk = 9 kpc (l = 11012, b = +193, VLSRsys = −85 km s−1). The bolometric flux, Fbol ∼ 250 L☉ kpc−2, leads to dL = 4.9 kpc. The visual ISM extinction in the direction to this object is AV < 4.7 mag and, therefore, the intrinsic (dereddened) bolometric flux is Fbol < 400 L☉ kpc−2, implying a lower limit to the distance of dL > 3.9 kpc. García Lario et al. (1991) estimate a distance of d = 6 kpc using the Shklovskii modified method. We adopt this value since it is within the range given by our estimates of dL and dk. At ∼6 kpc, the visual ISM extinction is AV = 1.8 mag, which implies a dereddened bolometric flux and total luminosity of Fbol ∼ 250 L☉ kpc−2 and L ∼ 9000 L☉, respectively.
3.2.24. IRAS 23166+1655 (RAFGL 3068; V* LL Peg)
This is a well-known C-rich Mira variable enshrouded in a thick dust envelope (e.g., Volk et al. 1992). HST images show an extended envelope traced out to a distance of ∼40'' from the center and a remarkable single-armed spiral pattern (Mauron & Huggins 2006). The spiral pattern corresponds closely to the spiral shocks found in models of mass loss in binary systems (Mastrodemos & Morris 1999). The arms of this pattern are brighter to the northwest (P.A. = −30°). In the mid-IR, subarcsecond-resolution 8–12 μm images show an unresolved source (Lagadec et al. 2011). Near-IR observations using AO reveal that IRAS 23166+1655 has two point-like components at its nucleus (presumably a binary system) separated by 011 (Morris et al. 2006).
Emission from CO and other molecules have been previously reported (e.g., Knapp & Morris 1985; Bujarrabal et al. 1994; Neri et al. 1998; Woods et al. 2003; Teyssier et al. 2006; Zhang et al. 2009). Maps of the 12CO (J = 1–0) emission with 107 × 46 resolution by Neri et al. (1998) reveal a large outer circumstellar nebulosity, with a ∼20'' angular diameter and presumably asymmetric, surrounding a more compact (∼37 × 28) inner envelope. Our data (Figures 3.24 and 4) show strong 12CO (J = 1–0) emission centered at VLSR = −30 km s−1 with a pseudo-parabolic profile consistent with nebular expansion at velocity Vexp = 13 km s−1. The comparison between the previous 12CO (J = 1–0) single-dish profile and that obtained from our interferometric data indicate flux losses of up to ∼70%–80% in the latter.
A double Gaussian ellipse has been fitted to our velocity-integrated 12CO map. We find two components oriented nearly perpendicularly to each other: The most compact one, with a deconvolved half-maximum size of 26 × 15, is oriented along P.A. ∼ +40°, whereas the outer one, with a deconvolved half-maximum size of 56 × 46, is oriented along P.A. ∼ −45° (see Table 5). The maximum extent of the outer envelope probed by our maps is ∼14'' × 10'' measured down to a 1σ level. The CO emission distribution is also found to be asymmetric at these large scales (with the long axis oriented along P.A. ∼ −40°). The smaller size of the CO outer envelope compared with that measured by Neri et al. (1998) likely results from interferometric flux losses in our maps. We do not measure a velocity gradient in our CO maps. This prevents us from elucidating the structure of the inner and outer envelope components: We speculate that the former could represent an equatorially dense region or a bipolar flow, and the latter is probably more consistent with an elongated shell.
Our 13CO (J = 1–0) maps show a horn-like or double-peaked line profile (Figure 5). The 13CO-emitting region is partially resolved and is reasonably well fitted by one Gaussian ellipse with deconvolved half-maximum size 45 × 28 and oriented along P.A. ∼ −33°.
We detect a 2.6 mm continuum emission source with a deconvolved half-maximum size of 25 × 1'' and oriented similarly (within errors) to the outer 12CO envelope. The elongation of the large CO- and 2.6 mm continuum-emitting envelope is also similar to that of the nebula visible through scattered light in the optical, which points to an intrinsic large-scale asymmetry of the envelope along the NW direction. The continuum flux at 2.6 mm and in the 450–1000 μm range (measured by Groenewegen et al. 1993) are in clear excess over the value expected extrapolating the object's SED in the IRAS wavelength range. This millimeter and sub-millimeter excess points to an additional component of dust grains much cooler than those responsible for the thermal emission at shorter wavelengths (∼100–150 K).
We adopt a distance to this object of d = 1.1 kpc (e.g., Teyssier et al. 2006, and references therein), which implies a total luminosity of  L☉. Since IRAS 23166+1655 is a high-latitude star (b = −40°), i.e., does not belong to the disk population, and therefore does not follow a standard disk rotation curve, we have not estimated
  , which would be highly unreliable.
3.2.25. IRAS 23304+6147 (GLMP 1078)
This object is a C-rich PPN with a G2 Ia central star (e.g., Hrivnak 1995; Bujarrabal et al. 2001; Hrivnak et al. 2007, and references therein). The optical nebula imaged with HST has a bipolar (maybe quadrupolar) shape (Sahai et al. 2007a). The lobes are surrounded by a round halo traced out to a radius of r ∼ 55 with a non-uniform radial brightness distribution suggestive of distinct mass-loss episodes. A bright, marginally unresolved (PSF = 11) 12.5 μm counterpart is reported by Meixner et al. (1999). The central star displays a regular cyclical light variation in the optical with a period of ∼80 days (Hrivnak et al. 2010).
A 12CO (J = 1–0) single-dish detection toward this object is reported by Likkel et al. (1991). 12CO J = 2–1, J = 3–2, and J = 4–3 spectra have been obtained recently (Bujarrabal et al. 2001; Hrivnak & Bieging 2005). Our data show strong 12CO (J = 1–0) emission centered at VLSRsys = −16 km s−1 with an intense core plus weak and broader wings (Figures 3.25 and 4). By comparing our 12CO profile with the single-dish spectrum by Likkel et al. (1991), we conclude that our interferometric data are not affected by flux losses. The CO envelope has a deconvolved half-maximum size of ∼36 × 25 and its long axis is oriented perpendicularly to the main optical lobes. This suggests an equatorially enhanced density distribution in the molecular envelope. The maps of CO emission integrated over the red and blue line wings show two clumps aligned with the optical lobes and separated by ≲1''. As for the PPN IRAS 20000+3239 (Section 3.2.19), the observed gradient is probably tracing a compact bipolar flow: The approaching (receding) flow component is displaced to the SW (NE) from the center. In this interpretation, the lobe orientation inferred from the CO velocity gradient is consistent with that suggested by the brightness contrast between the optical lobes, which independently suggest that the faint, NE optical lobe is the one lying behind the dense, obscuring equatorial regions of the envelope. We detect weak 13CO (J = 1–0) emission from this object for the first time (Figure 5).
We adopt a distance to IRAS 23304+6147 of  kpc considering the value of its bolometric flux ∼330 L☉ kpc−2. The total ISM extinction across the Galaxy in the direction to this object is AV = 4.8 mag and, therefore, the intrinsic (dereddened) bolometric flux is Fbol < 780 L☉ kpc−2, implying a lower limit to the distance of dL > 2.7 kpc. At ∼4 kpc, we find AV ∼ 2.5 mag and, therefore, dereddened bolometric flux and luminosity of Fbol ∼ 440 L☉ and ∼7000 L☉, respectively. Taking into account its galactic coordinates and radial velocity (l = 11386, b = +0059, and VLSRsys = −16 km s−1), the kinematic distance to IRAS 23304+6147 is dk = 1.5 kpc; such a small distance is unlikely since it implies a very low luminosity for a pAGB star (<1000 L☉).
4. ANALYSIS
4.1. Envelope Size and Asymmetry
The size and asymmetry of the CO and 2.6 mm continuum-emitting envelopes of OPACOS sources have been derived and parameterized as explained in Section 3.1 (see also Table 5). In this section, we present a summary of the typical values found for these two parameters.
In Figure 6 we plot the deconvolved half-maximum diameter (θ1/2) of the CO envelopes derived from our maps. For sources with extended CO emission, θ1/2 ranges between 1'' and 57, with a median value of 21. The sources with the largest (>5'') envelopes are IRAS 23166+1656, IRAS 19255+2123, IRAS 19548+3035, IRAS 18055−1833, and IRAS 22568+6141. In IRAS 22568+6141, the relatively small value of θ1/2 ∼ 2'' results from the narrowness of its bipolar lobes, with θa ∼ 65 along its major symmetry axis but only θb ∼ 06 along the minor axis. All sources that are spatially unresolved in our sample (a total of 6 out of 24) have CO envelopes with θ1/2 ≲ 2''.

Figure 6. Mean angular diameter (beam-deconvolved) of the CO envelope at half the maximum intensity (θ1/2; see Sections 3.1 and 4.1) vs. the half-power beam width (HPBW). Dots (triangles) are used for extended (point-like) sources. Big green circles surround targets without previous single-dish 12CO (J = 1–0) data. For IRAS 23166+1655, sizes for both the inner and outer envelope are plotted (Table 5). In this case, the value of θ1/2 for the outer envelope is probably a lower limit due to interferometric flux losses (Section 4.1.1). Some targets discussed in Section 4.1 are labeled.
Download figure:
Standard image High-resolution imageWe find CO envelope asymmetries (a/b > 1) in all extended sources. For the specific reasons given in Section 3.2 for each individual target, the asymmetries are probably real even for the objects in our sample with envelopes marginally resolved (except for, maybe, IRAS 18135−1456 and IRAS 18460−0151—see the next paragraph) and in the few objects for which the asymmetry parameter a/b is small and in the limit of being consistent with a spherical envelope within the errors. For sources with extended CO emission, a/b ranges between ∼1.2 and ∼6. The source with the largest CO asymmetry parameter is IRAS 22568+6141, for which an elongated CO envelope with a point-like morphology that resembles that of the optical/NIR nebula is observed (Figure 3.23).
For IRAS 18135−1456 and IRAS 18460−0151, marginally extended in our maps, there are no published maps at other wavelengths showing resolved emission that could be used for an independent confirmation of the tentative departure from spherical symmetry and velocity gradient in their CSEs inferred from our data (Sections 3.2.3 and 3.2.8).
For sources with extended continuum emission (4 out of 10), θ1/2 ranges between 16 and 51, with a mean value of ∼33. The 2.6 mm continuum-emitting envelopes of most sources, including both extended and point-like, are rather compact, with angular sizes of θ1/2 < 25 for 8 out of 10 objects. The largest continuum envelopes (θ1/2 ≳ 4'') are found in IRAS 19234+1627 (PN) and IRAS 22568+6141 (yPN); for these two sources the nature of the 2.6 mm continuum-emitting region is well aligned with the optical nebula and in both cases the continuum emission is probably free–free emission (Section 3.2).
4.1.1. Interferometric Flux Losses
The lack of zero spacing data in our interferometric maps may result in flux loss of large emission structures with a smooth brightness distribution. For our targets, the flux losses, whenever present, are expected to mainly affect spectral channels around the line center, which typically arise in the extended, low-velocity remnant of the AGB CSE. Considering the shortest baselines in our observations, only emission structures larger than ∼18'' are expected to be resolved out (Table 2).
For 16 of a total of 24 circumstellar CO detections in our survey, we can evaluate whether or not there are interferometric flux losses by comparing our CO profiles, integrated over the whole nebula, with results from single-dish observations, including flux upper limits from previous non-detections. As we discuss in Section 3.2, there is only one source in our sample, the C-rich AGB star IRAS 23166+1655, for which significant 12CO (J = 1–0) flux losses of up to 80% are confirmed. Such losses were expected given the large size of the CSE around this star, which has an angular diameter ≳20'' as derived from previous 12CO interferometric maps (Neri et al. 1998) and a much larger extent indicated by HST images of the scattered light in the visible (Mauron & Huggins 2006). For one source, IRAS 19566+3423, the upper limit to the CO flux obtained from the single-dish non-detection reported by Likkel et al. (1991) is larger than the flux measured by us and, therefore, interferometric flux losses cannot be evaluated from this comparison. However, the small angular size of the CO envelope of this object, which is unresolved (θ1/2 < 2''), together with the large beam of our map (∼81) makes flux losses unlikely.
For the remaining 14 sources with single-dish data, including those with the largest envelopes (IRAS 19548+3035 and IRAS 19255+2123 with θ1/2 > 5''), our OPACOS CO profiles are consistent with no significant flux losses within the errors/noise and flux calibration uncertainties of the data. For some of these sources, the 12CO (J = 1–0) single-dish flux is even smaller than the flux measured with the interferometer. We attribute such discrepancies partially to the flux error bars in both data sets but also to the poor knowledge of the target coordinates and possible pointing errors in previous single-dish studies (especially in the earliest works performed during the late 1980s and early 1990s), which may have resulted in partially missing the emission from the target. In that sense, we expect interferometric data to provide a more reliable estimate of the flux due to the more accurate location of the CO-emitting region. Moreover, as explained in Section 1, interferometric data are less severely affected by contamination of the circumstellar profile by the diffuse, extended ISM than single-dish spectra.
For one-third of our CO detections (8 out of 24), no 12CO (J = 1–0) single-dish data are available in the literature and, therefore, interferometric flux losses cannot be evaluated by flux comparison. (The IRAS names of these eight sources appear boldfaced and with no asterisk in Table 3.) Significant flux losses of large emission halos are unlikely to affect most of these targets given the small angular sizes of their CO envelopes compared with the beam size of their maps and the primary beam of the antennas, ∼60'' at 115 GHz (see Tables 2 and 5). In fact, these eight sources (marked with big empty circles in Figure 6) have envelopes with comparable or even smaller angular sizes, θ1/2, than sources with no appreciable flux losses confirmed by comparison with single-dish data (see above). Moreover, they have been observed with relatively large beams (>4''), except for IRAS 22036+5306 (beam ∼ 24).
Optical HST imaging supports the compactness of most of our targets with no single-dish CO spectra (see Sahai et al. 2007a, and Table 1): Three are spatially unresolved and, except for IRAS 22036+5306, the rest show scattered light envelopes with radius <5''. IRAS 22036+5306 has an optical halo that can be traced out to a distance from the star of ∼65. IRAS 22568+6141 has relatively extended (∼4''-long) lobes, however, no scattered halo has been detected in this case. The large distances to most objects (with a mean of d ∼ 5.5 kpc for the eight sources under discussion; see Table 1) also make the presence of very large CO halos unlikely: The CO photodissociation radius expected for typical values of the mass-loss rate and expansion velocity of  ≈ 10−5 M☉ yr−1 and Vexp = 14 km s−1 is RCO ∼ 2 × 1017 cm (Mamon et al. 1988; Planesas et al. 1990), which is equivalent to an angular radius of <2''–3'' at a distance of >5 kpc. Observationally, it is also well established that linear sizes of CO envelopes of most PPNs are in the range ≈1016–3 × 1017 cm (e.g., Neri et al. 1998; Teyssier et al. 2006).
In summary, given the small angular sizes of the CO envelopes expected, it is very unlikely for sources spatially unresolved or mapped with relatively large beams >4'' in our survey to be affected by significant interferometric flux losses. The only two exceptions may be IRAS 22036+5306 and IRAS 22568+6141, which have CO envelopes spatially well resolved in our OVRO maps with beams of ∼23 and ∼4'', respectively, and also show extended nebulosities in the optical images. The flux loss statistics of objects with single-dish data (1 out of 16) and their comparable (or even larger) envelope sizes to the eight objects with no single-dish data supports an equally small probability of significant flux losses in the latter.
4.2. Envelope Kinematics
4.2.1. Profile Components: The Presence of Broad Emission Wings
Line profiles of circumstellar CO emission around evolved stars provide information about the nebular kinematics, although they also depend on the optical depth of the line, the angular size of the envelope relative to the telescope beam, and excitation conditions throughout the CO-emitting layers (e.g., Olofsson et al. 1982; Olofsson 1996). The CO emission profiles in pAGB objects often display an intense-narrow line core plus weak-broader wings. The line core is believed to arise in the slow remnant of the AGB envelope, whereas the wings trace fast bipolar outflows of molecular gas presumably accelerated by interaction with fast winds later developed in the early pAGB or late-AGB phase (see Section 1).
We have investigated the presence of different kinematic components, slow and fast, in our sample by comparing the values of the FWZI and FWHM of the 12CO (J = 1–0) transition10 (Table 3). We have defined the dimensionless parameter γ ≡ FWZI/FWHM, which happens to be a useful indicator of the type of line profile and, in particular, of the presence of wings. As can be easily demonstrated, for a parabolic profile γ ∼  ∼ 1.4, whereas for a rectangular or horn-like shape γ ∼ 1. Values of γ > 1.4 result if there are wings superimposed on the narrow core or if the line has a triangular or Gaussian-like profile.11
Based on the values of γ measured in our sample and taking into account their error bars, there may be as many as 12 out of 24 sources with CO emission wings (Figure 7). Among these, the wings of IRAS 19024+0044 are tentative due to strong ISM contamination of the circumstellar CO profile, which result in a somewhat uncertain value of FWHM. Particularly remarkable are the broad, Gaussian-like profiles of IRAS 22036+5306 and IRAS 19374+2359, which display the broadest wings (FWZI > 120 km s−1) in our sample (Figure 4). The fast winds responsible for these wide profiles are indeed even faster than inferred from our OPACOS data as indicated by the larger full width of the 12CO (J = 3–2) line in IRAS 22036+5306 (FWZI ∼ 400 km s−1; Sahai et al. 2006) and the single-dish 12CO (J = 2–1) profile observed in IRAS 19374+2359 by C.S.C. (FWZI ∼ 300 km s−1; to be published elsewhere). In addition to these two sources with clear wing-dominated profiles, there are a few other objects that also show wings but significantly weaker than the line core. Some clear examples, in which the wings and the line core can be easily identified as different components of the profile, are IRAS 19475+3119, IRAS 23304+6147, and IRAS 22223+4327 (Figure 4). In the rest of cases, the presence of weak wings is more subtle and cannot be readily guessed by simple inspection of their profiles (e.g., IRAS 23166+1655 and IRAS 20000+3239). This makes γ a useful parameter for a systematic search of wings or, more generally, of deviations from the standard profile in AGB CSEs, which can be interpreted as an indication of kinematic complexity. We note that, of course, small values of γ (<1.4) do not demonstrate the absence of emission wings, which may remain undetected below the noise level.

Figure 7. CO line width (FWZI and FWHM) in our sample (Table 3 and Section 4.2.1). The red and blue lines indicate the expected values of FWZI and FWHM for rectangular/horn-like and parabolic profiles, respectively. Data points above those values (with purple labels) suggest the presence of line emission wings.
Download figure:
Standard image High-resolution image4.2.2. Expansion Velocity
Obtaining an estimate of the nebular expansion velocity from the CO line profile is not straightforward (even ignoring optical depth effects or ISM contamination of the profile). In the case of multiple kinematic components or significant velocity gradients in the molecular envelope, the mere definition of a unique expansion velocity is clearly not appropriate. In these cases, ideally, one would like at least to be able to obtain separately the "characteristic" expansion velocity of the slow AGB envelope (VAGB) and that of the fast pAGB flow projected on the line of sight (V*pAGB).
Keeping in mind these limitations and the resulting uncertainties, we have obtained estimates of VAGB and V*pAGB (Table 6). The determination of VAGB has been made by fitting a function of the type ![$I_v \propto 1-[(v-\mbox{$V_{\rm LSR}$})/\mbox{$V_{\rm AGB}$}]^\alpha$](https://content.cld.iop.org/journals/0067-0049/203/1/16/revision1/apjs445275ieqn19.gif) to the 12CO (J = 1–0) line core (note that by choosing α = 2 and α ≫ 2, this function produces parabolic and horn-like profiles, respectively). For sources with 12CO and 13CO (J = 1–0) detections, the values of VAGB measured from both profiles are consistent, with differences <2 km s−1 in all cases, except for IRAS 18560+0638, IRAS 19374+2359, and IRAS 22036+5306. In these cases, the most reliable values of VAGB derived from the 13CO (J = 1–0) profile are given in the table: we note the strong ISM contamination of the 12CO profile toward IRAS 18560+0638; in the case of IRAS 19374+2359 and IRAS 22036+5306, the line core can be best isolated from the wings in the 13CO profile. For objects with emission wings (γ > 1.4, Section 4.2.1), we have adopted V*pAGB = FWZI/2. Assuming that the wings arise in a bipolar flow with a given inclination with respect to the plane of the sky, i, V*pAGB represents a lower limit to the maximum axial velocity of the fast flow projected on the line of sight. (The lower limit arises because FWZI may be sensitivity limited.) The maximum deprojected expansion speed of the pAGB winds is given by V*pAGB/sin (i), however, the inclination of the lobes is unknown in all cases (except for IRAS 19306+1407, for which |i| ∼ 5°; Lowe & Gledhill 2007).
to the 12CO (J = 1–0) line core (note that by choosing α = 2 and α ≫ 2, this function produces parabolic and horn-like profiles, respectively). For sources with 12CO and 13CO (J = 1–0) detections, the values of VAGB measured from both profiles are consistent, with differences <2 km s−1 in all cases, except for IRAS 18560+0638, IRAS 19374+2359, and IRAS 22036+5306. In these cases, the most reliable values of VAGB derived from the 13CO (J = 1–0) profile are given in the table: we note the strong ISM contamination of the 12CO profile toward IRAS 18560+0638; in the case of IRAS 19374+2359 and IRAS 22036+5306, the line core can be best isolated from the wings in the 13CO profile. For objects with emission wings (γ > 1.4, Section 4.2.1), we have adopted V*pAGB = FWZI/2. Assuming that the wings arise in a bipolar flow with a given inclination with respect to the plane of the sky, i, V*pAGB represents a lower limit to the maximum axial velocity of the fast flow projected on the line of sight. (The lower limit arises because FWZI may be sensitivity limited.) The maximum deprojected expansion speed of the pAGB winds is given by V*pAGB/sin (i), however, the inclination of the lobes is unknown in all cases (except for IRAS 19306+1407, for which |i| ∼ 5°; Lowe & Gledhill 2007).
Table 6. Envelope Expansion Velocity Indicators
| Source | VEW | 2 × VMASS | VAGB | V*pAGB |
|---|---|---|---|---|
| (IRAS No.) | (km s−1) | (km s−1) | (km s−1) | (km s−1) |
| 03206 | 12.3 | 8.8 | 9 | ... |
| 18055 | 36.9 | 27.2 | 25 | ... |
| 18135 | 22.7 | 17.4 | 16 | 25 |
| 18167 | 14.0 | 9.2 | 9 | ... |
| 18276 | 19.6 | 15.2 | 17 | ... |
| 18348 | 18.7 | 11.2 | 13 | ... |
| 18420 | 23.5 | 14.8 | 19 | ... |
| 18460 | 22.7 | 13.8 | 17 | ... |
| 18560 | 24.6 | 22.2 | 19a | ... |
| 19024 | 15.7 | 13.6 | 13 | 17 |
| 19255 | 24.7 | 22.4 | 17 | ... |
| 19292 | 21.5 | 14.0 | 15 | ... |
| 19306 | 10.0 | 12.0 | 5 | 8 |
| 19374 | 89.2 | 78.4 | 10a | 150b |
| 19475 | 24.6 | 14.4 | 15 | 33 |
| 19548 | 29.1 | 17.6 | 23 | ... |
| 19566 | 15.2 | 19.6 | 9 | 24 |
| 20000 | 15.0 | 10.6 | 11 | 14 |
| 22036 | 49.3 | 50.2 | 8a | 200b |
| 22177 | 23.0 | 15.8 | 17 | ... |
| 22223 | 19.6 | 12.2 | 14 | 28 |
| 22568 | 24.3 | 32.4 | 14 | 28 |
| 23166 | 18.0 | 10.4 | 13 | 17 |
| 23304 | 17.7 | 10.8 | 11 | 19 |
Notes. In all cases, V*pAGB = FWZI/2 represents a lower limit to the expansion velocity of the fast pAGB flow projected on the line of sight; VAGB represents the expansion velocity of the slow remnant AGB envelope calculated as explained in Section 4.2.2. aThe most reliable value derived from the 13CO (J = 1–0) profile is given. bDerived from CO data, other than OPACOS, with larger spectral coverage (see Section 4.2.1).
Download table as: ASCIITypeset image
The distribution of values obtained for VAGB is given in Figure 8. Our results are in good agreement with values of the expansion velocity of AGB CSEs estimated in previous studies (e.g., Loup et al. 1993; Olofsson et al. 1993). We find that, on average, VAGB is larger in objects with no wings detected (mean VAGB = 17 km s−1) than in objects with wings (mean VAGB = 12 km s−1). The maximum projected expansion velocities of the flows inferred from the wing widths range between V*pAGB = 8 and 200 km s−1, with a median of V*pAGB = 25 km s−1 (Figure 9). In all cases, except for IRAS 19374+2359 and IRAS 22036+5306, V*pAGB is smaller than 35 km s−1.

Figure 8. Distribution of VAGB for all 24 targets with circumstellar CO emission (left), objects with no CO wings (middle), and with wings (right).
Download figure:
Standard image High-resolution image
Figure 9. Values of V*pAGB and VAGB for sources with 12CO (J = 1–0) emission wings. As explained in Section 4.2.2, the broad wings of IRAS 19374+2359 and IRAS 22036+5306 are truncated in our OPACOS data (empty triangles); in these two cases, more realistic values of V*pAGB have been obtained from 12CO J = 2–1 and 3–2 spectra (filled circles).
Download figure:
Standard image High-resolution image4.2.3. Alternative Velocity Indicators
We have defined and calculated two other parameters that are expected to be velocity indicators, which we designate as equivalent-width velocity, VEW, and the mass-weighted velocity, VMASS (Table 6). The former is given by the ratio of the 12CO (J = 1–0) line flux (in units of Jy km s−1) to the peak intensity (Jy), that is  ; whereas VMASS is defined as the ratio of the velocity integral of the 12CO (J = 1–0) profile multiplied by the projected velocity relative to VLSRsys (in units of Jy km s−1 km s−1) to the CO line flux, i.e.,
  . Strictly, VMASS is only a mass-weighted velocity when the emission is optically thin.
We find that the values of the FWHM and VEW are similar in most cases and, therefore, these are similarly good or bad indicators of the mean expansion velocity. VMASS is on average smaller than FWHM by a factor in the range 1.6–3.6 (median is ∼3). According to its definition, this is expected, since the emission from the intense but narrow line core has more weight than the weak-broad wings. There are a few outliers of the linear relationship between FWHM and VMASS followed by most objects: IRAS 19306+1407, IRAS 19566+3423, IRAS 22568+6141, and IRAS 22036+5306. This is because all these objects have broad wings that contribute significantly to the ∫Ivvdv integral, enhancing the value of VMASS. In this sense, VMASS can be considered an indirect indicator of the fraction of the mass that has been accelerated (i.e., in the fast flow): The larger the intensity of the wings is relative to the core, the larger the value of VMASS will be.
In the case of an isotropic wind expanding at constant velocity, which is usually taken to be a good approximation for the undisturbed AGB CSE, VMASS relates to the expansion velocity by VAGB =  , assuming optically thin emission (see Bujarrabal et al. 2001). We have represented
  versus VAGB of the AGB remnant in Figure 10. As we can see, most data points satisfy the VAGB =
  relationship with little scatter. The points below the VAGB =
  line may result from moderate opacity effects on the 12CO (J = 1–0) profile; note also that ISM absorption or emission features in the circumstellar profile as well as any flux losses in the line core may alter the values of VMASS. Again, there are five sources notably above the VAGB =
  , which is explained by the presence of relatively intense, broad wings that contribute significantly to VMASS in these cases.

Figure 10. Values of  vs. VAGB (Section 4.2.3). The solid line represents the linear function VAGB =
  , which is expected for spherical shells expanding at constant velocity VAGB with optically thin emission. Some points above the line correspond to sources with broad wings relatively intense with respect to the line core.
Download figure:
Standard image High-resolution image4.3. 13CO/12CO Integrated Intensity Ratio
For objects with 13CO detections, we have calculated the 12CO to 13CO (J = 1–0) integrated intensity ratio, hereafter referred to as RI. There is a linear correlation between the intensity of both transitions. Our best fit of the data points by a linear function is
As shown in Figure 11 (left panel), all of our targets show values of RI well above the optically thick limit, i.e., the ratio obtained if both the 12CO and 13CO (J = 1–0) lines are optically thick (τ12 ⩾ 1 and τ13 ⩾ 1), which is RI ∼ 1.1. This is assuming that both transitions arise in the same envelope layers and have similar excitation temperatures throughout the bulk of the emitting nebula.
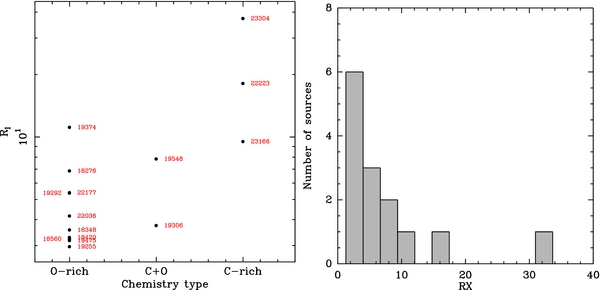
Figure 11. Left: values of the 12CO-to-13CO (J = 1–0) line flux ratio, referred to as  , as a function of the source chemistry. Right: distribution of the 12CO/13CO abundance ratio derived in the optically thin limit, RX (Section 4.3); RX is a lower limit to the real value for optically thick 12CO emission.
Download figure:
Standard image High-resolution imageIf both the 12CO and 13CO transitions are optically thin, then the observed line strength ratio RI provides a first-order estimate of the isotope abundance ratio, RX ≡ 12CO/13CO ∼ A13/A12 × RI, where A12 = 7.2 × 10⁻⁸ s−1 and A13 = 6.3 × 10⁻⁸ s−1 are the Einstein coefficients for spontaneous emission of the J = 1–0 rotational transition of 12CO and 13CO, respectively. If the 12CO (J = 1–0) line is optically thick, which is possible in some of our targets, then RX is a lower limit to the real 12C/13C ratio. Detailed radiative transfer analysis is needed in order to take into account optical depth effects (Schöier & Olofsson 2000). Moreover, for a most reliable estimate of the 12C/13C ratio, the line strengths of several rotational transitions, and not only the J = 1–0, are necessary (de Beck et al. 2010).
The values of RX derived in the optically thin limit, which are represented in Figure 11 (right panel), are considerably lower than the solar and local ISM 12C/13C values, ∼89 and ∼69, respectively, but in very good agreement with values found in evolved stars (Milam et al. 2009, and references therein). To date, there are very few measurements of the 12C/13C ratio in PPNs and PNs (most studies are done using moderate samples of AGB stars), but typical values are in the range 10–25, with an increasing number of objects with values ⩽10 and in some cases as low as 3–4 (e.g., Sánchez Contreras et al. 2000; Sahai et al. 2000). All these values are much lower than those predicted by standard models of 12C and 13C enrichment in the latest evolutionary stages of intermediate mass stars and, because of such discrepancies, additional mixing mechanisms have been postulated (e.g., Milam et al. 2009). The objects in our sample with the largest RX are the C-rich sources IRAS 23304+6147 and IRAS 22223+4327. This is consistent with the larger values of 12C/13C found for C-rich envelopes compared with O-rich shells (Schöier & Olofsson 2000; Milam et al. 2009; de Beck et al. 2010).
The reasonable agreement of the RX values derived in the optically thin limit and the typical range of 12C/13C isotope ratios observed in evolved stars (including AGB, PPNs, and PNs) may suggest that for some of our objects the 12CO (J = 1–0) line is optically thin or only moderately opaque. In spite of that, as mentioned earlier in this section, the values of RX derived in this work should be conservatively considered as lower limits to the real 12C/13C ratio.
4.4. Mass and Dynamics of the Molecular Envelope
We have obtained a first-order estimate of the mass in the molecular envelopes from the integrated 12CO (J = 1–0) flux assuming that the line is optically thin (a lower limit to the mass is obtained in the case of optically thick emission). The CO excitation is described by a rotational temperature that it is assumed to be similar to the kinetic temperature, Tkin, i.e., we are assuming CO lines are thermalized. This is a reasonable approximation for most PPNs, which usually have densities larger than the 12CO (J = 1–0) critical density (≈103 cm−3) in most regions of their envelopes (see, e.g., Bujarrabal et al. 2001, and references therein). Adopting Tex = 20 K, which is a common value in PPNs (Bujarrabal et al. 2001), relative CO-to-H2 abundances of X(12CO) = 8 × 10⁻⁴, 3 × 10⁻⁴, and 5 × 10⁻⁴ for targets with a C-rich, O-rich, and C+O mixed chemistry, respectively (see, e.g., Teyssier et al. 2006, and references therein), and the well-known molecular parameters of CO (e.g., Rohlfs & Wilson 2000) we derive the values of the molecular mass (M12CO) given in Table 7. For 13CO (J = 1–0) detections, another estimate of the molecular mass has been obtained from this line, which is very likely optically thin (M13CO in Table 7). We have also adopted Tex = 20 K and a 13CO-to-H2 abundance of X(13CO) = 2 × 10⁻⁵; that is, we are implicitly assuming a mean 12CO-to-13CO isotopic ratio of ∼15 and ∼40 for O- and C-rich objects, respectively, in agreement with the average values found by Milam et al. (2009).
Table 7. Physical Parameters Derived
| Source | M12COa | M13CO | Pmin | XpAGB | d | Rmax | tAGB |  1 1 |
 2 2 |
|---|---|---|---|---|---|---|---|---|---|
| (IRAS No.) | (M☉) | (M☉) | (M☉ km s−1) | (%) | (kpc) | (cm) | (yr) | (M☉ yr−1) | (M☉ yr−1) |
| 03206 | 0.005 | ... | 0.09b | ... | 3.4 | <4.1 × 10¹⁷ | <14500 | >1.4 × 10⁻⁶ | <2.3 × 10⁻⁵ |
| 18055 | 0.017 | ... | 0.92b | ... | 2.0 | 3.5 × 10¹⁷ | 4500 | 1.5 × 10⁻⁵b | 3.7 × 10⁻⁵ |
| 18135 | 0.027 | ... | 0.96b | 9 | 2.5 | 2.0 × 10¹⁷ | 4000 | 2.8 × 10⁻⁵b | 1.0 × 10⁻⁵ |
| 18167 | 0.026 | ... | 0.46b | ... | 7.0 | <4.8 × 10¹⁷ | <17000 | >5.9 × 10⁻⁶ | <3.1 × 10⁻⁵ |
| 18276 | 0.035 | 0.090 | 0.68 | ... | 3.0 | 3.7 × 10¹⁷ | 7000 | 1.3 × 10⁻⁵ | 3.1 × 10⁻⁵ |
| 18348 | 0.002 | 0.011 | 0.06 | ... | 1.1 | 5.7 × 10¹⁶ | 1400 | 7.9 × 10⁻⁶ | 1.0 × 10⁻⁶ |
| 18420 | 0.058 | 0.317 | 2.35 | ... | 6.0 | 4.1 × 10¹⁷ | 6800 | 4.7 × 10⁻⁵ | 3.8 × 10⁻⁵ |
| 18460 | 0.078 | ... | 2.14b | ... | 7.0 | 3.9 × 10¹⁷ | 7300 | 4.2 × 10⁻⁵b | 3.4 × 10⁻⁵ |
| 18560 | 0.003 | 0.017 | 0.19 | ... | 1.4 | 1.9 × 10¹⁷ | 3200 | 5.3 × 10⁻⁶ | 1.0 × 10⁻⁵ |
| 19024 | 0.160 | ... | 4.35b | 9 | 10.0 | 5.7 × 10¹⁷ | 14000 | 4.6 × 10⁻⁵b | 5.3 × 10⁻⁵ |
| 19255 | 0.019 | 0.120 | 1.34 | ... | 4.0 | 5.1 × 10¹⁷ | 9500 | 1.3 × 10⁻⁵ | 5.2 × 10⁻⁵ |
| 19292 | 0.077 | 0.250 | 1.75 | ... | 5.0 | 6.9 × 10¹⁷ | 14000 | 1.8 × 10⁻⁵ | 8.1 × 10⁻⁵ |
| 19306 | 0.007 | 0.060 | 0.36 | 30 | 5.5 | <5.6 × 10¹⁷ | <36000 | >1.7 × 10⁻⁶ | <1.7 × 10⁻⁵ |
| 19374 | 0.758 | 1.210 | 47.4 | 80 | 11.0 | <1.5 × 10¹⁸ | <48000 | >2.0 × 10⁻⁵ | <2.4 × 10⁻⁴ |
| 19475 | 0.065 | 0.367 | 2.64 | 7 | 3.5 | 3.9 × 10¹⁷ | 8200 | 4.5 × 10⁻⁵ | 3.0 × 10⁻⁵ |
| 19548 | 0.211 | 0.800 | 7.04 | ... | 4.0 | 5.0 × 10¹⁷ | 6900 | 1.2 × 10⁻⁴ | 4.0 × 10⁻⁵ |
| 19566 | 0.026 | ... | 0.98b | 50 | 9.0 | <1.0 × 10¹⁸ | <35000 | >2.8 × 10⁻⁶ | <7.0 × 10⁻⁵ |
| 20000 | 0.017 | ... | 0.36b | 10 | 3.0 | 4.1 × 10¹⁷ | 12000 | 5.7 × 10⁻⁶b | 1.2 × 10⁻⁵ |
| 22036 | 0.060 | 0.261 | 6.55 | 55 | 4.0 | 1.6 × 10¹⁷ | 3500 | 7.5 × 10⁻⁵ | 6.9 × 10⁻⁶ |
| 22177 | 0.008 | 0.029 | 0.23 | ... | 2.4 | <3.0 × 10¹⁷ | <5600 | >5.2 × 10⁻⁶ | <2.1 × 10⁻⁵ |
| 22223 | 0.030 | 0.080 | 0.49 | 7 | 4.0 | 2.9 × 10¹⁷ | 6500 | 1.2 × 10⁻⁵ | 7.4 × 10⁻⁶ |
| 22568 | 0.034 | ... | 2.27b | 35 | 6.0 | 5.1 × 10¹⁷ | 11000 | 1.3 × 10⁻⁵b | 4.6 × 10⁻⁵ |
| 23166c | >0.008 | >0.042 | >0.22 | <3 | 1.1 | >9.6 × 10¹⁶ | >2400 | 1.7 × 10⁻⁵ | >1.1 × 10⁻⁶ |
| 23304 | 0.041 | 0.051 | 0.28 | 9 | 4.0 | 2.6 × 10¹⁷ | 7400 | 6.9 × 10⁻⁶ | 5.1 × 10⁻⁶ |
Notes. Assumptions and methods are detailed in Sections 4.4 and 4.5. aM12CO is probably a lower limit to the total mass (M); a mean correction factor of four has been estimated, i.e., M ∼ M13CO ∼ 4 × M12CO (Section 4.4). bGiven the lack of 13CO (J = 1–0) data in this case, we have assumed that M = 4 × M12CO (Section 4.4). cUncertain results due to strong interferometric flux losses.
Download table as: ASCIITypeset image
The masses M12CO and M13CO obtained are plotted in Figure 12. As seen in this figure, the values of the mass derived from 13CO (J = 1–0) are systematically larger than those derived from the 12CO line by a mean/median factor ∼4. (IRAS 19374+2359 and IRAS 23304+6147 are exceptions, with M12CO ∼ M13CO.) In principle, this difference could result from a moderate or high optical depth in the 12CO (J = 1–0) transition or from adopting too large a value for the 12CO-to-13CO isotopic ratio (i.e., the X(12CO) assumed could be overestimated and/or the X(13CO) underestimated)—both effects could also take place simultaneously. Since we cannot rule out some optical depth effects in the 12CO (J = 1–0) line, the value of M12CO in Table 7 is considered to be a lower limit to the real molecular mass, M, which is probably better represented by M13CO.

Figure 12. Left: histogram of the 12CO- and 13CO-derived masses (M12CO: filled-gray bars; M13CO: empty bars—Section 4.4 and Table 7). Right: M12CO and M13CO values for 13CO (J = 1–0) detections; abbreviated IRAS names are given. The dashed line represents the function M13CO = 4 × M12CO.
Download figure:
Standard image High-resolution imageA lower limit to the "scalar" linear momentum (Pmin; the integration of the linear momentum moduli over the whole molecular envelope) has been estimated following the method and assumptions presented by Bujarrabal et al. (2001), that is, by integrating over the full CO spectrum the values of the mass emitting in a given spectral channel of width Δv (mv∝IvΔv) multiplied by the projected expansion velocity of that gas parcel, v, relative to VLSRsys. The uncertainties and limitations of this calculation are described in detail by Bujarrabal et al. (2001). Taking into account our definition of VMASS (Section 4.2.3), the lower limit to the momentum can be simply expressed as the product of VMASS by the molecular mass in the envelope, i.e.,  . In deriving Pmin, we have used our most reliable estimate of the mass, which is M13CO and, in its absence, the mass derived from 12CO (J = 1–0) after applying the mean mass-correction factor estimated above, i.e., M = 4 × M12CO. The values of the minimum "scalar" momentum derived are given in Table 7.
In order to obtain the deprojected value of P, and not only a lower limit, one needs to know the density and velocity distributions of the molecular flows. As shown by Bujarrabal et al. (2001), in the case of an isotropic wind with a constant expansion velocity, the linear scalar momentum is given by Pisot = 2 × ∫mvvdv, whereas for a bipolar flow with a given inclination i with respect to the plane of the sky and overall axial expansion Pbip = ∫mvvdv/sin (i). As can be seen, for an intermediate inclination of i = 30°,  , that is, P is computed in the same manner for sources with or without evidence for fast flows. According to this, and assuming that the line core arises in a round envelope with a constant expansion velocity and that the wings (when present) arise in an axial flow with an intermediate inclination i = 30°, we expect the deprojected linear momentum P to be on average a factor ∼2 larger than the value of Pmin quoted in Table 7.
4.4.1. Mass Fraction in the pAGB Wind
For the 12 sources with 12CO (J = 1–0) emission wings denoting fast ejections (Section 4.2.1), we have obtained a rough estimate of the fraction of the mass contained in the fast wind, XpAGB = MpAGB/M, and in the slow remnant AGB envelope, XAGB = MAGB/M, which is responsible for the line core emission. For optically thin emission, XAGB is given by the ratio of the 12CO (J = 1–0) emission integrated over the line core only (i.e., over the velocity range  ) to the total line flux, obtained by integrating over the whole profile including the wings. The values of XpAGB are simply taken to be 1 − XAGB and are expressed in Table 7 as a percentage of the total mass M. We stress that these figures must be considered only as very rough guesses of the mass fraction in the fast component. The reason is twofold: First, we cannot rule out a moderate or high optical depth of the core emission in some cases, which would yield to an underestimate of XAGB; second, the fast wind is also expected to contribute (with an unknown amount) to the line core emission due to projection effects, which would result in an overestimate of XAGB. Both effects, with opposite actions on XAGB, could take place simultaneously.
As shown in Figure 13, in 7 out of 12 sources the mass carried out by the fast ejections relative to the total mass in the envelope is relatively small, of the order of ∼10% or less. Nevertheless, there are five objects for which XpAGB is significantly larger, with values ranging from 30% up to ∼60%–80% in IRAS 22036+5306 and IRAS 19374+2359, which are as expected the targets displaying the broadest, most intense emission wings.
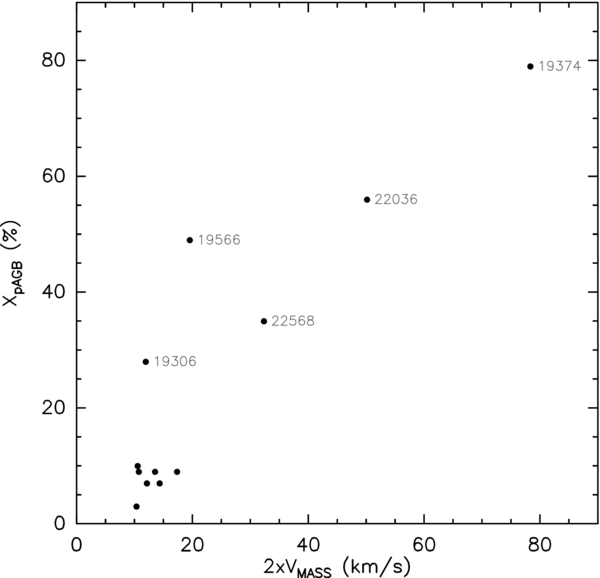
Figure 13. Fraction of the mass in the fast wind (whenever present) relative to the total mass, XpAGB, as a function of the velocity indicator  (Section 4.2.3 and Table 6). The objects with the largest values of XpAGB are labeled.
Download figure:
Standard image High-resolution image4.5. AGB Mass-loss Timescale and Mass-loss Rate
For sources with extended CO envelopes (18 out of 24—Section 3.1 and Table 5), we have estimated the kinematical age of the molecular envelope probed by 12CO (J = 1–0) emission, tAGB, from the ratio of the outer radius of the envelope, RoutAGB adopted to be Rmax = θmax/2d, and the expansion velocity of the AGB wind, VAGB. Results are given in Table 7 and Figure 14. We find values of Rmax in the range 5 × 10¹⁶ to 7 × 1017 cm with an average value of ∼4 × 1017 cm, in agreement with typical values in PPNs obtained from previous works (e.g., Neri et al. 1998; Teyssier et al. 2006). The mean value of the corresponding distribution of the nebular kinematical age is ∼7000 yr, which can be considered as a lower limit to the mean AGB mass-loss timescale. The lower limit arises because the outer boundary of the CO envelope measured in our maps, Rmax, could be sensitivity limited (and affected by flux losses, although only in ≲2–3 cases, Section 4.1.1); moreover, Rmax could represent the CO photodissociation radius and not a real density cutoff in the AGB wind marked by the beginning of the heavy AGB mass loss (i.e., Rmax = RCO < RoutAGB).
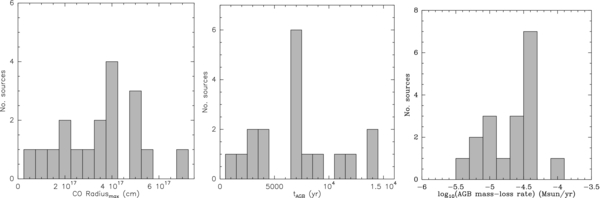
Figure 14. From left to right, distribution of the outer radius of the CO envelope (Rmax), AGB timescale ( ), and average AGB mass-loss rate
  = (
= ( 1+
1+ 2)/2 for sources with extended CO envelopes (see Section 4.5 and Table 7).
Download figure:
Standard image High-resolution imageWe have obtained a first-order estimate of the mean mass-loss rate during the AGB phase that led to the CO envelope following two different methods: (1) from the ratio of the total molecular mass (M13CO or, in its absence, M12CO multiplied by the mean mass-correction factor ∼4; see Section 4.4) to the AGB timescale computed above; and (2) using the relationship between the mass-loss rate and the photodissociation radius (RCO), the wind expansion velocity (VAGB), and the X(12CO) relative abundance as given by Mamon et al. (1988) and Planesas et al. (1990). In this latter case we assume that Rmax = RCO. We refer to these two different estimates of the mass-loss rate as  1 and
1 and  2, respectively (Table 7). In general, we find a quite good agreement between the two values taking into account the relatively large uncertainties associated with both methods (partially resulting from the poor knowledge of the diverse parameters involved in their derivation, namely, d, X(12CO), excitation conditions, mass-correction factor, possible mass-loss-rate variability, etc.).
The distribution of the mean AGB mass-loss rate, obtained as ( 1+
1+ 2)/2, in our extended sources is shown in Figure 14. Although the values of
  obtained in this work have to be considered first-order estimates, we have found reasonable agreement with previous results12 obtained from detailed radiative transfer models of one or more CO rotational transitions, which are available for a few of our targets (see, e.g., Groenewegen et al. 2002; Sánchez Contreras et al. 2006a; Sahai et al. 2006; Teyssier et al. 2006; Ramstedt et al. 2008; de Beck et al. 2010).
For sources with unresolved CO envelopes, we provide limits to Rmax, tAGB,  1, and
  2 (Table 7). We note that although, formally, the derived value of tAGB is an upper limit for point-like sources, the true kinematical age of their AGB CSEs could be larger than the value given in the table if, as explained above in this section, Rmax represents the CO photodissociation radius rather than the outer boundary of the envelope.
5. SUMMARY
In this section, we provide a brief summary of some of our results from OPACOS presented in this paper (first in a series). Our comprehensive, statistical analysis of all the parameters derived from our CO line and continuum emission maps and their correlations with other stellar and envelope properties obtained from multiwavelength data is deferred to Paper II.
5.1. Envelope Components: Bipolar Outflows and Tori?
Envelope asymmetries and/or velocity gradients are found in most OPACOS sources with extended CO envelopes (Sections 3.2 and 4.1). The presence of bipolar outflows and/or expanding equatorially dense toroidal structures, which are major structural components known to be common in PPNs, can be established from our maps with varying degrees of robustness depending on the data quality (mainly dictated by the angular resolution, sensitivity, and ISM contamination of the data). Although we can confidently argue for non-sphericity in a good fraction of the envelopes, for many of them the structures responsible for the asymmetries observed, e.g., the bipolar outflows or toroidal structures tentatively identified, need to be confirmed by higher-angular resolution and sensitivity CO emission maps. Also, given the moderate angular resolution in our SNAPshot CO emission survey, the "bipolar outflow" designation is used in this work in a broad sense that may include different elongated shapes (e.g., elongated shells, cylindrical flows, hourglass-like structures, axial clumps, etc.). Given the compactness of most OPACOS targets, and more generally of PPNs/yPNs, arcsecond or subarcsecond-resolution mapping is required to set robust constraints on their structure.
With these limitations in mind, let us summarize our results. Among the 18 OPACOS targets with extended CO emission, seven exhibit envelope characteristics consistent with torus-like structures and 12 show indications of bipolar/elongated outflows; in three of these cases, torus-like structures and bipolar outflows may be simultaneously present (and therefore are counted in both previous groups). Our data do not allow us to ascertain the envelope structure in two cases: the water-fountain PPN IRAS 18460−0151 and the AGB star IRAS 23166+1655.
Among the 18 sources with extended CO envelopes, three have no well-identified counterparts in optical/NIR high-angular resolution images and three have point-like optical/NIR counterparts. For the remaining 12 sources with extended CO and optical/NIR nebulae, eight have elongated CO outflows that are co-linear with the optical/NIR lobes; in the case of multipolar PPNs, the co-linearity is determined relative to the average orientation of the multiple optical lobes (since, except for IRAS 19475+3119, the angular resolution of our CO maps does not allow us to resolve individual lobes). In two cases, we find a CO-elongated outflow that is not aligned with the optical/NIR nebula: In the yPN IRAS 19255+2123, the CO outflow appears orthogonal to the optical lobes, and in the PPN IRAS 18420−0512, the CO outflow appears roughly perpendicular to the secondary, minor lobes visible in the optical images. In the remaining two cases, IRAS 18276−1431 and IRAS 23166+1655, the elongated CO emission probably does not represent a bipolar outflow.
It is evident that the nebular lobes visible in the optical images, e.g., through Hα or forbidden emission lines and/or dust scattered starlight, and the bipolar flows probed by CO rotational transitions contain gas with different physical conditions. Therefore, we do not expect to find perfect matches between the morphologies traced by different observational probes, even when the angular resolution is comparable. To date, the relationship between the CO bipolar flows and the optical lobes is not fully understood: In most cases both are the likely result of a common underlying agent (fast tenuous outflow), but a cause-and-effect relationship between the two cannot be ruled out in some objects.
5.2. Kinematics of the Molecular Envelope
From the analysis of the 12CO line profiles, weak-broad emission wings adjacent to the intense-narrow line core are present in at least roughly half of our sample (Section 4.2.1). The CO envelope kinematics is described adopting the standard interpretation that the line core arises in the remnant of the undisturbed AGB CSE whereas the wings trace fast outflows of material (originally in the slow AGB wind) accelerated by interaction with fast, pAGB winds (Section 1).
The large core-to-wing flux ratio found in most objects suggests that the fraction of material entrained by fast pAGB flows is relatively small (≲5%–10%) in the majority of the cases. There are, however, two objects with clearly wing-dominated profiles, the PPNs IRAS 19374+2359 and IRAS 22036+5306, indicative that most or all of the molecular envelope has been affected by recent interaction with fast ejections. These two sources also have the largest values of the scalar linear momentum Pmin in our sample (Table 7). To the best of our knowledge, there are only two other PPNs displaying similar triangular-shaped (i.e., wing-dominated) CO profiles: M 1-92 and He 3-1475 (Bujarrabal et al. 1997; Huggins et al. 2004).
The expansion velocities of the slow remnants of the AGB CSEs, VAGB, found in our sample (spanning a range of ∼5–25 km s−1 and with a median of VAGB = 14 km s−1; Section 4.2.2, Figure 8 and Table 6) are in good agreement with typical values measured in AGB CSEs from previous studies. The maximum projected expansion velocities of the molecular fast pAGB flows, V*pAGB, whenever these are present, are found to be moderately larger than VAGB, except for IRAS 19374+2359 and IRAS 22036+5306 (Figure 9 and Table 6).
In order to investigate how our results on V*pAGB compare with those obtained from previous works, we have looked at the collection of CO spectra presented by Bujarrabal et al. (2001), which includes all well-identified PPNs and yPNs detected in CO until 2001 (excluding the two hypergiants and the two RV Tau stars in Bujarrabal et al.'s studies). We have also added other objects from more recent observations (Hrivnak & Bieging 2005; Woods et al. 2005; Castro-Carrizo et al. 2010). We note that most values of V*pAGB obtained from these works correspond to the 12CO J = 1–0 and 2–1 transitions, and only a small fraction to J = 3–2 and 4–3 lines. Although certain differences in the profile shape of the different transitions are observed, the total width of the line wings, used to derive V*pAGB, is found to be roughly the same in all lines (see multiple-J CO spectra, from J = 1–0 and up to J = 16–15, in the references given above and also in Bujarrabal et al. 2012). Finally, for a homogeneous comparison of our FWZI measurements with those from previous works, which included only objects with central pAGB stars, we have excluded OPACOS targets classified as AGB stars (Table 1), although the presence of wings and their IRASf12/f25 colors indeed confirms that some of these have started evolving off the AGB (e.g., IRAS 19566+3423 and IRAS 23166+1655).
The distribution of V*pAGB = FWZI/2 obtained from the literature and from our survey is very similar (Figure 15): Although there are a few objects with CO profiles as wide as ≳300 km s−1, the vast majority of pAGB flows have moderate projected expansion velocities, with a median around V*pAGB = 20 km s−1. These relatively low values of V*pAGB could result from one of the following two possibilities. First, the intrinsic expansion velocities are low, typically <100 km s−1, if we assume that the inclination, i, of outflow axes in our objects is randomly spread over the full range of possible values. Second, the flows are much faster, with  km s−1, as found in some of the few PPNs with reliable estimates of i such as OH 231.8+4.2 (Alcolea et al. 2001) but there is a selection bias toward objects with bipolar flows oriented close to the plane of the sky. Such a bias, if present, would affect not only our sample but most "well-identified" PPNs and PNs observed in CO so far.

Figure 15. Distribution of V*pAGB = FWZI/2 obtained from the 12CO line profiles of PPNs, yPNs, and PNs from our OPACOS survey (empty-blue bars) and also including additional targets from the literature (filled-gray bars).
Download figure:
Standard image High-resolution image5.3. The Millimeter Continuum-emitting Region
Continuum emission at 2.6 mm is detected in 10 sources, four of them showing extended and asymmetric continuum-emitting regions (Table 5). Among these four, there is one, the PPN IRAS 19548+3035, for which the continuum-emitting structure is elongated in the direction perpendicular to the major axis of the large envelope and the inner bipolar flow probed by our 12CO maps (Section 3.2.17). The CO- and continuum-emitting envelopes of the remaining three objects have comparable orientations (for IRAS 23166+1655, this applies only to the CO outer envelope).
Although a detailed, quantitative description of the physical processes contributing to the observed 2.6 mm continuum flux will be done in Paper II, the nature of the continuum emission has been concisely discussed for each source in Section 3.2. We find that (1) in three objects (IRAS 19234+1627, IRAS 19255+2123, and IRAS 22568+6141) free–free emission is probably the main contributor to the millimeter-continuum flux; (2) in one object (IRAS 18135−1456), thermal emission by ≈100 K dust grains accounts for the source's SED from the IR to the mm-wavelength range; and (c) in five objects (IRAS 18276−1431, IRAS 19475+3119, IRAS 19548+3035, IRAS 22036+5306, and IRAS 23166+1655), an additional component of big, cold dust grains is probably needed to explain the observed millimeter continuum, which is in excess of that expected extrapolating the IR fluxes. In the case of one source, IRAS 20000+3239, we cannot ascertain the main contributor to the 2.6 mm continuum flux (free–free or big, cold grains?—see Section 3.2.19). Among the three free–free continuum-dominated sources (case (1) above), IRAS 19234+1627 and IRAS 22568+6141 show well-resolved continuum-emitting regions with similar morphology, orientation, and extent to their optical nebulosities; IRAS 19255+2123 appears to be point-like. In the source IRAS 18135−1456 (case (2)), the continuum-emitting envelope is unresolved. Among the five sources with big, cold dust grains (case (3)), three are point-like sources and two (IRAS 19548+3035 and IRAS 23166+1655) are extended; in all five cases the continuum-emitting region has a smaller angular size (θ1/2) than the CO envelope. Finally, in IRAS 20000+3239, the 2.6 mm continuum emission, of unconfirmed nature, arises in a point-like central structure.
We thank the anonymous referees for their helpful comments and suggestions. This work has been partially performed at the Astrophysics Department of the Astrobiology Center (CAB, CSIC/INTA) and the California Institute of Technology and has been partially supported by the Spanish MICINN through grants AYA2009-07304 and CONSOLIDER INGENIO 2010 for the team "Molecular Astrophysics: The Herschel and Alma Era–ASTROMOL" (ref.: CSD2009-00038), and by the Spanish MEC under project PIE 200750I028. Ongoing development and operations for OVRO and CARMA are supported by the National Science Foundation under a cooperative agreement (grant AST 08-38260). R.S.'s contribution to the research described here was carried out at the Jet Propulsion Laboratory, California Institute of Technology, under a contact with NASA. R.S. thanks NASA for partially funding this work by NASA LTSA and ADP awards (nos. NMO710651/399-20-40-06 and 399-20-40-08); R.S. also received partial support for this work from HST/GO awards (nos. GO-09463.01, 09801.01, 10185.01, and 10851.01) from the Space Telescope Science Institute (operated by the Association of Universities for Research in Astronomy, under NASA contract NAS5-26555). This research has made use of the SIMBAD database, operated at CDS, Strasbourg, France, the NASA's Astrophysics Data System, and Aladin. This research has made use of observations with AKARI, a JAXA project with the participation of ESA.
Facilities: CMA - Caltech Millimeter Array, HST - Hubble Space Telescope satellite
Footnotes
- 4
- 5
- 6
- 7
Taken as part of our HST imaging survey program GO 9463.
- 8
- 9
This elongation is unlikely to be an artifact of the continuum subtraction (Section 2.2) since it is observed in the original line+continuum maps.
- 10
In one case, IRAS 18560+0638, we have used the 13CO (J = 1–0) profile, since the 12CO line is adversely affected by ISM absorption.
- 11
For a Gaussian profile
 , therefore, for spectra with S/N > 4 at the line peak; for a triangular profile FWZI = 2 × FWHM.
 - 12
After re-scaling to common values for d, X(CO), excitation temperature, etc., if needed.
