
Abstract
Dosimetry protocols for external beam radiotherapy currently in use, such as the IAEA TRS-398 and AAPM TG-51, were written for conventional linear accelerators. In these accelerators, a flattening filter is used to produce a beam which is uniform at water depths where the ionization chamber is used to measure the absorbed dose. Recently, clinical linacs have been implemented without the flattening filter, and published theoretical analysis suggested that with these beams a dosimetric error of order 0.6% could be expected for IAEA TRS-398, because the TPR20,10 beam quality index does not accurately predict the stopping power ratio (water to air) for the softer flattening-filter-free (FFF) beam spectra. We measured doses on eleven FFF linacs at 6 MV and 10 MV using both dosimetry protocols and found average differences of 0.2% or less. The expected shift due to stopping powers was not observed. We present Monte Carlo kQ calculations which show a much smaller difference between FFF and flattened beams than originally predicted. These results are explained by the inclusion of the added backscatter plates and build-up filters used in modern clinical FFF linacs, compared to a Monte Carlo model of an FFF linac in which the flattening filter is removed and no additional build-up or backscatter plate is added.
Export citation and abstract BibTeX RIS

Original content from this work may be used under the terms of the Creative Commons Attribution 3.0 licence. Any further distribution of this work must maintain attribution to the author(s) and the title of the work, journal citation and DOI.
1. Introduction
In recent years linear accelerators with flattening filter free capability have become common in radiotherapy clinics. The new FFF beams are sufficiently different from conventional flattened beams to raise questions about dosimetry. In particular the unflattened beams have a larger spectral spread with a greater low-energy component. They are also non-uniform over the length of a typical ionisation chamber used in reference dosimetry, and can be significantly higher in dose rate.
All of these effects raise the possibility that conventional dose measurements, based on dosimetry protocols developed for flattened beams, may be in error. Protocols include the IAEA's TRS-398 Code of Practice (Andreo et al 2000) and the AAPM's TG-51 (Almond et al 1999). Corrections for spatial non-uniformity and recombination are straightforward to measure and take into account. The effect of spectral differences, however, is harder to quantify. Xiong and Rogers (2008) used Monte Carlo models of accelerators without flattening filters to determine the spectrum-averaged (Spencer-Attix restricted) stopping power ratios as a function of TPR20,10 and %dd(10)x. They found that the stopping powers for FFF follow a different curve when plotted against TPR20,10 compared to conventional with flattening filter (WFF) beams. If %dd(10)x is used instead of TPR20,10 the curves for FFF and WFF are closer to each other. They conclude that %dd(10)x is a more appropriate beam quality index for FFF beams. The differences in the stopping powers they calculate between FFF and flattened spectra, for the same TPR20,10, are of the order of 0.5% for 6 MV and 0.7% for 10 MV beams, but only about 0.1–0.2% when %dd(10)x is the beam quality. Other work by Dalary et al (2014) saw a smaller difference in the stopping power ratios of FFF and flattened beams of 0.3% with similar TPR20,10.
Hence, users of TRS-398 might expect an error of up to 0.6% to arise from the use of TPR20,10 with FFF beams. Australian radiotherapy facilities follow TRS-398, and the question arises when commissioning new linacs without flattening filters whether to use TRS-398 or TG-51. In addition, the Australian Clinical Dosimetry Service (ACDS) (Williams et al 2012) performs reference level dosimetry audits on new linacs around the country. When auditing FFF linacs, they need to know the appropriate protocol to use, and the magnitude of the uncertainty arising from the chosen protocol. The key question addressed in this work is whether TRS-398 can be used in practice for reference dosimetry on FFF beams without significantly increasing the uncertainty.
TRS-398 and the original TG-51 are very similar. The correction factor kQ is calculated (equation (1)) in both protocols using the ratio of the Spencer-Attix stopping powers (averaged over the electron spectrum, and restricted with a cut-off of 10 keV) and they have the same chamber perturbation correction factors. They recommend the same reference conditions: 10 cm depth in water in a 10 cm × 10 cm field, and recombination and polarity are treated in the same way. They differ in the choice of beam quality index: TRS-398 uses TPR20,10 and TG-51 uses %dd(10)x. Each approach has its advantages (Johnsson et al 2000). Early comparisons of the protocols on conventional accelerators with beam flattening filters indicated only small differences in the absorbed dose (Huq et al 2001, Medina et al 2004)

In the 2014 addendum to TG-51 (McEwen et al 2014), the calculation in equation (1) was replaced with Monte Carlo simulations by Muir and Rogers (2010). This approach encompasses all the terms in equation (1) except Wair, through modelling the chamber and linac geometry and the transport of the radiation from the linac and 60Co source. An important consideration when comparing TRS-398 to TG-51(addendum) is to separate differences due to FFF beams, and differences due to Monte Carlo versus stopping power ratio calculation of kQ.
2. Methods
2.1. Measured audit result differences using TRS-398 or TG-51
The Australian Clinical Dosimetry Service (ACDS) (Williams et al 2012) performs reference level dosimetry audits on new linacs throughout Australia. Over the past two years increasing numbers of new linacs have included FFF beams. The ACDS has evaluated the FFF beam outputs using both TRS-398 and TG-51 protocols with the aim of establishing the magnitude of difference between the two protocols for FFF beams.
In comparing the ratio of results from the TRS-398 and TG-51 protocols, the ionization chamber readings cancel out because both protocols recommend the same reference conditions with measurements performed at 10 cm depth in a full scatter water phantom. Likewise recombination and polarity corrections are treated the same way in each protocol and cancel out. Instead, the comparison entails measuring the different beam quality indices, TPR20,10 and %dd(10)x, and comparing the kQ correction factors from each protocol for a given ionisation chamber type in the beam.
The 6 MV and 10 MV beams were measured on 11 linacs, for both flattened and unflattened beams. Seven Varian TrueBeam linacs (Varian Medical Systems, Palo Alto, CA, USA), two Elekta Versa HD linacs (Elekta AB, Stockholm, Sweden), one modified Varian Trilogy and one modified Varian 21iX were measured. In most cases the clinic provided the beam qualities to the ACDS. On one occasion detailed measurements were made to determine %dd(10)x directly.
The ACDS audit uses a single chamber type, the PTW 30013 chamber (Physikalisch Technische Werkstätten (PTW) Freiburg, Freiburg, Germany). However there are many chambers that can be used for reference dosimetry. To assess differences for all chamber types, the beam quality data from the audited FFF beams was used to derive the differences in kQ for all chambers common to both protocols.
2.2. Monte Carlo model of kQ
The response of an NE2561 secondary standard chamber (Nuclear Enterprises Ltd, United Kingdom) was modelled using the EGSnrc user code DOSRZnrc. The model was previously developed to study the difference in kQ from a BEAMnrc model matched to a Varian Trilogy linac and a model matched to an Elekta Synergy platform linac (Lye et al 2012). The kQ is determined by first scoring the dose deposited in the air cavity of the chamber using a phase space source from the BEAMnrc model of the linac. Next, all components of the NE2561 model are changed to water and the dose to water is scored in the same volume as the air cavity. The ratio of the dose to the air cavity and the dose to water gives the relative kQ. In this work the model was used to study the difference in kQ in the Varian and Elekta linacs when the flattening filter was removed, and also when the flattening filter was replaced by a thin 2–3 mm metal plate. Figure 1 shows a schematic of the NE2561 chamber. Further details of the model can be found in Lye et al (2012).
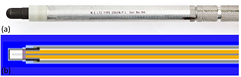
Figure 1. NE2561 ionisation chamber (a) photo and (b) schematic of the DOSRZnrc model.
Download figure:
Standard image High-resolution image3. Results and discussion
3.1. Beam quality determination
The ACDS uses beam quality data provided by the radiotherapy facility. The facility may have followed the TG-51 protocol for measuring %dd(10)x, including the addition of the Pb foil, or the facility may have used the approximation that %dd(10)x = PDD(10), the dose at 10 cm as a percentage of the dose at dmax.
Since %dd(10)x refers to the pure photon spectrum (i.e. it is equal to PDD(10) for the linac output spectrum with all the electrons removed), it is well approximated by PDD(10) below 10 MV. To quantify the effect this approximation has on the value of kQ measurements were made with and without the specified Pb foil following the TG-51 addendum on a Varian TrueBeam. A PTW 30013 Farmer-type chamber was used with a polarising voltage of 400 V.
Recombination and non-uniformity were measured to determine the size of the corrections under reference conditions at 10 cm depth. Recombination and non-uniformity corrections were also measured at the depths relevant for %dd(10)x beam quality measurement, and the effect of correcting the beam quality measurement for recombination and non-uniformity were assessed. The results are shown in table 1.
Table 1. Recombination, ks, and non-uniformity, kn, corrections for the PTW Type 30013 chamber at 400 V.
| Beam | ks at dmax | ks at 10 cm | Difference (%) | kn at dmax | kn at 10 cm | Difference (%) |
|---|---|---|---|---|---|---|
| 6 MV FFF | 1.0060 | 1.0036 | 0.24 | 1.0023 | 1.0025 | −0.02 |
| 10 MV FFF | 1.0103 | 1.0075 | 0.28 | 1.0054 | 1.0048 | 0.06 |
The maximum recombination correction was 1.0%, comfortably in the region where the two voltage method is suitable (Boutillon 1998). Note that this is only valid for the particular chamber type and voltage combination used. Measurements of other chamber types have been made by Lang et al (2012). The maximum difference in recombination between 10 cm and dmax was 0.28%, resulting in a change to kQ of only 0.04%.
The non-uniformity correction was calculated from beam profiles measured with an IBA PFD 3G photon diode. In all cases the dose changes by less than 2% over the long axis of the 23 mm long PTW 30013 chamber and by less than 0.2% over its width. The correction was approximated by summing the inline profile over the long axis:

where D0 is the central axis dose and Di is the value at each point i in the profile scan over the length of the chamber. The largest correction of 1.0054 occurs for the 10 FFF beam at dmax. The diode used to measure the profile has an active area 2 mm in diameter, sufficiently small that volume-averaging has negligible effect on the value of kn. The non-uniformity corrections (0.25%–0.48% at 10 cm depth) are large enough to warrant inclusion in the reference dosimetry, however the non-uniformity correction was insensitive to depth and has insignificant effect on the beam quality measurement.
Table 2 shows the effect of including the Pb foil in the beam quality measurement. The measured PDD(10) with no recombination and non-uniformity corrections was compared to the measurement of %dd(10)x with the lead foil including the recombination and non-uniformity corrections. The difference in the beam quality measurements was 1%, corresponding to a change in kQ for the PTW 30013 chamber of 0.1%. The change in kQ was sufficiently small to justify using the beam quality data provided by the radiotherapy facility.
Table 2. Effect of Pb foil on beam quality measurement.
| Beam | Measured PDD(10) | Measured %dd(10)x | Difference (%) | kQ PDD (10) | kQ %dd (10)x | Difference (%) |
|---|---|---|---|---|---|---|
| 6 MV FFF | 63.50 | 64.30 | 1.25 | 0.9954 | 0.9944 | 0.10 |
| 10 MV FFF | 70.70 | 71.43 | 1.02 | 0.9855 | 0.9843 | 0.12 |
In regards to beam quality data for TRS-398, the radiotherapy facility may either have directly measured TPR20,10, or they may have used PDD20,10 data and converted it using the relationship TPR20,10 = 1.2661 PDD20,10 −0.0595 (Andreo et al 2000). Measurements of TPR20,10 were made on a Varian TrueBeam and compared to TPR20,10 derived from the PDD data. The measurements are shown in table 3. The difference in the beam quality measurements was less than 0.2%, corresponding to a change in kQ for the PTW 30013 chamber of less than 0.05%. The change in kQ was sufficiently small to justify using the beam quality data provided by the radiotherapy facility. Measurements were also performed on a second Varian TrueBeam and again the difference in the beam quality measurements was less than 0.2%.
Table 3. Comparison of measured TPR20,10 to derived TPR20,10 from PDD data.
| Beam | Measured TPR20,10 | Derived TPR20,10 | Difference (%) | kQ measured | kQ derived | Difference (%) |
|---|---|---|---|---|---|---|
| 6 MV FFF | 0.6262 | 0.6255 | −0.11 | 0.9964 | 0.9965 | −0.01 |
| 10 MV FFF | 0.7012 | 0.7025 | 0.19 | 0.9878 | 0.9875 | 0.03 |
3.2. Audit results
The results from the comparisons between TRS-398 and the TG-51(addendum) from the ACDS audit measurements are shown in figure 2. The ACDS audit uses a Farmer type 30013 waterproof chamber that is not listed in the original TG-51 and thus kQ values from TG-51(addendum) were used. The results in figure 2 are in effect the difference between the kQ for 30013 derived from TRS-398 and from TG-51(addendum). The average difference and standard deviation for the 6 MV FFF beam is 0.03 ± 0.09% and 0.08 ± 0.12% for the 10 MV FFF beam. The average difference for both energies is less than 0.1%.
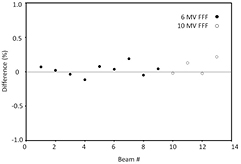
Figure 2. Difference in measured output of all 6FFF and 10FFF beams using TRS-398 compared to TG-51(addendum).
Download figure:
Standard image High-resolution image3.3. Differences for all chamber types
The results shown in figure 2 are for a single chamber type. Also of interest is the difference between the protocols for all chamber types. As both protocols measure under the same reference conditions, the ion chamber charge measurements cancel out in the ratio of dose output from the two protocols. The difference in protocol for each chamber type can be calculated from the beam quality data collected for each audited beam and simply becomes a ratio of the calculated kQ from each protocol.
Figure 3(a) shows the ratio of absorbed dose to water determined by TRS-398 compared to TG-51 for all chambers common to the two protocols for all 6 and 10 MV beams that were audited on the FFF linacs. The thick orange and blue lines show the average of chamber results for each beam for 6 and 10 MV beams respectively. The left most graph shows results for the FFF beams. The central graph shows the results for the conventional filtered beam (WFF) on the same linac. The graph on the right shows the difference between the FFF and WFF results for each chamber type. Figure 3(b) shows a similar three graphs of the difference between TRS-398 and TG-51(addendum).
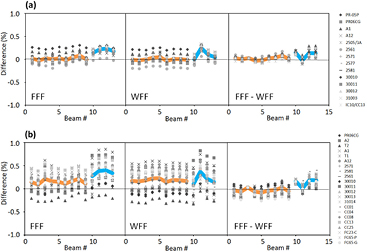
Figure 3. (a) Difference in the dose outputs from TRS-398 compared to TG-51 for all chambers common to the two protocols. Results are shown for FFF beams, WFF beams, and the difference between the FFF beam and its corresponding WFF beam on the same linac. (b) Difference in the dose outputs from TRS-398 compared to TG-51(addendum). The thick orange and blue lines show the average of chamber results for each beam for 6 and 10 MV beams, respectively. The 6 MV beams are Beam# 1–9 and the 10 MV Beams are Beam# 10–13.
Download figure:
Standard image High-resolution imageThe differences in figure 3(a) comparing TRS-398 to TG-51 are small. The average difference over all chamber types is 0.02% and 0.19% for 6 MV FFF and 10 MV FFF respectively and 0.00% and 0.10% for 6 MV WFF and 10 MV WFF respectively. The average difference over all chambers when subtracting the FFF difference from the WFF difference for a particular chamber type is 0.02% and 0.10% for 6 MV and 10 MV respectively. The maximum difference in each graph is 0.31% for the PR-05P chamber with the 6 MV FFF beam, 0.33% for the 2571 with the 10 MV WFF beam, and 0.29% for the A1 chamber with the 6 MV FFF- 6 MV WFF result.
The differences in figure 3(b) comparing TRS-398 to TG-51(addendum) are larger for the graphs of the FFF and WFF beams, however these differences reduce when subtracting the FFF and WFF results as shown in the right-hand graph. This suggests that the larger differences in the left-hand and central graphs are due to the difference in calculation method of kQ in TRS-398 and TG-51(Addendum) rather than due to differences between FFF beams and conventional flattened beams. The average difference over all chamber types is 0.15% and 0.35% for 6 MV FFF and 10 MV FFF respectively and 0.19% and 0.21% for 6 MV WFF and 10 MV WFF respectively. The average difference over all chambers when subtracting the FFF difference from the WFF difference for a particular chamber type is 0.03% and 0.14% for 6 MV and 10 MV respectively. The maximum difference in each graph is 0.85% for the A1 chamber with the 10 MV FFF beam, 0.83% for the A2 with the 10 MV WFF beam, and 0.40% for the CC01 chamber with the 10 MV FFF- 6 MV WFF result.
3.4. Monte Carlo model of flattening filter free kQ
The first investigation performed with the EGSnrc model of an NE2561 chamber was to compare the relative kQ from linacs with a flattening filter (WFF) and flattening filter free (FFF) linacs for 6 MV beams. The results for WFF linacs are simulated from BEAMnrc models matched to measured data from an Elekta Synergy platform linac and a Varian Trilogy linac. The simulations of the FFF linacs simply removed the flattening filter from the Elekta Synergy and Varian Trilogy models. The BEAMnrc models of the FFF linacs were not matched to measured data as detailed manufacturer specifications of Elekta Versa and Varian TrueBeam FFF linacs were not available to use in the MC model.
The results from the comparison between the WFF and FFF beams are shown in figure 4. The ARPANSA Elekta Synergy has two 6 MV beams, referred to as 6A and 6B. 6B is matched to a typical Elekta TPR20,10 and 6A is matched to a typical Varian TPR20,10 = 0.671. The relative kQ from the WFF Elekta Synergy model are calculated for 6A MV, 6B MV, 10MV and 18 MV. The relative kQ from the FFF Elekta and Varian models are only calculated for 6 MV. The response of NE2561 to 60Co was not modelled, so the relative kQ response curve was scaled with the measured kQ by the UK National Physics Laboratory (NPL) of two ARPANSA NE2561 chambers at the 6A beam energy (National Physics Laboratory 2010). To enable a useful comparison of the modelled kQ the incident electron energy in the FFF linacs were increased until the TPR20,10 matched the WFF 6A MV beam. Figure 4(a) plots the kQ as a function of TPR20,10, and (b) as a function of %dd(10)x. In figure 4(a) the FFF kQ is 0.6% and 0.8% lower than the WFF kQ for the Elekta and Varian beams respectively. This is consistent with the findings by Xiong and Rogers (2008) using a Monte Carlo investigation of stopping power ratios in linacs with and without flattening filters. In figure 4(b) the effect of removing the flattening filter on kQ is mitigated by using the beam quality specifier %dd(10)x. In this case the FFF kQ is 0.3% and 0.4% lower than the interpolated WFF kQ for the Elekta and Varian beams respectively.
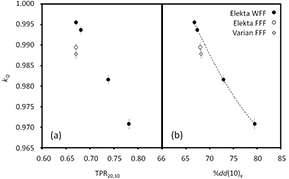
Figure 4. kQ of modelled NE2561 chamber with Elekta beams with the flattening filter (closed circles) and with the Elekta and Varian beams with the flattening filter removed (open symbols). The chamber response is shown as (a) a function of TPR20,10 and (b) a function of %dd(10)x.
Download figure:
Standard image High-resolution imageWhen comparing the ratio of measured results from the TRS-398 and TG-51 protocols, it is the difference between the magnitude of the WFF and FFF discrepancy when using TPR20,10 and when using %dd(10)x that we would expect to see, i.e. 0.6%–0.8% minus the 0.3%–0.4%. Thus the expected difference in the TRS-398 and TG-51 protocols shown in figure 2 should be 0.3–0.4% according to the modelled results in figure 4. This is not the case. The measured difference is less than 0.1%.
The commercial realisation of FFF beams includes a thin metal filter in the place of the flattening filter. The thin filter has the dual advantage of removing electron contamination due to remnant electron transmission through the target, and also of providing build up for the monitor chamber. This filter will change the spectrum and will reduce the low energy component. To investigate how the thin filter affects kQ a thin filter was added to each FFF model. The Elekta Versa has a 2 mm stainless steel thin filter. The thickness and material of the thin filter in the Varian TrueBeam is not known, but prototype Varian FFF linacs used 2 mm copper (Georg et al 2011). The Varian TrueBeam also has an additional backscatter plate placed downstream of the monitor chamber. The 2 mm Cu was used in the Varian thin filter model and the modelled behaviour of kQ is expected to be indicative of the Varian TrueBeam. Figure 5 shows the modelled behaviour of kQ in the three cases of FFF, WFF, and with a thin filter. The results for the Elekta linac are shown on the left and the results for the Varian on the right. In the Elekta case the introduction of the thin filter shifts the kQ into 0.15% agreement with the WFF beams and in the Varian case into 0.03% agreement. In the work by Dalary et al (2014) they include a 2 mm stainless steel plate in their model of a FFF Elekta Synergy linac. Their modelled difference between the FFF and WFF stopping power ratios is 0.2% for 6 MV beams, increasing slightly to 0.3% for the 10 MV beams. This is similar to the difference seen in the modelled relative kQ between the thin filter and WFF Elekta in this work.

Figure 5. kQ of modelled NE2561 chamber with beams with the flattening filter (closed shapes), beams with the flattening filter removed (open shapes) and beams with thin replacement filter (red shapes). (a) Shows the results for Elekta beams and (b) shows the results for Varian beams. The dashed grey line shows the average of kQ from TRS-398 and Muir and Rogers (2010).
Download figure:
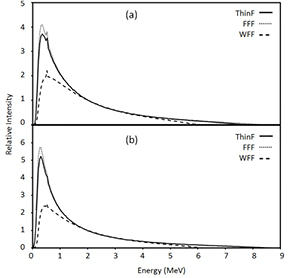
Standard image High-resolution imageFigure 6 shows the spectra for the three cases. Interestingly, the thin filter and FFF spectra look quite similar despite the effect on the modelled kQ. The stopping power ratios for each of the spectra were modelled using SPRRZnrc. A homogeneous water phantom with an incident photon beam of radius 5 cm was used, and the stopping power ratio of water to air was calculated at a depth of 10 cm within a 6 mm thick 6 mm diameter voxel. The stopping power ratios for the Varian were 1.120, 1.117 and 1.115 for the WFF beam, ThinF, and FFF respectively. The stopping power ratios for the Elekta were similar; 1.120, 1,117 and 1.114 for the WFF beam, ThinF, and FFF respectively. The thin filter stopping power results fall approximately halfway between the WFF and the completely FFF, suggesting that the difference in kQ shown in figure 5 is due both to stopping power ratio difference and also a change in one or more of the chamber correction factors (pcav, pwall, pcel). In the work by Muir and Rogers (2011) the central electrode correction factor, pcel, changed by 0.1–0.2% for various chambers when the flattening filter was removed. For a NE2561 chamber at 67%dd(10)x the difference was 0.2%. Although the change in pcel is not shown as a function TPR20,10 it is likely that the central electrode correction contributes to the larger difference between the WFF beam and with the flattening filter completely removed.
Figure 6. In-air 6 MV spectra from modelled Elekta and Varian linacs from beams with the flattening filter (WFF, dashed lines), beams with the flattening filter removed (FFF, dotted lines) and beams with thin replacement filter (ThinF, solid lines). All spectra intensities have been normalised to 2 MeV, the approximate average energy. (a) Elekta. (b) Varian.
Download figure:
Standard image High-resolution image
The modelling suggests the lack of difference between TG-51 with TRS-398 is due to the thin metal plates providing sufficient filtration for the commercial FFF beams to be considered 'clinic-like'. Kalach and Rogers (2003) provide a relationship between TPR20,10 and %dd(10)x (equation (3) in Kalach and Rogers (2003)) for 'clinc-like' beams. We applied this equation to the 13 clinical beams investigated in this study. There was one beam which had a deviation of 1.4% between the measured and calculated TPR20,10. Excluding this outlier, the measured TPR20,10 agreed with the calculated TPR20,10 with a RMSD of 0.43% and a maximum deviation of 0.75%, consistent with what Kalach and Rogers called 'clinic-like' beams.
4. Conclusions
In this work we investigated the differences between dosimetry for FFF and WFF beams by comparing TG-51 with TRS-398 for a series of clinical beams. The different beam quality indices used by these protocol was possibly expected to result in a 0.6% difference in the absorbed dose. However, we found differences of 0.2% or less for 6 and 10 MV FFF beams. The result is modelled using a Monte Carlo model that includes an additional thin filter in the Elekta and Varian 6MV FFF beams. We show that the addition of the thin filter hardens the spectrum sufficiently, even in the absence of the flattening filter, to produce a beam that is similar enough to conventional WFF spectra that the use of TPR20,10 does not introduce significant errors, for 6 MV unflattened beams.
TRS-398 is a suitable protocol for dosimetry with current clinical FFF beams up to 10 MV in Elekta and Varian linacs. The recombination was not excessive for a Farmer-type chamber operating at 400 V and corrections do not need to be included in beam quality measurements. A beam non-uniformity correction is also not necessary in beam quality measurements but should be included in the calculation of dose. Not included in this study are specialised linac designs that are also flattening filter free such as the TomoTherapy and CyberKnife machines.
In this paper we consider only chambers calibrated in 60Co. However, TRS-398 recommends the use of an ionisation chamber calibrated directly in megavoltage beams, where this service is available. The conclusions reached in our paper apply in the case of linac-calibrated chambers as well, if the linac used for the calibration was conventional. In this case, the interpolation with beam quality index will result in a similar error to the 60Co case, because the stopping power ratios are not the same for FFF beams. However if the linac used for calibration is also FFF, then no error from the use of TPR20,10 is expected.
Acknowledgments
We wish to thank John Kenny and Leon Dunn for valuable discussions and professional perspectives. Monte Carlo calculations were undertaken using supercomputer facilities of the Victorian Partnership for Advanced Computing (VPAC).