


Abstract
Progress in basic understanding of turbulence and its influence on the transport both of the plasma bulk and of suprathermal components is achieved in the TORPEX simple magnetized torus. This configuration combines a microwave plasma production scheme with a quasi-equilibrium generated by a toroidal magnetic field, onto which a small vertical component is superimposed, simulating a simplified form of tokamak scrape-off layers. After having clarified the formation of blobs in ideal interchange turbulence, TORPEX experiments elucidated the mechanisms behind the blob motion, with a general scaling law relating their size and speed. The parallel currents associated with the blobs, responsible for the damping of the charge separation that develops inside them, hence determining their cross-field velocity, have been measured. The blob dynamics is influenced by creating convective cells with biased electrodes, arranged in an array on a metal limiter. Depending on the biasing scheme, radial and vertical blob velocities can be varied. Suprathermal ion transport in small-scale turbulence is also investigated on TORPEX. Suprathermal ions are generated by a miniaturized lithium source, and are detected using a movable double-gridded energy analyser. We characterize vertical and radial spreading of the ion beam, associated with the ideal interchange-dominated plasma turbulence, as a function of the suprathermal ion energy and the plasma temperature. Experimental results are in good agreement with global fluid simulations, including in cases of non-diffusive behaviour. To investigate the interaction of plasma and suprathermal particles with instabilities and turbulence in magnetic configurations of increasing complexity, a closed field line configuration has recently been implemented on TORPEX, based on a current-carrying wire suspended in the vacuum chamber. First measurements indicate the creation of circular symmetric profiles centred on the magnetic axis, and instabilities driven in the region of strong gradients, with a strong ballooning character.
Export citation and abstract BibTeX RIS
1. Introduction
Progress in understanding basic aspects of turbulence, including its development from linearly unstable electrostatic modes, the formation of filamentary structures, or blobs, and its influence on the transport of energy and particles, both of the plasma bulk and of suprathermal components, can be achieved in basic, low temperature plasma devices, from linear to toroidal. A particularly interesting configuration for these studies is that of a simple magnetized torus (SMT) device. This is established in the TORPEX device [1] by combining a microwave plasma production system, which creates weakly collisional plasmas of various gases characterized by pressure gradients, with a quasi-equilibrium generated by a toroidal magnetic field onto which a small vertical component is superimposed. The helical geometry of the open field lines, with magnetic field gradient and curvature, and electron temperatures in the eV range, makes these plasmas simplified paradigms of tokamak scrape-off layers (SOLs). Control parameters such as the background pressure, the power of the microwave source at 2.45 GHz for plasma production, and the intensity of the vertical magnetic field can easily be varied to modify the plasma and turbulence characteristics [1].
In recent years, progress in plasma blob physics has been very significant, in different plasma configurations [2–5]. The investigations of TORPEX have followed a logical progression, from the characterization of the basic plasma properties, including the dependence of confinement upon vertical magnetic field intensity [6], source and plasma profiles [7], to the identification of the waves and instabilities underlying the turbulence [8–9], and the mechanisms for the generation of turbulence from unstable modes due to wave–wave coupling [10]. After having clarified the formation of blobs in ideal interchange turbulence [11–13], different from the drift-wave origin observed in previous tokamak experiments [14–15], and in more recent linear experiments [16], TORPEX experiments elucidated the mechanisms behind blob propagation, with a general scaling law relating their size and speed [17]. Such analytical scaling was verified over a wide range of the key dimensionless parameters in TORPEX data, vastly exceeding tokamak SOL databases, as well as in the results of 2D fluid numerical simulations [18–19]. This is an example of a wider code validation project conducted on TORPEX with a particular attention to the definition of the validation methodology [20]. Over the last few years, we have further consolidated the previous interpretation of blob motion using magnetic probe measurements of blob currents [21], and explored the insights gained from our previous studies to actively influence blob propagation in TORPEX [22]. In this paper, we summarize these two studies and discuss further achievements along the same lines (sections 2 and 3), after which we illustrate recent progress in the understanding of the interaction between suprathermal ions and turbulence (section 4). We conclude in section 5 with an outlook on future experiments, including some preliminary results on the creation of a new configuration in TORPEX, in which magnetic surfaces are closed by a toroidal current driven in an in-vessel wire. This will allow basic investigations of turbulence and of the associated plasma thermal and non-thermal response in magnetic configurations of increasing complexity and fusion relevance.
2. Blob currents
The parallel current density associated with blobs is a crucial quantity determining the blob dynamics, and a key to understanding the physical mechanisms behind it. Obtaining direct local measurements of this current density represents a major challenge in thermonuclear plasmas. Various attempts are now in progress in TORPEX using a variety of methods. A specially designed current probe, consisting of an L-shaped array of three miniaturized three-axial pick up coils (3.5 cm spaced, effective area of 2.3 × 10⁻³ m2), was developed in collaboration with Consorzio RFX in Padova, Italy. Using this probe and conditional sampling techniques [23], 2D measurements of the parallel current density associated with radially propagating blobs were obtained in front of a poloidal limiter [21]. Conditional sampling here is based on using reference signals from probes located radially outside the plasma source region. The trigger level is arranged so that signature events for blobs are defined when the signal exceeds 2.5 times the standard deviation of the probe's entire time sequence for a given plasma discharge. Excellent plasma reproducibility allows us to combine conditional samples from series of virtually identical discharges and construct large statistics. Figure 1 shows 2D profiles of the parallel current at three times during the blob propagation obtained using this method. An asymmetric dipolar structure of the current density is revealed, which originates from ∇B and curvature-induced polarization of the blob and is consistent with sheath boundary conditions. The dipole is strongly asymmetric due to the non-linear dependence of the current density at the sheath edge upon the floating potential. Furthermore, by performing these measurements in hydrogen and helium plasmas, we have provided direct evidence for the existence of two separate regimes, in which currents damping blob motion are due to parallel conductivity and ion polarization, respectively, compatible with the previously discovered scaling [17].
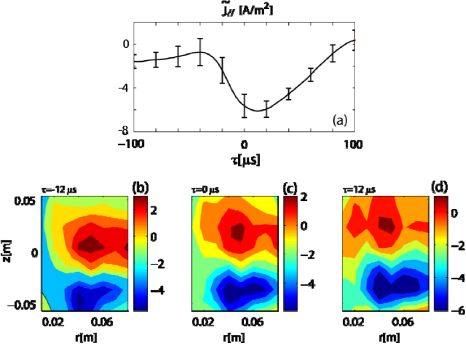
Figure 1. Conditionally sampled data from the current probe measured ∼3 cm in front of the limiter. (a) shows an example of the time evolution of the parallel current density at r = 6 cm and z = −4 cm. Two-dimensional profiles of the parallel current density are shown at three different times during the blob radial propagation in (b)–(d) [21]. The 2D poloidal scan comprises 120 measurement points.
Download figure:
Standard image High-resolution imageTo investigate the effect of the observed asymmetry of the parallel current on the blob motion, we carried out numerical simulations of seeded blobs, using a two-field fluid model, which evolves electron density and vorticity [19]. The simulations span a wide range of blob sizes covering the two regimes described above. We used either the complete or a linearized form for the sheath dissipation term in the vorticity equation. The structure of the parallel current density and plasma potential is found to be different in the two cases. Asymmetric profiles are observed in simulations with the complete form, while symmetric profiles are obtained when a linearized form is used.
The last experimental frontier to further advance our understanding of the blob dynamics is represented by internal measurements of the parallel current associated with blobs at different locations along the elongated blob structure, i.e. along the magnetic field lines. Measurements of this kind were first obtained using an array of single-sided Langmuir probes, but this method has been proven to work only in front of a conducting limiter. To overcome the limitation of the electrostatic probes, and perform measurements at different toroidal locations, we have developed a dedicated miniaturized current probe diagnostic, shown in figure 2. The probe consists of a Rogowski coil manually wound around a ferrite core to increase the magnetic flux associated with the blob current. For the ferromagnetic core of the current probe, we used the 3E25 ferrite produced by the FERROXCUBE Company [24]. For typical toroidal magnetic field (the dominant magnetic field) in TORPEX in the range B = 0.06–0.08 T, the behaviour of the magnetic core is linear since the ferrite is far from the saturation regime. In addition, changes in the temperature of the core, which could cause a change in the ferrite magnetic permeability are negligible, due to the low energy fluxes associated with TORPEX plasmas. Electrical and thermal insulation from the plasma are obtained by placing the detecting coil inside a Peek cylindrical housing, machined as two halves of a container. The ratio of detection area (∼1 cm2) to the area of obstruction of the probe is limited by the technical difficulty in machining thinner walls. The toroidal detecting coil consists of a single layer helical winding with an inside return loop to cancel the net single turn formed by the solenoid windings. Thus the output signal is generated only by the turns circling the toroidal magnetic flux created by parallel currents associated with blobs. The probe is operated in current mode, providing a direct measurement of the total current flowing inside the detection area. Measurements are taken at different toroidal locations by moving the entire probe structure during short machine openings. Preliminary results obtained with this probe confirm the picture of a current filament associated with a single blob, which reverses direction approximately half way along the parallel length of the blob.
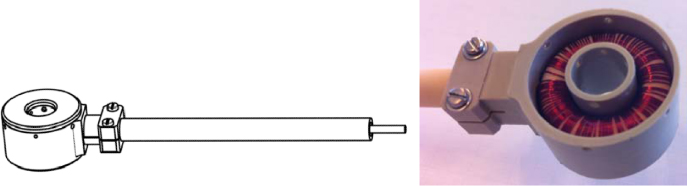
Figure 2. CAD drawing and picture of the miniaturized current probe, dedicated to the measurement of the blob micro-currents. The current probe housing has an inner and outer diameter of 12 mm and 28 mm, respectively.
Download figure:
Standard image High-resolution image3. Blob control and convective cells
Based on our understanding of the physics governing blob motion, we have started to develop blob control methods. One of these methods, aimed at inducing radial flows and convective cells that could potentially provide a tool to alleviate the divertor heat flux issue in tokamaks [25–26], is based on the use of biased plates [27]. Basic principles of this idea have been tested in TORPEX [22]. A set of 24 electrodes has been installed on a metal limiter to modify the plasma potential and thus the cross-field flows in a controlled way. A sketch of this limiter is shown in figure 3 (top). The set of electrodes provides good flexibility, inducing different flow patterns, such as convective cells, radially elongated flows, or vertical flows, as illustrated in the figure.
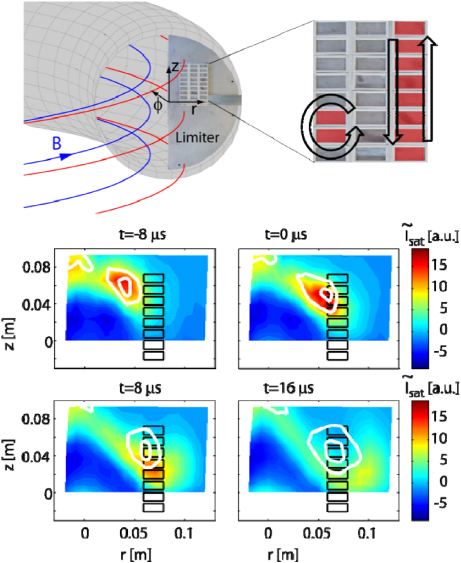
Figure 3. Top: sketch of the TORPEX vacuum vessel and the electrodes installed on a conducting limiter. Examples of magnetic field lines are also shown. A zoomed-in view of the electrodes is shown at the right. Each electrode has a rectangular surface of 2 cm × 0.9 cm. The shaded areas indicate examples of positively biased electrodes and the arrows the expected flow pattern. Bottom: conditionally averaged blob propagation (fluctuations in ion saturation current) for the case where a vertical stripe of electrodes is biased to +40 V (colour plots). For comparison, the white contours indicate the results of the same analysis when all electrodes are grounded [22].
Download figure:
Standard image High-resolution imageFigure 3 (bottom) presents the effect on blobs, when a bias of +40 V is applied to the set of electrodes indicated by black rectangles. Conditional average sampling is applied to obtain the ensemble average blob propagation over the 2D poloidal plane. For this successive time frames of blob propagation are obtained this way. In the same figure, the white contours depict the conditional sampled blob in the case without biasing. While early in time the average blob evolution is very similar, later on, as anticipated, the blob is swept strongly downwards due to the applied bias. The blob vertical velocity in the time window [−8 µs, 8 µs] is modified from ∼700 to ∼2100 m s−1 due to the biasing. Depending on the biasing scheme, radial blob velocities can also be varied significantly.
Biasing also results in significant modifications of the time-averaged profiles. Measurements along and across the magnetic field show a fairly good toroidal symmetry of the changes induced by the biasing. The magnitude of the achievable potential variations is well below the potential applied to the electrodes. In addition, the strongest potential variations are not induced along the biased flux tube, but at a position shifted in the direction of the plasma flow [28]. We note that, in contrast to the pioneering biasing experiments of Taylor et al [31], we apply a potential from an external supply in an open field line configuration, in which cross-field currents limit the achievable voltage. Analytical estimates, based on the drift-reduced Braginskii ordering valid in TORPEX, have been performed to evaluate the magnitude of the cross-field currents that presumably underlie the reduction of the potential variations with respect to the applied bias. These estimates show that the high level of cross-field currents necessary to explain the experimental observations cannot be accounted for by ion polarization currents, diamagnetic currents, or currents due to ion/electron–neutral collisions and gyro-viscous effects [28].
The analytical estimates have been confirmed by non-linear simulations of plasma turbulence based on the 2D drift-reduced Braginskii model [29–30], which has been modified to take into account the presence of a limiter, of a set of biased plates, and of ion–neutral collisions. The first effect is included by considering a connection length that varies radially, mimicking the experimental setup, while the presence of the bias is introduced by imposing a parallel electron velocity at the sheath entrance given by v∥e = cS exp[Λ − e(φ − φw)/Te], φw being the wall potential, cS = (Te/mi)1/2 and Λ = 1/2log(mi/2π me). Ion–neutral collisions have been implemented with as a damping term in the vorticity equation, as in [28].
For our experiment–simulation comparison, we consider a half circular limiter as in figure 3, and a bias applied to a vertical stripe located at r = 0, which covers continuously the TORPEX full vertical extension and has a radial width of 2 cm. The simulation results are presented in figure 4. It is clear that for all values of the bias voltage considered in this study, the perturbation to the plasma potential is smaller in the experiments than in the simulations. This confirms that cross-field currents are underestimated by a 2D Braginskii model and a more comprehensive model, which would include 3D effects, sheath dynamics and kinetic effects would be needed to explain the experimental findings and give an idea of the limitations and applicability of the proposed method to other devices.

Figure 4. Comparison between the measured and simulated perturbation of the plasma potential, as a function of the bias voltage applied on a vertical stripe located at r = 0, covering continuously the TORPEX full vertical extension and having a radial width of 2 cm. The variation of the plasma potential is estimated from the variation of floating potential obtained from Langmuir probes. This approximation is justified by the observation that biasing in our experiments has a much larger effect on the floating potential than on electron temperature, such that δVpl = δVfl + μδTe ∼ δVfl.
Download figure:
Standard image High-resolution image4. Fast ion interactions with turbulence
The transport of suprathermal, or fast ions in plasma turbulence is another area in which experimental and theoretical studies based on basic plasma devices can contribute to understanding basic concepts relevant to burning plasma physics [32–34]. At a macroscopic level, the transport of fast ions in plasma is in general described by a diffusion equation. However, in the presence of high-order terms associated with micro-scale processes, the transport is not necessarily diffusive. A useful micro-scale approach to describe the spreading of a population of an ensemble of fast ions in general is the continuous time random walk [35–36]. This approach consists of following trajectories of random walkers through a sequence of steps, each with a finite length (step size) and duration (waiting time). To quantify the fast ion dispersion one can define the variance of their radial displacement as σ2 = 〈δr2〉, and assume that its time evolution can be described by a power law σ2(t) ∼ tγ. Here, the step size is δr = [r(t) − r(0)], and 〈〉 denotes an ensemble average over many particle trajectories. By numerically integrating the ion trajectories in the SMT turbulent fields simulated using a 2D model based on the drift-reduced Braginskii fluid equations [30], and by exploring wide ranges of particle energy and turbulence amplitude, we have shown that the ions have a complex motion, which in general cannot be considered diffusive [36]. After a brief ballistic phase, in which the fast ions do not interact significantly with the turbulence, a turbulence interaction phase follows, which shows the entire spectrum of fast ion spreading: super-diffusive (γ > 1), diffusive (γ = 1) or sub-diffusive (γ < 1), depending on particle energy and turbulence amplitude [37].
Figure 5 illustrates three representative examples showing these three types of turbulent dispersion in the SMT: sub-diffusion at E = 250, diffusion at E = 25 and super-diffusion at E = 5, where
 is the initial ion energy normalized to the plasma electron temperature. For these cases, the turbulence amplitude is such that eδφ/Te ∼ 0.8, where δφ is the root mean square fluctuation amplitude of the electrostatic potential. The value of the exponent γ is determined by fitting the growth of
 during the interaction regime with a power law. We follow 104 ion trajectories to satisfy statistical convergence with respect to the number of ions. We note that periodic oscillations in
are caused by the ion Larmor motion.
during the interaction regime with a power law. We follow 104 ion trajectories to satisfy statistical convergence with respect to the number of ions. We note that periodic oscillations in
are caused by the ion Larmor motion.
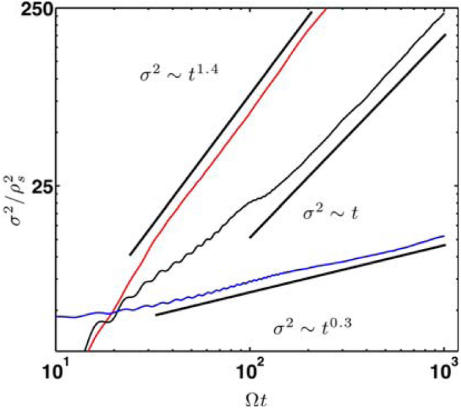
Figure 5. Three representative examples of dispersion of a fast ion beam in TORPEX, expressed as the variance of the radial displacement as a function of time, in the presence of electrostatic interchange turbulence, showing sub-diffusion, diffusion and super-diffusion.
Download figure:
Standard image High-resolution imageThis quasi steady-state interaction phase, in which the beam dispersion is characterized by a nearly constant γ, ends when a significant fraction of the ions have spread far enough radially to sample regions where the local turbulent properties have changed significantly with respect to the injection position. Thus, the duration of the interaction phase is determined by the radial scale length of the radial E × B velocity fluctuations.
Our simulations show that the diffusion approximation is valid only locally in time and space, since γ can be drastically different than unity, and time dependent. Therefore, the effective local fast ion diffusivity can strongly depend on time, and can be two orders of magnitude away from the thermal particle diffusivity estimated for the ideal interchange mode [38].
Having introduced the theory of fast ion transport in turbulent plasmas for the SMT configuration, we discuss here how it can be applied to the interpretation of TORPEX experimental data and show an exploratory comparison between experiments and simulations [39]. Li6+ ions are injected using a miniaturized ion source, developed in collaboration with the University of California at Irvine [40], which consists of a thermionic emitter with a two-grid accelerating system in a boron-nitride casing (outer diameter 8 mm). Li6+ ion currents up to 10 µA are obtained. The source is mounted on a motorized rail system and can be continuously moved over a toroidal distance of about 50 cm (figure 6) [39].

Figure 6. Layout and picture of the system allowing the fast ion source to be moved toroidally.
Download figure:
Standard image High-resolution imageIon energy and current density profiles are measured using two identical gridded energy analysers (GEAs), which face opposite directions for background noise subtraction. Each detector has small dimensions relative to the plasma size (15 mm in diameter, 70 mm in length and in inlet diameter of 8 mm), and is able to measure fast ion currents as small as 0.1 µA. Synchronous detection is used to increase the signal-to-noise ratio by modulating the emitter bias voltage at a given frequency (∼1 kHz). The GEA detector is installed on a two-dimensional moving system, which allows reconstruction of the ion current density profile with a spatial precision of 5 mm over almost the entire poloidal cross-section.
In the series of experiments described here, Li6+ ions with energy of ∼70 eV are injected along the magnetic field lines in the blob region. The time-averaged electron density at the injection location is ∼5 × 10¹⁵ m−3, and the standard deviation of the floating potential time series, indicating the level of fluctuations, is ∼1 V. The ion source is moved toroidally between each discharge over a total distance of 50 cm and poloidal profiles of the fast ion current are reconstructed at each toroidal position. Figure 7 shows an example of a fast ion current density profile at a toroidal distance of ∼50 cm (corresponding to about 0.5 rad) from the source. The red cross indicates the position of the injection, showing the displacement of the beam spot due, in roughly equal measure, to the vertical displacement of the field line and the vertical orbit drift. Measurements are made with and without plasma, in the presence of magnetic fields and neutral filling gas.
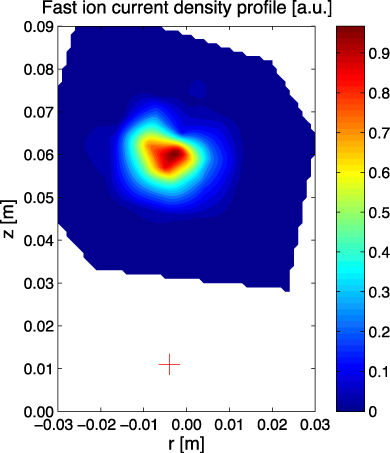
Figure 7. Fast ion current density profile at a toroidal distance of 50 cm from the source.
Download figure:
Standard image High-resolution imageTo interpret the experimental data, trajectories of tracer Li6+ ions are integrated in a turbulent electrostatic field as described above, in which different values of the particle and heat sources are used in order to match experimental profiles. At the injection point, the fluctuation level of the floating potential is higher in the simulation than in the experiment. In order to match the potential fluctuations, the simulated plasma potential fluctuations are rescaled. Using the simulated turbulent electric field, tracer Li6+ ion trajectories are computed. Source parameters are based on measurements carried out without magnetic fields and 10 000 particles are launched with initial parameters modelled with Gaussian distributions, with a mean energy of 70 eV and a standard deviation of 10%. A synthetic diagnostic, representing the phase space acceptance of the detector, computes 3 D profiles of the fast ion current density for comparison with the experimental data [36, 38]. Sequences of measurements obtained at four toroidal source positions are compared with the corresponding numerical data from synthetic diagnostic in figure 8.
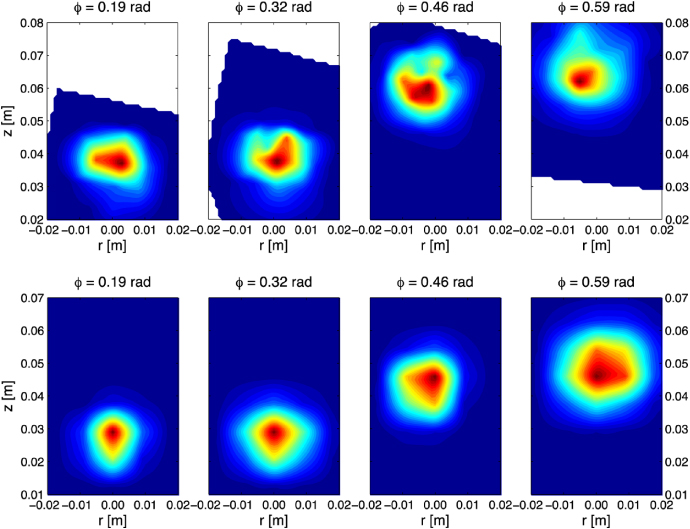
Figure 8. Top: measured fast ion current profiles at different distances from source to detector in the toroidal direction. Bottom: corresponding numerically reconstructed profiles. In both cases the fast ion energy is of 70 eV, with Gaussian distribution, and with a standard deviation of 10% in the energy.
Download figure:
Standard image High-resolution imageAlthough this representation allows one to observe a qualitative agreement between data and simulation, a more quantitative and stringent comparison can be performed by considering the radial spatial variance of the fast ion current profiles, as a function of the toroidal angle.
This representation of the data is used in figure 9, which displays, as a function of the toroidal direction, the variance of the beam profiles obtained with the synthetic diagnostic from the simulations, on top of the experimental measurements. The agreement is quite remarkable. The oscillations of the variance of the beam due to the Larmor motion of the particles are clearly evident. The broadening of the beam due to turbulence is revealed by its radial variance, which increases as a function of the distance from the source. Numerical simulations at later times indicate that, under these conditions, fast ions undergo a sub-diffusive transport with γ ∼ 0.78. In the same figure, the variance of the beam profiles of simulated data for Li6+ ions win an energy of 50 eV is also shown. They reveal a transition to a super-diffusive regime with γ ∼ 1.2. Experimental measurements are ongoing to investigate this new regime.
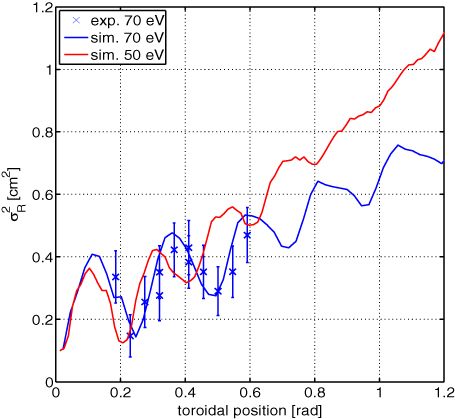
Figure 9. Radial and vertical spatial variances of the fast ion current profiles as a function of the toroidal angle. Simulation data are plotted for ion energies of 50 eV and 70 eV, while experimental data corresponds to the profile shown in figure 7, i.e. a fast ion energy of 70 eV.
Download figure:
Standard image High-resolution imageIn summary, we have developed a miniaturized fast ion source and detector system that allows a 3D plasma coverage. Well-defined effects of interchange modes and turbulence on fast ion profiles are observed. Depending on fast ion energies and turbulence fluctuation levels, the transport is predicted by fluid simulations to exhibit sub- to super- diffusive nature. This non-diffusive transport is confirmed experimentally. The simulations explain the shape of the experimental profiles, and demonstrate the interplay of turbulence broadening and the complex 3D nature of fast ion orbits. Such orbit effects are of primary importance in fusion devices, where they reduce the effect of turbulence on fast ion distributions (namely for fusion generated alpha particles) to levels that should have practically no influence on the behaviour of burning plasmas in devices such as ITER [41].
To complete this investigation, systematic measurements will be performed in the near future for wide ranges of the ratio the fast ion energy compared with the background plasma temperature, Efast/Te, for different turbulent regimes, and by varying the source location with respect to the plasma profile, i.e. in the wave- or blob-dominated regions. In addition, the studies of the dynamics of fast ions transport will benefit from variations in the magnetic field topology, from open to closed field lines, as described here below.
5. Outlook: closing the flux surfaces with a current-carrying internal wire
Several results have been obtained on TORPEX in the SMT configuration. To better mimic the scrape-off layer and edge magnetic geometry of tokamaks, twisted field line configurations need to be created. To this aim, a copper wire running along the toroidal direction has been installed, in which a toroidal current can flow and generate a poloidal field. The twist of the magnetic field line is controlled by the amount of current driven in the wire. As shown in figure 10, the wire is suspended inside the vacuum chamber by three insulated 1 mm diameter stainless steel wires, and by a vertical coaxial copper feed-through, which is also used to connect the wire to an external power supply. As a result, the wire can be moved vertically to achieve different magnetic configurations, or be removed from the plasma region to re-establish SMT operation.

Figure 10. Left: conceptual design of the wire movable supports and mounting ports. Right: picture of the copper wire suspended inside TORPEX vacuum vessel.
Download figure:
Standard image High-resolution imageA 1 kA–10 V power supply, whose output dynamics is limited to a maximum slew rate of ∼1400 A s−1, allows reaching a maximum flat-top current in approximately 300 ms. For simplicity, water-cooling is used only for the portions of the conductors embedded in the coaxial feed-through. Therefore, the flat-top current duration is limited by the ohmic heating of the wire with almost pure radiative cooling in vacuum. Setting the maximum wire current at ∼1000 A allows us to make ∼100 discharges per day, with a flat top of approximately 400 ms, without overheating the wire. The flat-top duration ensures data statistics similar to that of present SMT configurations.
The waveform of the wire current in a typical discharge is represented in figure 11, together with the ion saturation signal from a Langmuir probe tip located at mid-radius on the low-field side, in the mid-plane. The vertical magnetic field is set at a value of about 2 G, such that the field lines are concentric and centred around the machine cross-section geometrical centre (see figure 12). Ionization is obtained, as in the SMT configuration, with microwaves injected from the low-field side at a frequency of 2.45 GHz, corresponding to the electron cyclotron (EC) and upper hybrid frequencies. The toroidal field is adjusted such that the EC resonance is well inside the vacuum vessel (in this case it is at r = −0.085 m). The resulting profile of the safety factor, q, ranges between 1 and 20. At the location of the probe whose signal is displayed, q ∼ 6. The microwave power is kept at a minimal level, about 100 W, except in the short phase between 900 ms and 1000 ms.
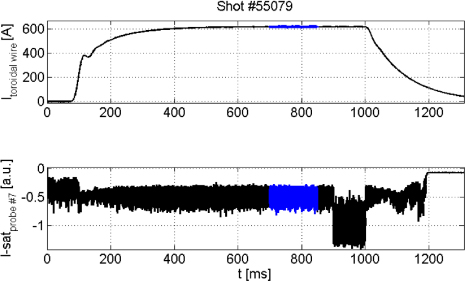
Figure 11. Waveform of the wire current signal (top) and of the ion saturation current signal of a Langmuir probe located on the mid-plane, half way between the centre and the edge on the low-field side, at r = 10.5 cm, z = 0 cm (bottom). The blue region indicates the time interval of the measurements shown in figure 12. The increase in the signal between 900 and 1000 ms is due to an increase in the microwave power.
Download figure:
Standard image High-resolution image
Figure 12. Probe-measured 2D profiles of time-averaged density, when a stationary current of about 620 A is driven in the wire (same discharge as in figure 11). Cuts at z = 0 cm and r = 0 cm are also included. The black stripes in the 1D profiles and the dot in the 2D plot indicate the position of the current-carrying copper wire. Here and in figure 13, in the calculation of the density from the ion saturation current, the electron temperature is assumed to be 5 eV, constant and uniform.
Download figure:
Standard image High-resolution image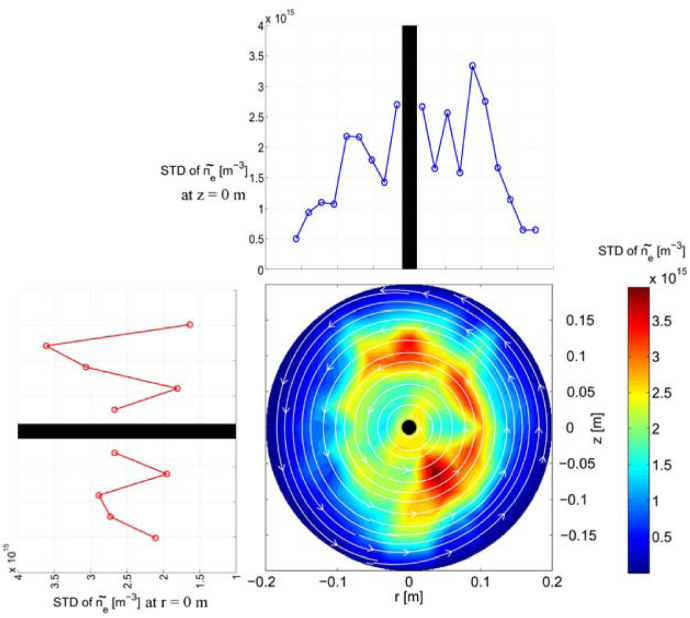
Figure 13. Probe-measured 2D profiles of the standard deviation of density fluctuations, under the same conditions as the data shown in figure 12.
Download figure:
Standard image High-resolution imagePreliminary measurements of the plasma properties in the presence of a toroidal current of the order of 600 A are shown in figures 12 and 13, which display the profiles across the plasma cross-section of the time-averaged density and its fluctuations (standard deviation of the signal up to the system Nyquist frequency, i.e. in the range 0–125 kHz) during the flat top of the wire current. The measurements clearly indicate the creation of circular symmetric profiles centred on the magnetic axis. The fluctuation amplitude profile (figure 13) indicates the presence of instabilities in the region of strong gradients, with a ballooning character, i.e. larger amplitudes on the low-field side, in the region of unfavourable curvature.
The fluctuations are characterized by a skewness that undergoes a transition from positive to negative across the point of maximum gradient steepness. A quasi-coherent peak is clearly observed at different locations in the plasma around 20 kHz. The coherent feature appears to be more localized to the regions of strong pressure gradients, and have an even stronger ballooning character than the fluctuation standard deviation. This can be seen in figure 14 (left), where the standard deviation of filtered signals of different probes operated in ion saturation current is shown. The frequency window of 16.1–22.7 kHz used as a filter has been obtained from the full-width at half-maximum of a Gaussian fit of the power spectral density of the probe #7, where a quasi-coherent mode is most evident (figure 14, right). Preliminary measurements of the wavelength of this mode and of the E × B flow patterns indicate that the mode frequency is compatible with the value of the electron diamagnetic drift frequency, taking into account the Doppler shift between the plasma and the laboratory frame due to the local E × B motion.

Figure 14. Left: profile of the standard deviation of the probe filtered signals in the frequency band between 16.1 and 22.7 kHz. Right: spectra of ion saturation signals from three probes located around the circular region of strong mode activity, associated with strong pressure gradients. The black circles denote, in addition to the copper wire, the three probes providing the spectra plotted on the right. Probe #7 is at r = 10.5 cm, z = 0 cm, probe #64 at r = 5.3 cm, z = −9.1 cm, and probe #59 at r = 0 cm, z = −12.1 cm.
Download figure:
Standard image High-resolution imageThe installation of the toroidal wire also allows the production of magnetic geometries with single and double magnetic null-lines, as well as, for particular combinations of currents in the existing set of poloidal coils, snowflake divertor configurations [42–44]. Some of these configurations are illustrated in figure 15. More complex geometries with multiple fully 3D X-points and/or magnetic ergodic/chaotic surfaces could also be generated by additional ad hoc coils installed inside the TORPEX vessel. This system will also allow basic investigations of the interaction of thermal plasma and suprathermal particles with instabilities and turbulence in magnetic configurations of increasing complexity.

Figure 15. Simulated examples of cross-sections of the various configurations that are or will be possible on the TORPEX configuration with internal wire, from limited, on the outboard or inboard side, to a snowflake-like divertor configuration. The colour code indicates the intensity of the poloidal magnetic field.
Download figure:
Standard image High-resolution image
Acknowledgments
This work was partly supported by the Fond National Suisse pour la Recherche Scientifique. K.G. was supported by the US National Science Foundation IRFP Award.
© Euratom 2013.