
Abstract
Tunable white light emission was obtained from ZnO nanorods with lengths ranging from 125 to 165 nm and quantum dots with an average size of 5 nm, synthesized with dodecylamine (DCA) as surfactant. It was possible to tailor the emission from cool to warm white light by changing the concentration of DCA in the synthesis process. The CIE coordinates for the white light obtained were (0.33, 0.32) in the case of photoluminescence and (0.31, 0.33) for electroluminescence from ZnO-based LEDs with a turn-on voltage of 4 and 6 V and a maximum current consumption of 2.32 mA at 10 V.
Export citation and abstract BibTeX RIS
1. Introduction
ZnO nanocrystals have attracted the attention of many research groups due to their potential application in different areas such as biological systems, optoelectronics, solar cells and lighting, to mention just a few [1–4]. They are a direct band gap semiconductor with a room temperature band gap of 3.37 eV and a large excitonic (electron–hole) binding energy of 60 meV, which is greater than that of thermal energy at room temperature (26 meV) [5]. Green (520 nm) and orange (620 nm) emission bands have been widely studied in both nanocrystals and bulk crystals. The green band has been associated with the recombination of a photogenerated hole with the single ionized charge state of the single ionized oxygen vacancy on or very close to the surface of the particle [6], and the orange band has been associated with an excess of oxygen inside the nanoparticle [7, 8]. The yellow emission band has been associated with oxygen interstitials, dislocations and transitions from the zinc interstitial (Zni) to the deep levels [9, 10]. Strong blue emission from zinc oxide powders and thin films have been reported and ascribed to electron transitions from the shallow donor level of oxygen vacancies (ΔEg =∼ 2.8 eV), zinc interstitial to the valence band (ΔEg =∼ 2.7 eV), and from the conduction band to the oxygen interstitial [9, 11, 12]. Both oxygen vacancies and the zinc interstitial are probably formed during the synthesis process due to the kinetic parameters. Recently, strong blue emission has been reported and suggested to arise from the formation of surface ZnO/oleic acid (OA) complexes formed when hydroxyl groups coming from diethanolamine (DEA) react with carboxyl groups from oleic acid [13]. Those visible emission bands make ZnO a very attractive low-voltage phosphor for field emission displays and for electroluminescent devices. Those defects responsible for the visible emission are produced during the synthesis process but, in general, their presence as well as their density are not fully controlled. Moreover, those defects can change from one batch to another. Thus, controlling the synthesis process in order to select and control the presence of specific defects is a challenge, and this is a very important subject of research around the world.
Due to their ability to produce light in the visible range, several groups have tried to produce ZnO-based LEDs emitting UV and blue light [14–16]. However, the fabrication of these devices involves expensive methods such as radio frequency (RF) sputtering and metal organic chemical deposition (MOCVD), which require high temperatures, complex procedures and use of expensive p-type materials such as P-GaN. White light by electroluminescence of ZnO has also been reported, but again, those configurations use very expensive p-type substrates (sapphire and P-GaN) [17, 18]. Few papers about ZnO-based LEDs emitting white light and fabricated with spin coating have been reported so far, since the process of growing nanoparticles such as nanorods involves solvents like alcohol, which can be detrimental to the device or implicates difficult encapsulation of the ZnO nanoparticles into p-type polymers, complicating the reproducibility of this type of device [19–21]. In addition, white LEDs made with ZnO on plastic substrate have been reported, but their process of fabrication is complex due to the hydrothermal procedure needed to grow ZnO nanorods [22].
In this work, a wet chemical method to fabricate zinc oxide nanoparticles with dodecylamine (CH3(CH2)11NH2, DCA) as a surfactant is presented. It is possible to control the amount of defects emitting yellow and blue light by changing the concentration of DCA, which in turn controls the ratio between yellow and blue bands in the white light emission of ZnO nanoparticles. The CIE coordinates for the white light obtained by both photoluminescence and electroluminescence were (0.32, 0.33) and (0.31, 0.33), respectively, which are close to the ideal white light CIE coordinates of (0.33, 0.33). ZnO-based LEDs were fabricated using nanoparticles with a turn-on voltage of 6 V or lower. The shapes of the emission bands were very similar in photoluminescence and electroluminescence, suggesting that our nanoparticles were stable after the LED fabrication process.
2. Experimental
2.1. Synthesis of ZnO nanoparticles
The ZnO nanoparticles were synthesized from an alcohol-based solution. All reagents and surfactants had a purity higher than 98% and were acquired from Sigma Aldrich. They were used without additional treatments. A solution with 20 g of zinc acetate (Zn(O2CCH3)2(H2 O)2, ZnAc) and 50 ml of methanol was prepared and then mixed with water at a ZnAc/H2O molar ratio of 0.025, then dodecylamine (CH3(CH2)11NH2, DCA) was added. The mixture was stirred at 60 °C for 1 h, after which 15 ml of hexane was added to induce precipitation. Next, the white powder was separated by centrifugation, washed several times with methanol and dried at 100 °C for 1 h. Three different samples of ZnO nanoparticles (T1, T2 and T3) were prepared with the same synthesis procedure, the only difference being the amount of DCA used for their fabrication, which was 0.17, 0.34 and 0.45 ml of DCA for T1, T2 and T3, respectively. A sample identified as T4 was also fabricated with the same procedure but using 0.7 ml of triethanolamine (TEA) instead of DCA; this sample was fabricated to discern the effect of surfactant. All samples were dispersed in methanol for characterization.
2.2. Morphological, structural and optical characterization
The morphological and crystalline characterization of the samples was performed using high resolution transmission electron microscopy (HRTEM) with a FEI Titan 80–300 KeV. The samples were grounded, suspended in isopropanol at room temperature, and dispersed with ultrasonic agitation for 30 min. Then, an aliquot of the solution was dropped onto a 3 mm diameter lacey carbon copper grid. The crystalline phase of ZnO was determined by x-ray power diffraction using a Siemens D-5005 diffractometer with a Cu tube and Kα radiation at 1.5405 Å, scanning in the 15°–80° range (2θ) with increments of 0.02° and a sweep time of 2 s. The absorption spectra of nanoparticles dispersed in methanol were taken from 200 to 800 nm with a Perkin Elmer lambda 900 spectrometer using quartz cells at a thickness of 1 cm. The photoluminescence spectra were obtained under 350 nm excitation from a 75 W xenon lamp (Acton Research Corporation). Fluorescence emission was analyzed with an Acton Pro 3500i monochromator and a R955 Hamamatsu photomultiplier tube for visible emission. Fourier transform infrared spectra (FTIR) of samples were recorded in the range of 400–4000 cm−1 on an ABA (MB300) spectrometer using the KBr pellet method.
2.3. Fabrication of ZnO-based LEDs and characterization
The hole transport materials, poly (3,4-ethylenedioxythiophene) poly(styrenesulfonate) (PEDOT : PSS) and the N, N'-Bis(3-methylphenyl)-N, N'-diphenylbenzidine (TPD) were acquired from Aldrich. First, a layer of PEDOT was deposited on ITO (anode) at 3000 rpm for 1 min by spin coating and dried at 100 °C for 30 min. The next layer of TPD was deposited with a solution in chloroform (15 mg ml−1) by spin casting at 2000 rpm and dried at 80 °C for 10 min. After this, a solution of ZnO nanoparticles dispersed in methanol was deposited at 1000 rpm, followed by a deposition of 170 nm of aluminum (cathode) thermally evaporated at a pressure of 5 × 10⁻⁶ mbar. Two ZnO-based LED devices were fabricated and the configurations for those devices were: (a) ITO/PEDOT : PSS (70 nm)/TPD (50 nm)/ZnO (sample T2, 130 nm)/Al (170 nm) (Device 1) and (b) ITO/PEDOT : PSS (70 nm)/TPD (50 nm)/ZnO (sample T3, 130 nm)/Al (170 nm) (Device 2), with an effective emitting area of 4 × 2 mm2. The electroluminescence spectrum was obtained with an Acton Pro 3500i monochromator and a R955 Hamamatsu photomultiplier tube in the visible emission range of 400–800 nm and the current–voltage (I–V) curves were obtained with a Keithley 2400 source meter.
3. Results and discussion
3.1. Morphological and structural characterization
Figures 1(a) and (b) corresponding to sample T2, and 1(c) corresponding to sample T3, show ZnO nanorods with an average length of 160 nm. The nanorods are surrounded with a capping agent, as observed in figure 1(a), which could be DCA as indicated by the bands centred at 736, 2859 and 2925 cm−1 in the FTIR spectra shown in figure 2(a) (see sample T2). Those nanorods are agglomerated along with quantum dots (QDs) distributed around them as marked by red circles in figures 1(a)–(c). In addition, figure 1(b), its inset B2 and the inset in figure 1(c) show some QDs distributed along the length of the nanorods. Other QDs with an average size of 5 nm are dispersed around the nanorods as depicted by the red circles in the inset of figure 1(a). According to those results, the largest nanorods with an average length of 160 nm seem to be formed by the assembly of smaller nanorod subunits with sizes ranging from 35 to 80 nm, as shown in the inset B1 of figure 1(b), where the coalescence between the edges of two nanorod subunits is observed. The nanorod subunits marked by blue circles in figure 1(c) could be formed from smaller nanoparticles such as those observed in the inset of figure 1(a). The crystalline phase of such nanoparticles corresponds to the wurtzite structure (JCPDS 36-1451), as is observed in the x-ray diffraction pattern of ZnO nanorods in figure 2(b) for sample T2. Interestingly, 4 nm ZnO QDs were obtained from sample T4, prepared with TEA instead of DCA, as is observed in figure 1(d) with wurtzite crystalline structure.
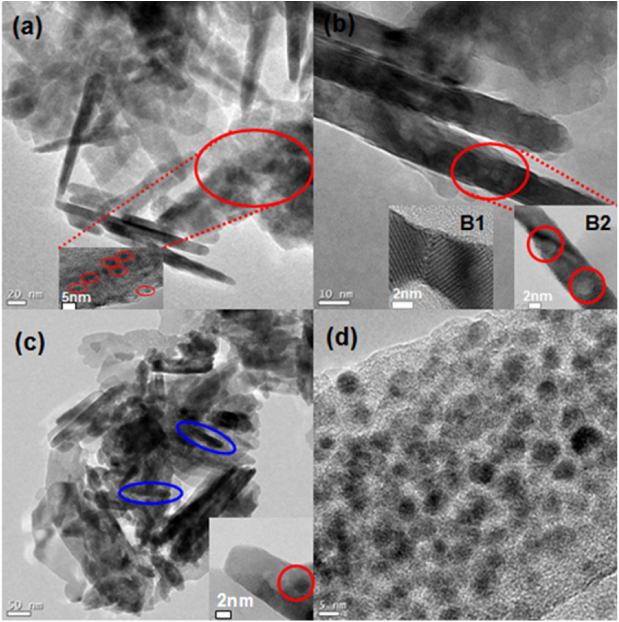
Figure 1. TEM images for ZnO nanoparticles. (a) and (b) correspond to sample T2 and (c) to sample T3. The inset in (a) depicts the dispersed ZnO quantum dots mixed with nanorods; inset B1 shows the edge between two nanorod subunits in the process of coalescence; insets B2 and that of (c) show ZnO quantum dots on the surface of nanorods; lastly, (d) shows ZnO QDs obtained with TEA (sample T4).
Download figure:
Standard image High-resolution image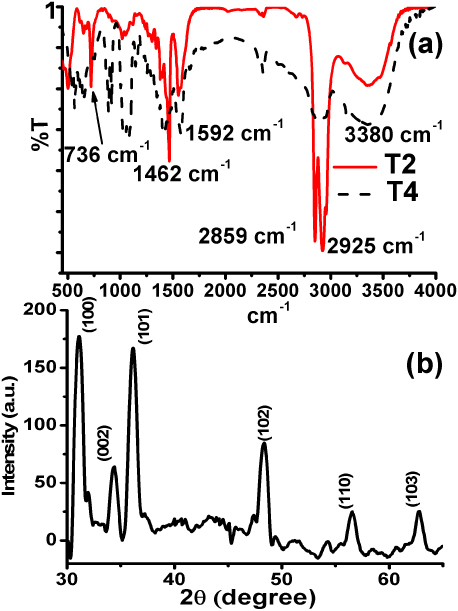
Figure 2. (a) FTIR spectrum of the samples T2 and T4, (b) XRD pattern for ZnO nanoparticles.
Download figure:
Standard image High-resolution image3.2. Defects and photoluminescence in ZnO nanoparticles
As seen in figure 3(a), the absorption spectra of ZnO nanoparticles synthesized with DCA show two dominant bands centred at 281 and 363 nm, and at 271 nm for the sample prepared with TEA. According to the literature, ZnO with defects for blue emission has absorption bands in the range from 270 to 281 nm, and the absorption bands from 350 to 400 nm are related to defects for yellow emission [10, 23–25]. Since we observed absorption bands in those ranges, it is reasonable to assume the presence of Zinc interstitials (Zni) and oxygen vacancies (Vo) in our ZnO QDs and nanorods. Those oxygen vacancies can create deep levels which are necessary for yellow emission [9].

Figure 3. (a) Absorption bands for the samples synthesized with DCA and TEA, (b) Photoluminescence spectra of the samples synthesized with DCA and TEA.
Download figure:
Standard image High-resolution imageThe normalized photoluminescence from samples T1–T3 after excitation at 350 nm show the simultaneous emission of blue and yellow bands centred at 435 nm and 580 nm, respectively, as is displayed in figure 3(b). As was discussed above, it has been reported in the literature that the origin of blue emission is related with surface defects associated with zinc interstitials (Zni), which are formed due to the interaction of amines coming from surfactants and the surface of ZnO, while the yellow emission (deep level emission) originates from oxygen vacancies (Vo) produced during the synthesis process [13, 26, 27]. Interestingly, a blue emission band centred at 435 nm was observed from ZnO QDs synthesized with TEA, as shown in figure 3(b). This emission band is similar to the blue band emitted from samples synthesized with DCA, suggesting that the blue band in samples T1, T2, T3 and T4 comes from the same types of defects and may be from QDs, while the yellow emission band comes from nanorods, as reported previously [28]. In fact, it has been reported that blue emitting ZnO QDs with sizes ranging between 3 and 5 nm and nanorods emitting yellow light can be synthesized with surfactants containing amines [23–25]. In our case, the presence of TEA and DCA (both containing amines) on the surface of ZnO nanoparticles was corroborated by FTIR spectroscopy as shown in figure 2(a). Thus, it is reasonable to conclude that amines created defects which emitted blue light in our samples synthesized with DCA and TEA. Furthermore, a detailed analysis of the FTIR spectra suggests the presence of OH groups characterized by the band centred at 3380 cm−1, as shown in figure 2(a). The excess of hydroxyl groups suggests the presence of interstitial oxygen, which in turn could also produce the blue emission, as was suggested by Han et al [10].
Furthermore, it was possible to tailor the ratio between the blue and yellow bands by changing the content of DCA introduced during the synthesis process, as demonstrated in figure 3(b). The blue–yellow (B/Y) ratio decreases as the concentration of DCA increases; for the samples T1, T2 and T3 the values were 0.8, 0.59 and 0.22, respectively. If we compare the samples T1 and T2, the B/Y ratio decreased because the yellow band increased. By comparing the samples T2 and T3, the B/Y ratio decreased even more because the blue band decreased and the yellow band increased simultaneously. The blue band was the most affected by the concentration of DCA because the emission intensity for the DCA concentration of 0.45 ml was lower than that corresponding to 0.17 ml, but in the case of the yellow emission band the intensity was higher. Therefore, variations in the concentration of DCA make it possible to change the amount of defects that produce yellow and blue emissions in ZnO nanoparticles, as explained earlier. Such decreases in the B/Y ratio affect the CIE coordinates and then make it possible to tune the overall emission from cool white light to warm white light. The CIE coordinates were (0.31, 0.30), (0.33, 0.32) and (0.40, 0.41) for samples prepared with 0.17 ml (cool white), 0.34 ml (ideal white) and 0.45 ml (warm white) of DCA, respectively. The red shift of the yellow band as the concentration of DCA is increased suggests the presence of localized electronic states produced by surface capping [29, 30]. All these results demonstrate that our ZnO nanoparticles fabricated with DCA could be an excellent option for fabricating ZnO-based LEDs emitting white light.
3.3. Electroluminescence in ZnO-based LEDs
Figure 4 shows the normalized electroluminescence spectra of devices 1 and 2 with CIE coordinates of (0.31, 0.33) and (0.34, 0.37), respectively. These spectra were taken at 9 V, and the turn-on voltage was 4 V for device 1 and 6 V for device 2. The B/Y ratio was 0.61 and 0.28 for devices 1 and 2, respectively. Increases of 16% and 5% were observed for the B/Y ratios, respectively, by comparing the ratios with those corresponding to the photoluminescence spectra of samples T2 and T3 in figure 3(b). This result suggests that a slight change in the shape of the emission spectra can be expected in electroluminescence when ZnO nanoparticles are used as an emissive layer. This is probably the result of electrons intrinsically trapped in defects after synthesis being excited along with electrons injected after the application of voltage; whereas in photoluminescence only electrons in defects are excited. Furthermore, a red-shifting of the blue band from 435 nm in photoluminescence to 461 nm in electroluminescence as well as a blue-shifting from 580 to 567 nm in the case of the yellow band was observed and is shown in figure 4. This shifting in the emission peaks, as well as the broadening in the electroluminescence spectra from 750 to 800 nm (compare the spectra in figures 3(b) and 4), indicates that other types of defects are being excited when applying a forward bias. Therefore, the increase in the B/Y ratio and the peaks shifting in the electroluminescence bands could be associated with the excitation mechanism. In the case of photoluminescence, the blue emission could be produced by the recombination of electrons excited directly from traps; that is, from zinc interstitials with holes in the valence band; and the yellow emission could be produced by electrons excited from zinc interstitials towards the deep levels, which are produced by the presence of oxygen vacancies [9]. In the case of electroluminescence, electrons should arrive to the conduction band and then be relaxed to fill the traps located inside the band gap for the ZnO. Then, the corresponding relaxations in the valence band and deep levels are achieved to produce blue and yellow emissions, as shown in the energy diagram in figure 5.
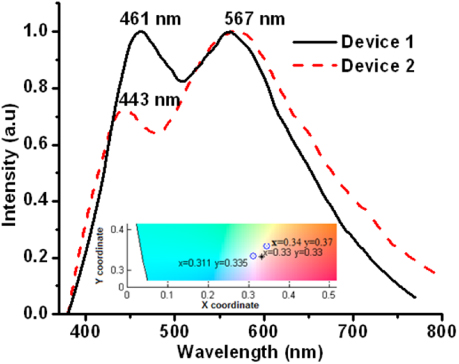
Figure 4. Electroluminescence spectra for the devices made with the sample T2 (device 1) and T3 (device 2). The inset shows the CIE coordinates for the emission of those devices.
Download figure:
Standard image High-resolution image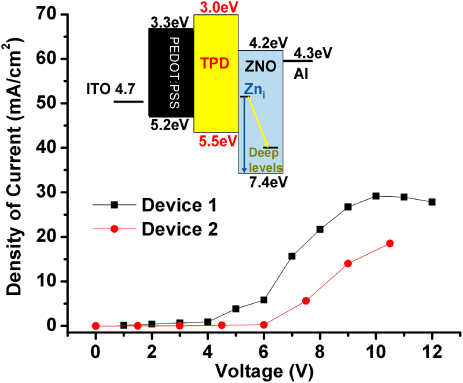
Figure 5. The I–V curves for devices 1 and 2. The inset represents an energy diagram for the ZnO-based LEDs.
Download figure:
Standard image High-resolution image
From the energy diagram in the inset of figure 5, it is reasonable to assume that the zone for recombination and formation of excitons should be the interface between the TPD and ZnO layers. It would be easy to accumulate electrons coming from the Al electrode and holes arriving from PEDOT : PSS in this interface because the injection barrier height for electrons from Al to the conduction band of the ZnO is just 0.1 eV, and the barrier to inject holes from the TPD to the valence band of ZnO is 1.9 eV. Figure 5 shows the I–V curves for devices 1 and 2. In general, the density of current is higher for device 1, which presents a higher intense blue emission band than device 2, as shown in figure 4. Thus, this difference in current could be assigned to the excitation of more defects emitting blue light. Therefore, the blue component was stronger for device 1. Furthermore, the current for device 2 was lower probably because we had more DCA capping the nanoparticles in this device in comparison with that used to fabricate device 1. As a consequence, it is expected that greater voltage is required for the electrons to reach the defects and to give out light in device 2. This fact is reflected in the turn-on voltage, since it was 4 V and 6 V for devices 1 and 2, respectively. Finally, it is noticeable that the maximum current consumption at 10 V was 2.32 mA and 1.66 mA for devices 1 and 2, respectively, which is lower or comparable to those currents reported for ZnO-based LEDs [20, 31].
4. Conclusions
In conclusion, a procedure was demonstrated for the preparation of ZnO nanorods and quantum dots with controlled defects emitting blue and yellow light, allowing in turn the possibility to tune the CIE coordinates of signals emitted from cool to warm white light in photoluminescence and electroluminescence. ZnO-based LEDs with white light emission with CIE coordinates of (0.31, 0.33) were fabricated; these coordinates being close to the ideal white light coordinates of (0.33, 0.33). These results suggest that nanoparticles and/or devices could be useful for applications in displays and lighting. Since the shape of the emission spectra measured by photoluminescence and electroluminescence was almost the same, it is possible to conclude that nanoparticles are stable for use in devices for lighting applications.
Acknowledgments
We acknowledge the financial support from CONACyT through research grant 134111 and a PhD scholarship for J Oliva and L Pérez.