


ABSTRACT
We present results from a 57.6 ks Chandra observation of the cluster gas associated with the fat-double radio galaxy 3C 310. We find a surface brightness discontinuity in the gas outside the southern radio lobe that we attribute to a shock driven by the supersonic inflation of this lobe ∼180 kpc from the nucleus. Modeling the surface brightness/density jump, the shock has Mach number 1.5–1.9, depending on the assumptions one makes about the density profile and the nature of the energy input. There are not sufficient counts in the image to detect conclusively the temperature jump associated with the shock. The total mechanical energy of the outburst is 5 × 1060 erg. Assuming a Mach 1.9 shock, the age of the outburst is ∼100 million yrs, and the time-averaged power of the outburst is ∼1.3 × 1045 erg s−1. The power input is 100 times greater than the radiative losses of the gas within the radius of the shock. Most importantly, the equivalent heat input due to the entropy increase is roughly 10% of the thermal energy of the gas to the radius of the shock. 3C 310 is another example where regular outbursts of the observed strength with a duty cycle of 0.1 could offset the radiative losses of the gas near the Bondi radius and regulate feedback. We also detect a cool filamentary X-ray arm along the eastern periphery of the southern radio lobe. This arm is probably composed of low-entropy gas dredged up in the inflation of the radio plasma, similar to features seen in M87.
Export citation and abstract BibTeX RIS
1. INTRODUCTION
Over the past decade Chandra and XMM-Newton observations of the hot gas in the cores of clusters of galaxies have significantly revised our view of the thermodynamic evolution of this gas. In particular, XMM-Newton/Reflection Grating Spectrometer observations conclusively demonstrated that the large amounts of cool gas predicted to be present in the cores of so-called cooling flow clusters of galaxies simply are not present (David et al. 2001; Peterson et al. 2001, 2003). Since the radiative lifetime of the gas in the central regions of cool core clusters is a fraction of the Hubble time, this gas must occasionally be reheated to offset the radiative losses and prevent the formation of huge (up to 1000 M☉ yr−1) cooling flows. Three scenarios are generally invoked to suppress cooling flows: feedback from the central supermassive black hole (SMBH), subcluster mergers, and thermal conduction from the outer regions of the clusters. The most viable method in our opinion, and the one that has received the most attention both observationally and theoretically has been feedback from the central SMBH.
In the outburst/feedback scenario, gas radiatively cools at the center of a cluster of galaxies. At a critical threshold, the central SMBH transitions from quiescence to outburst launching jets that produce radio lobes within the ambient intracluster medium (ICM). The energy input from jets and the subsequent inflation of the lobes can reheat the gas and may offset radiative losses and prevent large cooling flows from forming. One of the central unanswered questions is how much of the jet energy, and ultimately bubble enthalpy, from the nuclear outburst actually goes into heating the gas in the core. A duty cycle of ∼5% is more than sufficient to offset radiative cooling, if most of the bubble enthalpy ultimately heats the gas in the core. Quasi-static inflation of radio lobes would do pV work against the gas and could in principle offset the radiative losses of cooling gas. Much of this work is, however, done moving the gas against the gravitational potential, and net work of nearly −pV is done as the gas returns to its original position after the inflated bubble rises buoyantly (Mathews et al. 2006). Even if the buoyant rise is dissipative, much of the bubble enthalpy will ultimately be transferred to the gas in the halo, not in the core (Vernaleo & Reynolds 2007). Only a small fraction of the energy of quasi-static lobe inflation likely heats the gas in the core.
One way to strongly couple the inflation of the radio lobe to the gas in the core is to inflate the lobes supersonically. A shock driven into the gas will increase its entropy locally and will offset cooling. Relatively weak (Mach number, M, < 1.4) shocks have been detected in a number of systems including the Perseus (Fabian et al. 2003) and Virgo clusters (Forman et al. 2007), but stronger shocks where the entropy changes are largest are an apparently rare phenomenon and have only been observed in a small number of systems. Stronger shocks (M > 1.5) are most often seen in lower mass systems such as Cen A (Kraft et al. 2003; Croston et al. 2009), NGC 5813 (Randall et al. 2011), NGC 4636 (Baldi et al. 2009), and NGC 4552 (Machacek et al. 2006), although shocks with similar Mach number also have been observed in the cluster gas around Her A (Nulsen et al. 2005) and in A3847 (Croston et al. 2011). Detection of additional examples of cool core clusters with active galactic nucleus (AGN) driven shocks is critical in understanding the energetics and duty cycle of such outbursts, as well as the overall thermodynamic evolution of cluster cores.
3C 310 is a fat-double radio galaxy in a moderately rich environment known primarily for its bright radio ring in the center of the southern radio lobe (van Breugel & Fomalont 1984; Gizani et al. 2002). In the radio band, the source consists of a bright nucleus and two roughly equal size lobes. The southern lobe is considerably brighter than the northern lobe, and contains a bright, centrally located ring. The bright radio nucleus and arcsecond scale radio jet demonstrate that this radio galaxy is still powered. The lack of a large-scale radio jet or terminal hot spots on large scales suggests that the kinetic energy of the jet is efficiently thermalized (i.e., in the sense that the kinetic energy of the jet is converted to the random motion of relativistic particles and magnetic fields of the radio lobes) and that the lobes are entirely pressure driven, similar to the southwest radio lobe of Cen A (Kraft et al. 2003). This radio galaxy was first detected in X-rays by Burns et al. (1981) with an Einstein IPC observation. Using the ROSAT HRI, Hardcastle & Worrall (1999) reported the detection of a central point source and extended diffuse emission, presumably cluster gas.
In this paper, we present results from a 57.6 ks Chandra/ACIS-S observation of 3C 310. This radio galaxy is a member of the complete 3CRR (z < 0.1) sample observed with Chandra. Results from the entire sample will be presented in a future publication (M. Birkinshaw et al., in preparation). This paper is organized as follows. In Section 2, we briefly describe the data cleaning and preparation. Spectra and images of various features of interest are presented in Section 3. In Section 4, we provide an interpretation and context of the results. We end with a summary and speculate on possibilities for future work. We use a redshift of 0.0538 for 3C 310 (Gregory & Burns 1982). At this redshift, the luminosity distance, dL, is 236.7 Mpc and 1'' = 1.034 kpc in our adopted cosmology (H0 = 71, ΩM = 0.27, Ωvac = 0.73). All spectral fits include absorption by the Galactic (3.36 × 1020 cm−2) column (Dickey & Lockman 1990) and all uncertainties are at 90% confidence unless otherwise stated.
2. DATA ANALYSIS
The radio galaxy 3C 310 was observed for 57.6 ks with Chandra/ACIS-S on 2010 April 9 (ObsID 11845) as part of the HRC Guaranteed Observation Time program (PI: Stephen Murray). All analyses on these data were performed using CIAO release 4.2. We examined the data for periods of high background and found almost no background flaring. The total good time after removal of background flares is 57.5 ks. The data were reprocessed with the most recent gain files, the sub-pixel randomization was removed, and the S4 chip was destreaked. Point sources were detected using the CIAO program wavdetect, and point sources were all removed from the event file. The rate in the 7.0–10.0 keV band in the image is consistent with the rate in the dark sky background files, so we used the appropriate dark sky data for all background subtraction in spectral fits. We compared our spectral fits using the dark sky background with those created using local background along the edge of the S3 chip east of the nucleus and found no statistically significant difference. All spectral fits of the diffuse emission were binned to at least 25 counts bin−1 so that χ2 statistic can be used as a goodness-of-fit measure. In some cases where the spectra of large regions of low surface brightness and relatively large background contributions were extracted, the data were binned up to 100 counts bin−1.
An archival 1.45 GHz Very Large Array (VLA) observation of 3C 310 was taken from the public archive for comparison with our X-ray data. This observation was made on 1981 May 31 in the B+C configuration. These data were reduced in the standard manner, and the final image was smoothed with a restoring beam of 4'' (FWHM). Detailed analysis and results from this observation were presented in van Breugel & Fomalont (1984).
3. RESULTS
A Gaussian-smoothed (σ = 8''), exposure-corrected Chandra/ACIS-S image of 3C 310 in the 0.5–2.0 keV band is shown in Figure 1. All point sources, including the active nucleus of the host galaxy of 3C 310, have been removed from the image. A 1.45 GHz radio map of 3C 310 is shown in Figure 2. Contours from the radio map are overplotted on the X-ray image in Figure 3 to show the relationship between the hot gas of the ICM and the radio plasma of the lobes. There are several features of note. First, the extended X-ray emission from the ICM is visible, and there is a decrement, or cavity, in the X-ray emission within the envelope of the southern radio lobe. There is also an X-ray filament that extends along most of the eastern edge of the southern radio lobe (designated by the white arrow in Figure 1). There is a bright extended, irregularly shaped X-ray enhancement ∼35 kpc in radius at its longest extend, roughly centered at the radio core with a well-defined boundary, similar to structures seen in 3C 442A (Hardcastle et al. 2007; Worrall et al. 2007) and several other radio galaxies. The relationship between the southern radio lobe, the radio ring, the X-ray filament, and the X-ray cavity can be seen more clearly in Figure 4. The filament bounds the eastern boundary of the southern lobe, and the X-ray cavity is offset to the northeast of the radio ring.
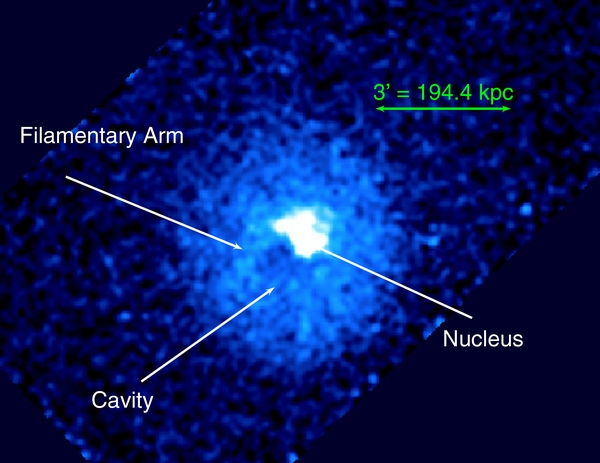
Figure 1. Smoothed (Gaussian σ = 8''), background-subtracted, exposure-corrected, 0.5–5.0 keV Chandra/ACIS-S image of the cluster gas associated with the radio galaxy 3C 310.
Download figure:
Standard image High-resolution image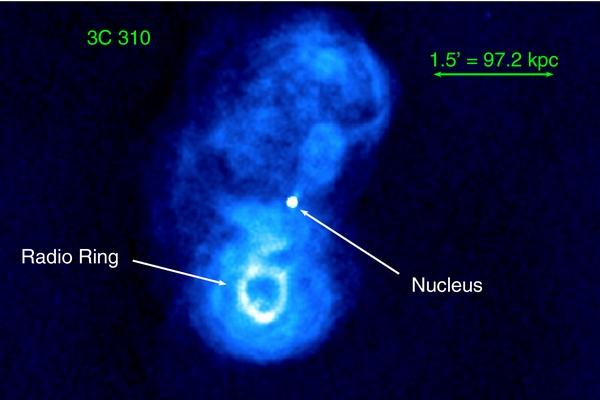
Figure 2. 1.45 GHz radio map of 3C 310 (4'' circular beam). The positions of the active nucleus and the radio ring are labeled.
Download figure:
Standard image High-resolution image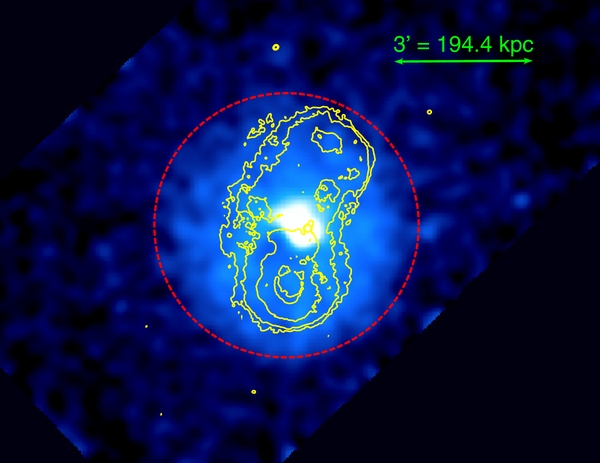
Figure 3. Smoothed, background-subtracted, exposure-corrected, 0.5–5.0 keV Chandra/ACIS-S image of the cluster gas associated with the radio galaxy 3C 310 with 1.45 GHz radio contours overlaid. The red dashed circle denotes the approximate position of the shock in the ICM gas.
Download figure:
Standard image High-resolution image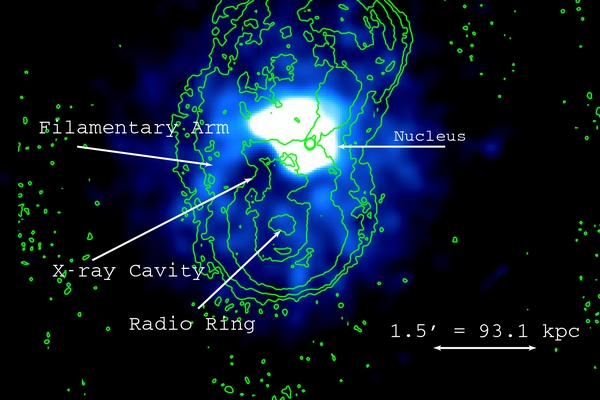
Figure 4. Smoothed, background-subtracted, exposure-corrected, 0.5–5.0 keV Chandra/ACIS-S image of the cluster gas associated with the radio galaxy 3C 310 with 1.45 GHz radio contours overlaid zoomed in on the southern lobe. Note that the X-ray cavity is offset ∼70 kpc to the northeast of the radio ring and the approximate center of the radio lobe.
Download figure:
Standard image High-resolution image3.1. The Surface Brightness Edge
The most striking feature in the image is the sharp decrease in surface brightness of the gas just beyond the southern radio lobe. A similar feature exists along the northern radio lobe but is somewhat less visible in our data due to the lower quantum efficiency of the front side illuminated S2 CCD. The gap between the S2 and S3 CCDs, not visible in the exposure-corrected images, lies to the northwest of the nucleus and cuts across the northern side of the discontinuity. To quantify this jump in surface brightness beyond the southern radio lobe, we created a surface brightness profile in a 55° wedge centered at the nucleus in the 0.5–5.0 keV band as shown in Figure 6. The discontinuity in the surface brightness at ∼180 kpc from the nucleus is marked by the vertical line. The appearance of surface brightness discontinuities in the ICM of clusters is generally attributed to one of three phenomena: supersonic inflation of radio lobes, "sloshing" or non-hydrostatic motions of the gas cores in clusters due to minor mergers (Markevitch & Vikhlinin 2007), or the ram-pressure stripped cool cores of merging sub-clusters. The relative proximity of the radio lobes to the surface brightness discontinuity strongly favors the first interpretation.
To determine the physical origin of this discontinuity, we fitted the temperature in two sectors (55° opening angle) using an APEC model with fixed Galactic absorption, one inside and one outside the discontinuity. The inner and outer boundaries of region 1 (interior to the discontinuity) are 120'' and 175'' (181 kpc), respectively. The inner and outer boundaries for region 2 (exterior to the discontinuity) are 175'' and 330'', respectively. The regions are shown as the vertical lines in Figure 6, and the best-fit temperatures and 90% uncertainties are 2.1+1.2− 0.4 (χ2ν = 0.92 for 72 degrees of freedom) and 3.2+1.1− 0.6 keV (χ2ν = 0.59 for 56 degrees of freedom), outside (pre-shock) and inside (post-shock) the discontinuity, respectively. These two regions contain 1200 (3180) and 900 (500) source (background) counts, respectively, in the 0.5–5.0 keV band. We initially allowed the elemental abundance to vary, but it was poorly constrained in both fits, so we froze it at 0.4 times the solar value. At these temperatures the emission is dominated by the continuum, so none of the conclusions below are significantly impacted by this choice. To confirm this we also fit the spectra with Z frozen at 0.2 and 1.0 times the solar value and found no statistically significant difference in the fitted temperature.
In an effort to reduce the statistical errors on the measured temperatures on both sides of the edge, we extracted spectra in much larger annular regions (140°) inside and outside the discontinuity. We are averaging over a much larger region and therefore averaging over a range of temperatures, but the spectra contain roughly three times the number of counts (both source and background) as the previous fits. We find temperatures of 2.6+0.6− 0.4 and 3.0+0.5− 0.4 keV interior and exterior to the discontinuity, respectively. We reduced the size of the statistical error bars, but the temperatures of the two regions are still consistent at better than 90% confidence.
3.2. The Filamentary Arm, the Southern Cavity, and Gas Core
In addition to this nearly circular surface brightness discontinuity, there is an arm, or filament, of gas that appears to lie along the eastern boundary of the southern radio lobe. The northern-half of this filament appears to lie within the radio lobe in projection, the southern-half exterior along the eastern periphery. We extracted the spectrum of this filament using a rectangular region adjacent to and east of the filament as "background" to account for the overlying cluster gas. The spectrum is reasonably well fit by a single temperature APEC model with kBT = 1.39 ± 0.05 keV (χ2ν = 1.30 for 31 degrees of freedom), considerably cooler than the surrounding gas. There are significant residuals around the Fe L blend, and if the Fe abundance is allowed to freely vary, an unrealistically low value (∼0.2 times solar) is found. A low value of the fitted elemental abundance often suggests the presence of multi-temperature gas in the filament. There are roughly 1500 source counts and 370 background counts in this region, not sufficient to constrain multi-temperature fits. We fitted the spectra with a two temperature model but there are no strong constraints on either component. The mean temperature of the filament is clearly lower than that of the surrounding gas. This low abundance could also indicate some mixing between cooler gas dredged up from the cluster core and the lower metallicity gas at larger radii.
We extracted spectra from a 56 8 region centered on the southern radio lobe coincident with the radio ring and the X-ray decrement. The best-fit temperature of the gas in this region is 4.1 ± 0.7 keV (χ2ν = 0.95 for 59 degrees of freedom). The temperature of the gas in this region is consistent within uncertainties with that measured above interior to the discontinuity. The surface brightness decrement in this region is probably a cavity evacuated by the inflation of the radio lobe. There is no evidence for the presence of higher temperature gas (above that of the ambient medium) in the radio lobe. As described below, there is also no evidence for a non-thermal component in the spectrum of the lobe suggestive of inverse Compton (IC) scattering of cosmic microwave background (CMB) photons off the relativistic electrons in the lobe.
The gas core is also highly disturbed and shows clear signs of an on-going merger. An X-ray image of the central ∼100 kpc radius region (point sources removed) and an optical/DSS image of the same region are shown in Figure 5. There are three bright early-type galaxies at the center of the cluster (Martel et al. 1999; Madrid et al. 2006), denoted by the red Xs in the X-ray image. The host galaxy of 3C 310, VV 204, is the central brightest early-type galaxy. The X-ray isophotes are highly distorted, and the X-ray peak is offset from the brightest optical galaxy. The X-ray morphology is similar to that seen in "sloshing," the non-hydrostatic gas motions induced in cluster gas due to mergers (Markevitch & Vikhlinin 2007). The extended tail ∼50 kpc to the north–northeast of the three galaxies is similar to the swirls that are seen in both simulations and observations of sloshing (Ascasibar & Markevitch 2006). We extracted the spectra of two regions of this gas core, a 15 kpc radius circular region centered on the brightest galaxy, VV 204 which hosts 3C 310 (excluding the nucleus), and a 40 kpc × 30 kpc rectangular region centered on the "tail" to the north of VV 204. The temperatures of the core and tail are 1.49 ± 0.10 and 1.67 ± 0.15 keV, respectively. The fit in the "tail" region is poor (χ2ν = 1.9 for 19 degrees of freedom), suggesting multi-temperature gas. The radiative lifetime of the gas within ∼10 kpc of the nucleus is a few Gyrs, demonstrating that radiative losses are significant in the central region of the cluster. The number of counts in the two regions is limited (1044 and 740 source counts in the 0.5–2.0 keV band in the core and tail regions, respectively) preventing a more detailed investigation of the temperature/entropy structure.
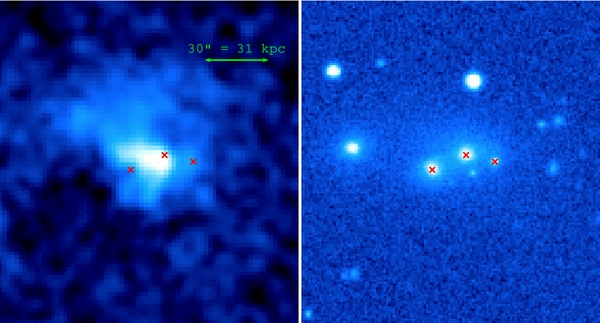
Figure 5. Smoothed (Gaussian rms = 6'') Chandra/ACIS-S image (left) and DSS (red) image (right) of the central 100 kpc of the 3C 310 cluster. The three red Xs in the figures denote the approximate centers of the early-type galaxies. Note the offset between the peak of the X-ray emission and the host galaxy of 3C 310 (the brightest early-type galaxy in the center) and the diffuse tail to the north.
Download figure:
Standard image High-resolution image3.3. The Nucleus
Finally there is a faint point source coincident with the radio and optical nucleus, presumably the central AGN. There are only ∼16 counts above background. Assuming a power-law spectrum with photon index 2 and Galactic absorption, the unabsorbed X-ray luminosity of the nucleus is 1.3 × 1040 erg s−1 in the 0.5–2.0 keV band. This is a lower limit to the X-ray luminosity of the nucleus as any absorption intrinsic to the source would increase this value.
4. INTERPRETATION
Surface brightness discontinuities are often seen in the thermal emission of groups and clusters undergoing mergers, either as merger cold fronts (such as seen in A3667; Vikhlinin et al. 2001) or sloshing fronts (such as seen in A1795 and A1644; Markevitch et al. 2001; Johnson et al. 2010). The circular symmetry of the discontinuity seen in the 3C 310 cluster gas, as well as the close association of the radio lobes with the discontinuity, strongly supports the idea that this feature is related to the radio outburst and not to any ongoing merger activity. In addition, the temperature of the gas interior to the discontinuity in either of the merger scenarios is typically colder than the exterior gas. We find that the temperature of the gas inside the discontinuity (i.e., closer to the nucleus) is marginally hotter than the gas outside the discontinuity within large errors. Given the density and (within larger errors) temperature contrast, circular symmetry, and the close association of the radio lobe with the X-ray surface brightness discontinuity, we conclude that the discontinuity is a shock in the gas created by the supersonic inflation of the radio lobe similar to features seen in NGC 4552 (Machacek et al. 2006) and M87 (Forman et al. 2005), among many others.
We note that the temperatures measured in the Section 3 are projected temperatures. The quality of the data is not sufficiently high to permit spectral deprojection, but the interior temperature should be regarded as a lower limit. There is certainly no evidence to suggest that the gas inside the discontinuity is cooler than the exterior gas, thus strongly disfavoring either the sloshing or cold front scenarios (Markevitch & Vikhlinin 2007). Additionally, it seems very unlikely that the radio lobes of a nuclear outburst would lie just interior to a sloshing contact discontinuity or a cold front. We conclude that the surface brightness discontinuity is a shock due to the supersonic inflation of the radio lobes.
To constrain the strength of the shock, we fitted the surface brightness profile with a density model that is constant out to the discontinuity at the shock (rshock = 180 kpc from the nucleus), then falls as a beta model profile beyond this. The core radius, rc, of the beta model was chosen to be 150 kpc, somewhat less than rshock. The conclusions are not sensitive to this choice of core radius of the external gas and are justified based on the flat surface brightness profile out to ∼150 kpc from the nucleus. We find a best-fit value for the beta index of 0.61 ± 0.04. The projected surface brightness profile from this density model is overlaid in Figure 6. The gas densities across the discontinuity, just inside and outside the shock, are 1.5 and 0.7 × 10⁻³ cm−3, respectively. The density jump across the discontinuity is a factor of 2.1+0.6− 0.4. From the Rankine–Hugoniot (RH) conditions, this implies a shock Mach number of 1.9+0.7− 0.3 with a temperature jump of a factor of 1.9+1.0− 0.7 across the shock. Given the 2.1 keV pre-shock gas temperature, the post-shock temperature should be ∼3.8+2.2− 0.7 keV. The measured post-shock gas temperature is consistent, within the large errors, with this prediction. This simple analysis neglects the complex temperature structure behind the shock, and the temperatures quoted above are projected temperatures. In practice, the temperature jumps predicted by the RH conditions are typically good estimates of those actually observed in systems with weak shocks. For example, the temperature jump observed in the 14 kpc shock around M87 is about 1.2 for a Mach 1.2 shock, exactly what is predicted from the RH conditions (Forman et al. 2007).

Figure 6. Surface brightness profile of 3C 310 cluster gas in the 0.5–5.0 keV band in a 55° wedge to the south of the nucleus. The regions used for spectral fitting are denoted with vertical lines. The best-fit pre- and post-shock temperatures and 90% uncertainties are shown in green and red, respectively. The continuous curve is the projected surface brightness profile for the constant plus beta model density profile described in the text.
Download figure:
Standard image High-resolution imageIn this model, the thermal energy of the gas out to the radius of the shock is ∼1061 erg. The age of the outburst, defined as the distance from the nucleus to the shock divided by the inflation velocity of the lobe (assuming M = 1.9 in 2.1 keV gas), is ∼1.3 × 10⁸ yr. The bubble enthalpy, H = (γ/(γ − 1))pV, assuming γ = 4/3 (i.e., H = 4pV) and including the contribution from both lobes, is ∼5 × 1060 erg and is approximately equal to the total mechanical energy of the outburst, if the lobes are driving a shock. The time-averaged power of the outburst is ∼1.3 × 1045 erg s−1. Both the total outburst energy and time-averaged power are large, but do not approach the most powerful known outbursts in Hyd A, MS 0736, and Her A. The mechanical power is several orders of magnitude below the Eddington rate. Using the measured optical luminosity of the host galaxy and assuming a mass-to-light ratio of 8, the mass of the central SMBH is ∼2 × 10⁹ M☉ according to the Magorrian relation (Magorrian et al. 1998).
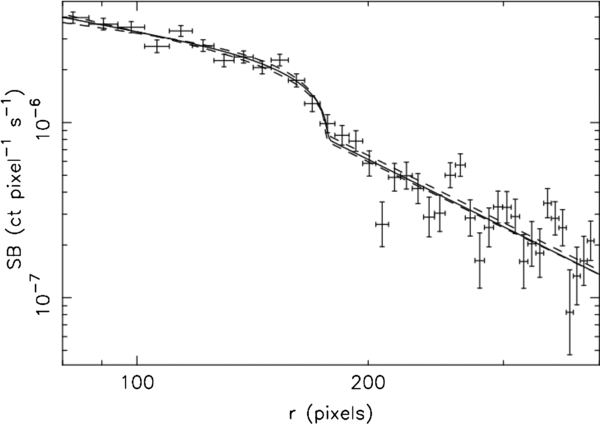
As an independent alternative to estimate the power of the outburst and confirm the presence of a shock, we use a one-dimensional hydrodynamic model of a point explosion in an initially isothermal atmosphere. The unshocked gas is assumed to have a power-law density profile, and the index of this power law is determined from the surface brightness profile of the gas exterior to the shock. The gravitational potential of the cluster in this model is adjusted so that the gas is initially hydrostatic. This model has been applied to radio galaxy induced shocks in other systems and is described in detail in Nulsen et al. (2005). The observed and modeled surface brightness profiles in the same 55° wedge to the southwest of the nucleus described above are shown in Figure 7. A shock is clearly indicated ∼180 kpc from the nucleus. The best-fit Mach number is 1.53 ± 0.10 (at 90% confidence for one interesting parameter) and the power-law index of the density profile is 1.59. The index of the density profile corresponds to a value of β in the β-model profile of 0.53, marginally flatter than our fitted result above, but different assumptions are made about the distribution of the gas interior to the shock. The solid curve in Figure 7 shows the surface brightness profile corresponding to the best-fit Mach number. The models corresponding to the 90% upper and lower limits to the Mach number are shown as the dashed lines. The time since the outburst is 1.06 × 10⁸ yr, the total energy of the outburst is 6.4 × 1060 erg, and the time-averaged power of the outburst is 1.9 × 1045 erg s−1. The two models give results that are in fairly good agreement, the current Mach number of shock is somewhat smaller in this model than the previous analysis, but consistent within errors. The age of the outburst and energetics in the two models are similar.
Figure 7. Surface brightness profile of 3C 310 cluster gas with best-fit shock model (solid curve) and 90% upper and lower limits (dashed curves). The shock model is a one-dimensional simulation of a point release of energy in an atmosphere with a power-law density profile as described in Section 4. The best-fit Mach number is 1.53 ± 0.10.
Download figure:
Standard image High-resolution image
The uncertainties in the above analysis are dominated by three factors, two of which are related to the limited statistics of the existing Chandra observation. First, the uncertainties on the pre-shock and post-shock temperatures are too large to formally confirm that the gas interior to the surface brightness feature is hotter than the ambient gas. A much deeper observation is required. Second, the surface brightness (and therefore density) profile of the gas exterior to the shock is not well constrained. Finally, we do not know the temperature and density profile of the gas before it was shock heated. The two models above cover the limiting cases of a constant density profile between the shock and the nucleus and a power-law density model. The differences in the estimates of the Mach number and outburst energies between the two models illustrate the model-dependent systematic uncertainties.
The total radiative luminosity of the gas out to the radius of the shock (180 kpc) is ∼1.7 × 1043 erg s−1 in the 0.1–10.0 keV band (unabsorbed). Thus, the energy of the outburst is nearly two orders of magnitude larger than the radiative losses within this radius, more than sufficient to offset radiative cooling of the gas in the core and prevent the formation of a cooling flow. More importantly, the heat input to the gas due to the entropy increase of the shock, ΔS = (3/2)(kB/μmH)Δln (P/ργ), is ∼8%–10% of its internal energy (depending on which model one uses to estimate the shock Mach number). With a duty cycle of only ∼10%, a sufficient rate of outbursts of similar power can easily offset the radiative losses of the gas at the Bondi radius and regulate feedback. The 3C 310 outburst is then another example in the growing evidence that radiative cooling of cluster gas is balanced by regular nuclear outbursts. Additionally, the relationship between the radio luminosity of the lobes and the mechanical power of the lobe inflation is approximately consistent with the general trend found for a large sample of radio galaxies (Birzan et al. 2008).
It is interesting that virtually every lobe-dominated FRI in which the hot gas environment can be studied in detail with Chandra is inflating supersonically. This includes 3C 310, the southwest radio lobe of Cen A (Kraft et al. 2003), M87 (Forman et al. 2005), Hyd A (Gitti et al. 2011), and Per A (Fabian et al. 2006). Contrast this with the inner jets of "canonical" FR I sources such as 3C 31 (Hardcastle et al. 2002), 3C 449 (Croston et al. 2004), NGC 315 (Worrall et al. 2003), and the northeast (forward) jet of Cen A. In the latter cases, the jet is well established and transporting energy to large radii nearly losslessly, with little or no interaction with the ambient medium (other than perhaps sweeping gas into the jet via Kelvin–Helmholtz instabilities). What causes some jets to thermalize their internal energy and become pressure dominated bubbles and other jets to remain momentum dominated for tens or hundreds of kpc? In the case of Cen A, it has been argued that mass entrainment from asymptotic giant branch stars and pressure differences in the large-scale environment play a key role (P. Nulsen et al. 2011, in preparation). Whether this specific process can play a key role in the dynamics of something as large and as powerful as 3C 310 (30 times larger than the inner lobes of Cen A and two orders of magnitude more powerful) is unclear, but mass loading from stars (in the lower power sources) or perhaps Kelvin–Helmholtz instabilities (in the larger, more powerful cases) and dissipation are likely to be key components in the answer.
We computed the equipartition pressure of the radio lobes assuming that the lobes are spherically symmetric, have unity filling factor, no protons (i.e., κ = 0) and γmin = 10 (γmin is the minimum particle energy for the relativistic electron energy distribution in the lobe assuming a power-law model), and find that the equipartition pressures of the northern and southern lobes are then 3.6 and 5.5 × 10⁻¹³ dyn cm−2, respectively. For comparison, the pressure of the thermal gas surrounding the lobes is ∼1.7 × 10⁻¹¹ dyn cm−2, more than an order of magnitude larger. To evaluate the pressure balance between the radio lobes and ambient gas, and to better understand the particle content of the radio lobe, we redid the spectral fits of the radio lobes including a power law with photon index 1.6 to represent inverse Compton scattering of CMB photons (IC/CMB) off the relativistic electrons in the lobes. The 90% upper limits to the X-ray flux densities from the northern and southern lobes are 2.53 and 4.43 nJy, respectively. Using these upper limits on the IC/CMB emission to constrain departures from equipartition (in the sense of electron domination), the lobe pressure could only be ∼1.7 times larger and remain below the X-ray limits, still well below the pressure of the ambient medium. The lobes must either be magnetically dominated or there must be an additional component providing pressure support. This large difference between the ambient gas pressure and the equipartition pressure of the radio lobes is commonly seen in FR I radio galaxies (Morganti et al. 1988; Worrall & Birkinshaw 2000; Croston et al. 2003, 2008).
There is no obvious relationship between the radio ring (van Breugel & Fomalont 1984) and the X-ray emitting gas. There are no enhancements or decrements in the X-ray emission around the ring, suggestive of a dynamical interaction. There is an X-ray decrement, or cavity, ∼70 kpc to the northeast of the radio ring, but the relation between the ring and the cavity is unclear. This ring does not appear to be the terminal hot spot of the jet, at least its morphology is very different from those in FR IIs generally. Chandra has detected a wide range of interactions between cluster gas and radio plasma (Worrall et al. 2007; Machacek et al. 2007) where the interplay between nuclear outbursts and ongoing galaxy merging can create unusual structures in the morphology of the radio lobes. If that is the case in 3C 310, only a much deeper exposure will reveal the interaction. There is also no evidence of non-thermal (either synchrotron or IC scattering) X-ray emission from the ring such as commonly seen from terminal hot spots (Hardcastle et al. 2004).
Finally, the cool filament to the east of the southern lobe is probably low-entropy gas that has been uplifted from the core with the inflation of the hot bubble. Similar cold filaments have been seen in M87 (Belsole et al. 2001; Forman et al. 2005). Churazov et al. (2001) first suggested an entrainment model for these arms in which they are the uplifted material dragged along as the hot bubble rises buoyantly (i.e., the thermal gas trunk of a smoke ring). In both M87 and 3C 310, the situation is probably more complex. For 3C 310 in particular, part of the filament appears to be multi-temperature and outside the radio bubble in projection. Whatever the detailed micro-physics behind the uplift, it is clear that AGN-driven outbursts can efficiently distribute the metal-rich, low-entropy gas of cluster cores to large radii.
5. SUMMARY AND CONCLUSIONS
We report the discovery of a surface brightness discontinuity in the X-ray emission at 180 kpc from the nucleus in the hot ICM around the fat-double radio galaxy 3C 310 with a 57.6 ks Chandra/ACIS-S observation. We argue that this discontinuity is the result of the density jump in the gas due to the supersonic inflation of the radio lobes, but the quality of the data is not sufficiently high for us to measure the temperature jump associated with this shock. A much deeper Chandra (or XMM-Newton) observation of the gas would be able to definitively measure the temperature jump of the shock and put tighter constraints on the shock Mach number and total energy of the outburst. Based on the inferred density jump across the discontinuity, the AGN-driven shock in the 3C 310 cluster gas is among the strongest (Mach number between 1.5 and 1.9 depending on the assumptions made about the density profile of the shocked gas) known for a radio galaxy in a rich environment. The mechanical power of the outburst is ∼1.3 × 1045 erg s−1 and the total energy of the outburst is ∼5 × 1060 erg.
The detection by Chandra of shock-heated shells of gas around the lobes of radio galaxies is now relatively commonplace (McNamara & Nulsen 2007), although the number of such examples with relatively strong shocks (Mach number >1.5) is still relatively small (less than 10), and most of these are in relatively isolated galaxies (e.g., Cen A, NGC 4636, and NGC 4552), not in the central galaxy of poor clusters such as 3C 310. This is certainly a selection effect due to the proximity of a much larger number of galaxies (and small groups of galaxies) than clusters, but a complete census of the effect of feedback between the ambient gas and nuclear activity in galaxy clusters remains elusive. Sufficiently frequent, mildly supersonic nuclear outflows, such as the ripples in the Perseus cluster (Fabian et al. 2003), are the best explanation for the lack of huge cooling flows in cool core clusters. Occasional stronger shocks, due to the larger change in entropy of the shocked gas such as seen in 3C 310, can also have this effect, and strengthen the case for AGN regulation of cooling flows.
This work was supported by NASA grant NAS8-03060. We thank the anonymous referee for comments that improved this manuscript.