


ABSTRACT
We report the discovery of a new AM CVn system on the basis of broadband photometry obtained with the Kepler satellite supplemented by ground-based optical spectroscopy. Initially retained on Kepler target lists as a potential compact pulsator, the blue object SDSS J190817.07+394036.4 (KIC 004547333) has turned out to be a high-state AM CVn star showing the He-dominated spectrum of its accretion disk significantly reddened by interstellar absorption. We constructed new grids of NLTE synthetic spectra for accretion disks in order to analyze our spectroscopic observations. From this analysis, we infer preliminary estimates of the rate of mass transfer, the inclination angle of the disk, and the distance to the system. The AM CVn nature of the system is also evident in the Kepler light curve, from which we extracted 11 secure periodicities. The luminosity variations are dominated by a basic periodicity of 938.507 s, likely to correspond to a superhump modulation. The light curve folded on the period of 938.507 s exhibits a pulse shape that is very similar to the superhump wavefront seen in AM CVn itself, which is a high-state system and the prototype of the class. Our Fourier analysis also suggests the likely presence of a quasi-periodic oscillation similar to those already observed in some high-state AM CVn systems. Furthermore, some very low-frequency, low-amplitude aperiodic photometric activity is likely present, which is in line with what is expected in accreting binary systems. Inspired by previous work, we further looked for and found some intriguing numerical relationships between the 11 secure detected frequencies, in the sense that we can account for all of them in terms of only three basic clocks. This is further evidence in favor of the AM CVn nature of the system.
Export citation and abstract BibTeX RIS
1. INTRODUCTION
SDSS J190817.07+394036.4 is a relatively bright object picked up in the photometric phase of the SEGUE extension (Yanny et al. 2009) of the Sloan Digital Sky Survey (SDSS; Stoughton et al. 2002), but no spectroscopic follow-up measurements were made on it within the survey. Its SDSS magnitudes are u = 16.13, g = 16.08, r = 16.30, i = 16.53, and z = 16.67, with uncertainties of about ± 0.01 mag. Given that it is located along a line of sight with significant reddening (the absorption coefficient in the r band is estimated to be Ar = 0.64 according to the maps of Schlegel et al. 1998), SDSS J190817.07+394036.4 is therefore a very blue object. On this basis (and see the details in Østensen et al. 2010), it was identified as a potential compact pulsator and was included by the Kepler Asteroseismic Science Consortium (KASC) for the survey phase at short cadence at 58.85 s carried out by the Kepler space observatory (Gilliland et al. 2010). It was observed during season Q3.3 spanning 25.99 days, from UT 2009 November 22 through 2009 December 17.
The compact pulsators are defined as isolated oscillating stars with surface gravities larger than log g = 5. They currently comprise some four distinct classes of pulsating white dwarfs and three different kinds of pulsating hot subdwarfs. They are all very blue stars, with the hottest ones belonging to the GW Vir type (He–C–O-atmosphere white dwarfs that may reach up to Teff ∼ 170,000 K), and the coolest ones belonging to the ZZ Ceti type (H-atmosphere white dwarfs found in a narrow range around Teff ∼ 11, 800 K). Details about these interesting stars can be found in the recent review paper of Fontaine & Brassard (2008; see, in particular, their Figure 1).
The Kepler survey has revealed the presence of low-amplitude, multiperiodic luminosity variations in SDSS J190817.07+394036.4,17 and this has generated intense interest within the KASC Working Group 11 (compact pulsators). Indeed, Kepler has produced a very high quality light curve showing peak-to-peak brightness variations of several mmag with periods in the range from ∼212 s to ∼953 s, an interval that is typical of those found, in particular, in V777 Her stars (pulsating He-atmosphere white dwarfs with Teff around 24,000 K) and ZZ Ceti variables. Spectroscopic classification observations obtained at the William Herschel Telescope (WHT) in 2009 April (see R. H. Østensen et al. 2011, in preparation) revealed a spectrum dominated by a series of relatively broad He i lines in absorption, suggesting that KIC 004547333 could be a pulsating white dwarf of the V777 Her type since the spectra of such stars are qualitatively similar in showing broad neutral helium lines. If this had been confirmed, KIC 004547333 would be the first pulsating white dwarf to be observed by Kepler, thus opening up a very interesting seismic potential for that star, particularly in future runs.
In a follow-up effort, we recently gathered a good-quality optical spectrum of KIC 004547333 suitable for quantitative analysis. We carried out detailed comparisons with appropriate grids of synthetic spectra, and we quickly came to the conclusion that KIC 004547333 is not a pulsating white dwarf. We report our findings in what follows, including a discussion on the true nature of KIC 004547333, the results of our modeling efforts, and a discussion on its variability.
2. THE NATURE OF KIC 004547333
The spectroscopic observations used in this work were carried out with the B&C spectrograph on the 2.3 m Bok Telescope at the Steward Observatory Kitt Peak Station. We initially obtained four nearly identical low resolution (∼9 Å) spectra of KIC 004547333 on 2010 May 2 and 3, two exposures at the end of each night. The combined spectrum has a total integration time of 5000 s, moderately high signal-to-noise ratio (S/N; ∼116 in the blue), and covers the wavelength range from 3650 Å out to 6850 Å. The spectra were shifted to the same wavelength prior to combining, although the shifts are not significant at the low resolution and modest S/N of the individual spectra. After a preliminary analysis was carried out on the basis of this combined spectrum, we were able to obtain two additional 1400 s spectra of KIC 004547333 on 01 July and 2010 August 12 and two 1800 s spectra of the fainter companion 5'' to the south (see below) using the same spectroscopic setup. The two most recent KIC 004547333 spectra are essentially indistinguishable from the May spectra, except for somewhat higher S/N. We provide an observing log for these data in Table 1. The following analysis is based on the total combined 7800 s spectrum which shows a S/N of ∼157 in the blue. Given that the luminosity variations are of low amplitudes and have periods less than 1000 s, our data can certainly be considered a meaningful time-averaged spectrum.
Table 1. Bok Telescope Spectroscopic Observations of KIC 004547333
| UT Date | UT Start Time | HJD−2450000 | Exposure | S/N | Air Mass |
|---|---|---|---|---|---|
| Time (s) | (blue) | ||||
| 2010 May 2 | 10:06:30.35 | 5318.929069 | 1250 | 52.6 | 1.072 |
| 2010 May 2 | 10:33:26.43 | 5318.947775 | 1250 | 53.5 | 1.041 |
| 2010 May 3 | 09:54:33.28 | 5319.920815 | 1250 | 63.8 | 1.083 |
| 2010 May 3 | 10:20:47.72 | 5319.939038 | 1250 | 61.7 | 1.050 |
| 2010 Jul 1 | 05:38:05.03 | 5378.745532 | 1400 | 69.6 | 1.123 |
| 2010 Aug 12 | 08:05:22.77 | 5420.847777 | 1400 | 78.6 | 1.266 |
Download table as: ASCIITypeset image
Figure 1 illustrates this flux-calibrated spectrum along with the values of the flux-converted magnitudes g = 16.08 and r = 16.30 obtained from the independent SDSS data source. These are the only two ugriz magnitudes of interest in this spectral range. The agreement is excellent. This spectrum of KIC 004547333 is clearly polluted by the Ca ii H and K lines as well as the Na i feature around 5890 Å. The presence of these ions is incompatible with the strength and shape of the He i lines, the only other features detected in our data. It is instead best explained in terms of interstellar absorption, consistent with the significantly reddened line of sight in the direction of the target.18 The helium features are indeed relatively broad, but they are too shallow in comparison with model spectra of He-atmosphere (DB) white dwarfs or of He-rich hot subdwarfs. Indeed, we could not find any acceptable fit using the extensive grids of synthetic spectra for DB white dwarfs or hot B subdwarfs computed in Montréal (see, e.g., Dufour et al. 2010 and Van Grootel et al. 2010), and we conclude that the light from KIC 004547333 is not predominantly emitted from a stellar photosphere.
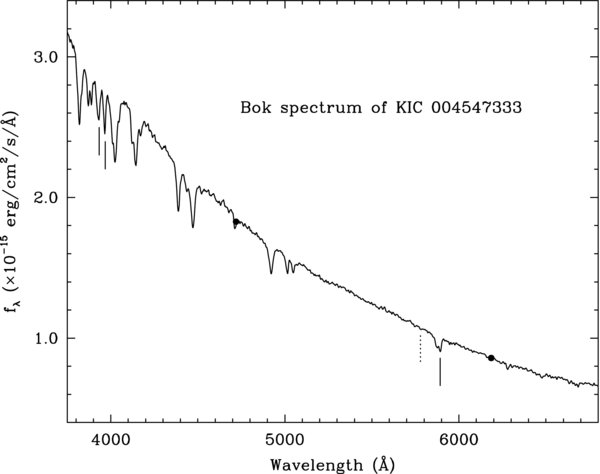
Figure 1. Flux-calibrated combined Bok spectrum of KIC 004547333. The two filled circles correspond to the flux-converted SDSS magnitudes g and r. The short vertical line segments indicate the location of three interstellar absorption lines: Ca ii K at 3934 Å (blended with He i 3926+3935), Ca ii H at 3968 Å (blended with He i 3965), and Na i at 5890 Å (partly blended with He i 5876). The dotted line segment suggests the possible presence of a weak DIB at 5780 Å.
Download figure:
Standard image High-resolution imageWe show the portion of our spectrum deemed most suitable for quantitative comparisons with models in Figures 2 and 3 (the red curves). This is now the normalized version which, in fact, is the one used in detailed comparisons with model spectra where only the line profiles, not the energy distribution, are fit. This is the standard spectroscopic approach which has the advantage of being independent of reddening (affecting the energy distribution) and of minor flux calibration errors. In particular, interstellar reddening is not negligible in the present case as already indicated above.

Figure 2. Comparison of the normalized optical spectrum of KIC 004547333 (red curves) with four normalized synthetic spectra (black curves) of pure helium white dwarf atmospheres defined by log g = 7.0 and Teff = 12,450 K (DB 1), 18,000 K (DB 2), 26,000 K (DB 3), and 35,270 K (DB 4). The locations of three interstellar absorption lines are indicated at the bottom of the plot.
Download figure:
Standard image High-resolution image
Figure 3. Comparison of the normalized optical spectrum of KIC 004547333 (red curves) with several normalized NLTE synthetic spectra (black curves) of pure He accretion disks. The parameters of these models are listed in Table 2. The solid (dotted) curves refer to models AD 1 (AD 2), AD 3 (AD 4), AD 5 (AD 6), and AD 7 (AD 8). The locations of three interstellar absorption lines are indicated at the bottom of the plot.
Download figure:
Standard image High-resolution imageWe show examples of DB model spectra in Figure 2, covering the range of effective temperatures where those stars are found. The two most extreme models (the one with Teff = 12,450 K and the other with Teff = 35,270 K) have been selected in the following way. First, assuming that there is no reddening (admittedly a poor assumption here), we fit the energy distribution of KIC 004547333 provided by the five ugriz magnitudes available with DB models of constant surface gravity log g = 7.0 (the shape of the energy distribution depends very little on the gravity). The best fit of the energy distribution suggests an effective temperature of Teff = 12,450 K, but, as very clearly illustrated in Figure 2, the spectral features do not match very well.
Similarly, assuming this time that all the reddening along the line of sight to KIC 004547333 is between us and the target, we obtained a corrected, unreddened energy distribution given by u = 14.89, g = 15.20, r = 15.66, i = 16.06, and z = 16.36. This much bluer energy distribution is best fit with a model distribution with Teff = 35,270 K. However, as is even more evident than in the previous case, the spectral lines of the 35,270 K model (DB 4) in Figure 2 are very different from the observed ones. We also illustrated the theoretical spectra for DB models with intermediate temperatures, 18,000 K (DB 2) and 26,000 K (DB 3). It is obvious that the spectrum of KIC 004547333 is not that of a single DB white dwarf.
We considered the possibility that KIC 004547333 could be an unresolved binary star consisting of a DB+DB or DB+DC (continuum spectrum) system with a DB pulsating component, but the model composite spectra that we built could never match its observed spectrum. In essence, we could not reproduce satisfactorily the observed He i line profiles on the basis of stellar photospheres.
Finally, a search through the literature revealed that our spectrum of KIC 004547333 is practically a carbon copy of that of the AM CVn system V803 Cen in its high state obtained by O'Donoghue & Kilkenny (1989; please compare our Figure 2 with their Figure 2). In such a high state, the light of an AM CVn system comes from an optically thick helium accretion disk which outshines the two interacting stellar components. The spectrum of an accretion disk is characteristically different from that of a stellar photosphere. Hence, the true nature of KIC 004547333 is not an isolated pulsating DB white dwarf, but is an AM CVn system in its high state (at least on the four nights when we observed it) showing the reddened spectrum of its accretion disk. We further note in this respect that the maximally dereddened colors mentioned just above place KIC 004547333 in the top left corner of the left panel of Figure 1 shown in Rau et al. (2010), exactly where AM CVn-absorption line systems are expected to be found. The AM CVn stars are fascinating objects in their own right. Their properties have been nicely reviewed by Warner (1995a) and, more recently, by Nelemans (2005). They are evolved interacting binary systems consisting of white dwarf accretors with low-mass degenerate or semi-degenerate helium-transferring companion stars. The precise nature of the donor stars and the details of their origin are still unclear. In this regard, several formation scenarios are discussed in Nelemans et al. (2010). The AM CVn stars have very short orbital periods, ranging from about 325 s to about 3900 s (Roelofs et al. 2010). Their spectra are dominated by helium with some traces of metals (when observed at high enough resolution), but no hydrogen. This reflects the composition of the transferred material which forms an accretion disk around the white dwarf primary. When the mass transfer rate is relatively high (this is referred to as the high state), the accretion disk becomes massive, optically thick, and hot, and it completely outshines the stellar components. This produces a spectrum with helium lines in absorption, as is the case here for KIC 004547333.
Several examples of optical spectra of AM CVn systems in the high state can be found in the literature. For instance, Nasser et al. (2001) show optical spectra of CR Boo, HP Lib, and AM CVn, along with V803 Cen. A nice spectrum of AM CVn is also illustrated in Figure 9 of Nagel et al. (2004). All high-state AM CVn systems exhibit spectra dominated by neutral helium lines in absorption. In some cases, such as in AM CVn itself, a weak He ii 4686 line can be seen in emission. We find no evidence for such emission in our spectrum of KIC 004547333.
3. MODELING THE SPECTRUM OF KIC 004547333
In order to further exploit our spectroscopic observations, we computed several hundred NLTE synthetic spectra of idealized accretion disks appropriate for AM CVn systems. We used the public codes TLUSTY and SYNSPEC (Hubeny & Lanz 1995; Lanz & Hubeny 1995) which contain options for dealing with accretion disks along with the usual options for computing stellar spectra. These computer codes had previously been adapted to run in parallel on the cluster CALYS at Université de Montréal (see, e.g., Latour et al. 2010). We also used a code named DISKSYN written by one of us (I.H.) in the final step of integrating the specific intensities of several annuli making up the disk under a specific angle of inclination.
The basic physics describing the structure of an accretion disk and the numerical methods used to deal with it have been presented in a series of papers by Hubeny (1990), Hubeny & Hubeny (1997, 1998), and Hubeny et al. (2000, 2001) in a context other than AM CVn stars. However, the approach is basically the same (in fact, simpler, because there is no need to consider relativistic corrections) and we refer the reader to these publications for details. To our knowledge, accretion disk spectra specifically applied to AM CVn systems have been computed in the past by El-Khoury & Wickramasinghe (2000), and by Nasser (2001) and Nasser et al. (2001), the latter also using TLUSTY and SYNSPEC. More recently, the Tübingen group developed their own independent codes to compute NLTE accretion disk spectra, and they used them, among other applications, in two studies of AM CVn stars as reported in Nagel et al. (2004) and Nagel et al. (2009). The latter paper guided us in choosing appropriate values for the model parameters for this type of star.
The parameters necessary to calculate the emergent flux of an accretion disk of the so-called α-type (Shakura & Sunyaev 1973) are (1) the mass M1 of the white dwarf accretor, (2) the accretion rate dM/dt onto the white dwarf, (3) the inclination angle i of the disk with respect to the line of sight, (4) the value of the inner radius of the disk Ri, (5) the value of the outer radius of the disk Ro, and (6) the chemical composition of the accreted matter. In the present case, since we only see neutral helium features in our low-resolution spectrum (except for interstellar lines), we simply considered the case of pure helium.
For the other parameters involved in our exploratory calculations, we specifically considered two values of the mass of the primary, M1 = 1.1 and 0.8 M☉, which sample the known range (see, e.g., Roelofs et al. 2007). We also picked several values of the accretion rate in the range 2 × 10⁻⁹ to 9 × 10⁻⁹ M☉ yr−1, and several values of the inclination angle in the range 0.20 ⩽ cos i ⩽ 0.98 (78 46 ⩾ i ⩾ 1148). The value Ri = 1.4 R1, where R1 is the radius of the primary, was chosen to mimic the presence of a boundary layer between the disk and the white dwarf surface. This is discussed in Nasser (2001) and we did not vary that parameter. Finally, we considered six values for the outer radius of the disk, Ro/R1 = 9.5, 11, 13, 15, 17, and 19. It is usually assumed (see, e.g., Warner 1995b) that the size of the disk corresponds to the so-called tidal radius, which depends on the orbital period, the mass of the primary, and the mass ratio q = M2/M1.
Table 2 lists the parameters of a few representative accretion disk spectra that we computed. For a given primary mass, the radius has been taken from an appropriate evolutionary sequence of a C/O-core, helium-envelope white dwarf with an effective temperature of about 20,000 K (details on these evolutionary models are described in Fontaine et al. 2001). In the last column of the table, we also indicated the value of the ratio of the tidal radius to the radius of the primary assuming a typical mass ratio of q = 0.1 and an orbital period of 953.3 s (see below). We plotted the normalized versions of these spectra in Figure 3, to be compared with our observed spectrum of KIC 004547333. By picking the right combination of parameters, and contrary to the case of our DB spectra above, a very good qualitative match can be obtained between observations and theory. In particular, it is clear that the accretion disk of KIC 004547333 must be seen under a low inclination angle in order to account for the line shape.
Table 2. Parameters of Accretion Disk Models
| Model | M1 | R1 | dM/dt | cos i | Ri/R1 | Ro/R1 | Rt/R1 |
|---|---|---|---|---|---|---|---|
| (M☉) | (108 cm) | (10−9M☉ yr−1) | (q = 0.1) | ||||
| AD 1 | 1.1 | 4.69 | 9.0 | 0.98 | 1.4 | 15.0 | 17.6 |
| AD 2 | 1.1 | 4.69 | 4.0 | 0.98 | 1.4 | 15.0 | 17.6 |
| AD 3 | 1.1 | 4.69 | 9.0 | 0.60 | 1.4 | 15.0 | 17.6 |
| AD 4 | 1.1 | 4.69 | 4.0 | 0.60 | 1.4 | 15.0 | 17.6 |
| AD 5 | 1.1 | 4.69 | 5.0 | 0.98 | 1.4 | 15.0 | 17.6 |
| AD 6 | 0.8 | 7.12 | 5.0 | 0.98 | 1.4 | 15.0 | 10.5 |
| AD 7 | 1.1 | 4.69 | 5.0 | 0.98 | 1.4 | 15.0 | 17.6 |
| AD 8 | 1.1 | 4.69 | 5.0 | 0.98 | 1.4 | 9.5 | 17.6 |
Download table as: ASCIITypeset image
To put this in a more quantitative context, we computed several fine grids of models in two-dimensional parameter space by considering several values of the accretion rate and inclination angle covering the ranges mentioned above. For each grid, the mass of the primary as well as the value of the outer radius were kept fixed. For example, Figure 4 illustrates our best fit for the case M1 = 1.1 M☉ and Ro/R1 = 15.0, obtained using a χ2 minimization scheme in two-dimensional space. Although this fit is far from perfect, it explains most of the observed absorption features rather well. We find it extremely encouraging to have been able to reproduce the essential features of the observed spectrum on the basis of our exploratory calculations. Apart from the three polluting interstellar lines (indicated in the plot), the most conspicuous defects are that the He i 4144 Å complex and the one near 5030 Å are predicted significantly weaker than observed. Interestingly, the same shortcomings are clearly present in the best fit of the spectrum of AM CVn itself presented by Nagel et al. (2004) (see their Figure 11) even though their codes are totally independent of those we used here. The origin of this small mystery remains unknown.
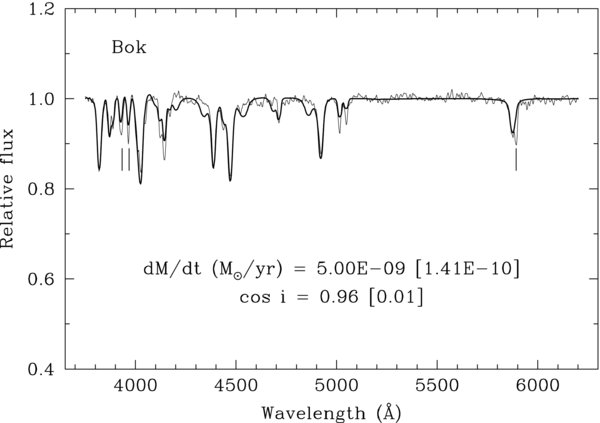
Figure 4. Model fit (heavy curve) to all the helium lines (thin curve) available in the moderately high S/N, low-resolution optical spectrum of KIC 004547333 obtained at the Bok Telescope. The fit was done using a two-dimensional grid of NLTE synthetic disk spectra (dM/dt, cos i) with an assumed accretor mass of M1 = 1.1M☉ and a disk radius of Ro = 15R1. The locations of the polluting lines of Ca ii (H and K) and of Na i due to interstellar absorption are indicated.
Download figure:
Standard image High-resolution imageFor curiosity, we also fitted the much noisier classification spectrum of KIC 004547333 gathered at the WHT as alluded to above. This is a 4.5 Å resolution blue spectrum covering a shorter spectral range than the Bok spectrum. Figure 5 illustrates our results in a case similar to that depicted in Figure 4 where the mass of the accretor has been fixed at M1 = 1.1 M☉ and the outer radius of the disk at Ro/R1 = 15.0. Of course, our model spectra have been computed with the appropriate resolution in these experiments with the WHT data. The fact that the values of the accretion rate and of the inclination angle reported in Figure 5 are consistent with those shown in Figure 4 is worth pointing out and, again, is most encouraging. The formal uncertainty on the inferred value of dM/dt is significantly larger in the case of the WHT spectrum, which should not be a surprise, but cos i appears to be pinned down with a similar formal uncertainty in both cases. This indicates that the line profiles are particularly sensitive to a variation of the inclination angle.
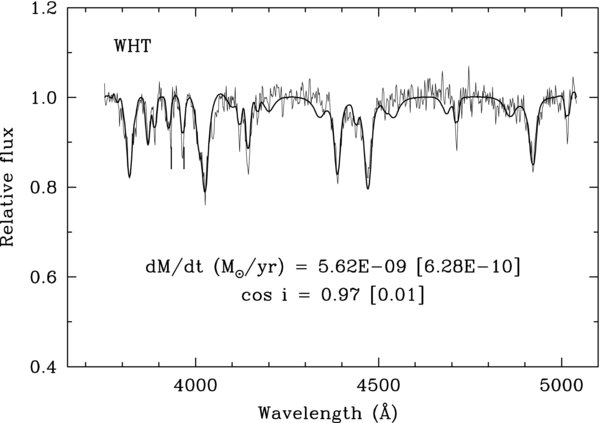
Figure 5. Same as Figure 3, but using the low-S/N classification spectrum obtained at the William Herschel Telescope.
Download figure:
Standard image High-resolution imageQualitatively similar good fits to the Bok spectrum, comparable to the one illustrated in Figure 4, were found using other grids with different values of Ro, given M1. However, in all cases, the inferred inclination angle was found to lie in the relatively narrow range 10°–20°, thus indicating that the accretion disk of KIC 004547333 is seen under a low inclination angle. This is a firm result based on the fact that the inclination angle dominates the line shape. On the other hand, and this is clearly seen in Figure 3, the line strength depends on both the accretion rate and the value of the outer radius of the accretion disk for a given accretor mass. In a first approximation one could therefore obtain a similarly good fit to an observed line by, say, simultaneously increasing both the accretion rate and the disk size in the appropriate proportions. We note, in this context, that there is a saturation point beyond which adding more rings (which are cooler) will no longer significantly change the predicted line strength. In the case of the M1 = 1.1 M☉ models discussed here, the best fit is obtained for an accretion rate of about 8.1 × 10⁻⁹ M☉ yr−1 if a value of Ro = 19 R1 is assumed.
Fits comparable in quality to the one illustrated in Figure 4 are also obtained from our M1 = 0.8M☉ models, but they correspond to smaller disks, in agreement with expectations (see, e.g., Nagel et al. 2009). For example, we can rule out disks extending out to 15 R1 in that case as the predicted lines are consistently too strong compared to the observations (see Figure 3 again). In fact, assuming that the outer radius of the disk is strictly equal to the tidal radius (Warner 1995b), the maximum possible disk size for a 0.8 M☉ white dwarf accretor in the limiting case of q = 0.0 would be equal to about 11.3 R1 for an orbital period of 953.3 s (see below). For a fixed value of Ro = 9.5R1, we find a good match to our observed spectrum for dM/dt = 8.22 ± 0.55 × 10⁻⁹M☉ yr−1 and cos i = 0.94 ± 0.01.
Our exploratory calculations with NLTE model spectra of accretion disks have demonstrated that the observed spectrum of KIC 004547333 can be explained well both qualitatively and quantitatively, but that there are also degeneracies in the best-fit solutions in the sense that the effects of changing a parameter (the accretion rate, for example) can be compensated by the effects of changing another (such as the disk size in this instance). We are looking forward to revisiting this question in more detail when constraints on the mass of the primary, the mass fraction, and the orbital period become available from more detailed follow-up spectroscopic observations.
In the meantime, we can further exploit our best-fitting spectral models to obtain preliminary estimates of the distance between the Earth and KIC 004547333, as well as the magnitude of insterstellar absorption between the two objects. The first step is to determine interstellar reddening by comparing the color indices constructed from the observed SDSS energy distribution with those obtained theoretically by convolving the synthetic spectra with the ugriz bandpasses. In the present case, this can be done only for the g and r colors because our model spectra do not extend far enough into the blue to cover the u bandpass, and the same is true in the red for the i and z colors. Nevertheless, we do have the (g − r) color index to work with. The measured value for this color index is (g − r) = −0.220 (± 0.014), which leads to a reddening index of E(g − r) = 0.265 when use is made of the theoretical color index (g − r)t = −0.485 associated with the best-fitting model spectrum shown in Figure 4. This value of the reddening index implies an absorption coefficient in the r band of Ar = 0.70, in good agreement with the value of Ar = 0.64 suggested from the maps of Schlegel et al. (1998). The dereddened magnitudes of KIC 004547333 are then g0 = 15.11 and r0 = 15.60, corresponding to values of the bandpass-integrated flux that should have been received at the Earth in the absence of reddening given by  erg cm−2 s−1 and
  erg cm−2 s−1, respectively. Since the output of our disk model spectra is the monochromatic luminosity (given that the size and the orientation of the disk are known quantities for a model), we can easily compute the integrated luminosity in various bandpasses. For example, for the best-fitting model referred to in Figure 4, the integrated luminosity in the g band is Lg = 2.588 × 10¹⁷ erg s−1, leading to an estimate of the distance of d = 257 pc according to the following equation:
Table 3 summarizes our results concerning the reddening and the distance for the three models that we have discussed in this section and that give comparable quality of fits to the observed spectrum of the accretion disk of KIC 004547333. When improved constraints on the characteristics of the system become available, we should be better able to pin down these parameters. In the meantime, the numbers given in Table 3 provide rough estimates of the uncertainties. Hence, the reddening index E(g − r) is found in the range 0.26–0.29, the absorption coefficient Ar is found in the range 0.70–0.76, and the distance is found in the range 250–330 pc. The latter is rather representative of known AM CVn systems if we refer to the work of Roelofs et al. (2007).
Table 3. Inferred Parameters from Some of the Best-fitting Models Using the Bok Spectrum
| M1 | Ro/R1 | dM/dt | cos i | E(g − r) | Ar | g0 | r0 | d |
|---|---|---|---|---|---|---|---|---|
| (M☉) | (10−9M☉ yr−1) | (pc) | ||||||
| 1.1 | 15 | 5.00 | 0.96 | 0.265 | 0.702 | 15.113 | 15.598 | 257 |
| 1.1 | 19 | 8.12 | 0.96 | 0.263 | 0.697 | 15.120 | 15.603 | 318 |
| 0.8 | 9.5 | 8.22 | 0.94 | 0.287 | 0.760 | 15.033 | 15.540 | 329 |
Download table as: ASCIITypeset image
We end this section by pointing out that it remains difficult if not impossible to match in perfect detail the observed line profiles of AM CVn systems with the current generation of accretion disk models because the latter are highly idealized descriptions of very complex physical environments. For instance, from the work of Nelemans et al. (2001) and Roelofs et al. (2006), we know that there are time-dependent emission components within the absorption lines that affect the line shapes. These emission components are believed to be due to the presence of an optically thin chromosphere or inversion layer higher up in the disk atmosphere, a phenomenon not considered in current disk models. Improvements along these lines will be needed for better quantitative matches between observed and synthetic spectra, but, fortunately, they are not expected to lead to drastic revisions of derived estimates of basic parameters such as accretion rate, disk size, mass of the accretor, and inclination angle.
4. THE LUMINOSITY VARIATIONS OF KIC 004547333
Interest in KIC 004547333 stems from the Kepler discovery of multiperiodic luminosity variations. Although not necessarily obvious after a first cursory examination, these variations also bear the signature of the AM CVn nature of the object. The AM CVn stars are known to exhibit luminosity variations in a huge interval of timescales. These variations can be quite complex and are associated with changes in the mass transfer rate (outbursts) on long timescales, and, over a very wide frequency range, with the mass transfer process itself (flickering). In addition, at intermediate frequencies, the luminosity variations reflect primarily orbital timescales.
The sampling time of 58.85 s in the Kepler survey is too long to have revealed the low-amplitude, high-frequency part of incoherent flickering photometric activity in KIC 004547333. Also, no large change in the mean brightness of the target over periods of hours, days, or weeks was recorded during the run that lasted some 26 days, although some feeble photometric activity on these scales is suggested by the data (see below). Some AM CVn systems, including the prototype itself, are stuck in a state of high mass transfer rate and do not show phases of outbursting which may lead to brightness variations of several magnitudes. This is expected for systems with orbital periods shorter than ∼1200 s. Below this limit the mass transfer rate, driven by the loss of angular momentum due to gravitational wave radiation, is relatively important (Nelemans 2005). Given that the orbital period of the KIC 004547333 system is very likely less than 1000 s (see below), it is highly probable that the system is another member of the high-state class. We note, in this context, that the optical spectrum of KIC 004547333 does not seem to have changed significantly over a period of more than three months.
The third type of luminosity variation usually present in all high-state and outbursting AM CVn stars is related to coherent or semi-coherent variations such as those picked up by Kepler on KIC 004547333. These brightness modulations have periods ranging from a few hundred to about two thousand seconds, depending on the system. In the specific case of KIC 004547333, we uncovered low-amplitude (a few mmag and less) variations with periods ranging from 212 s to 953 s. Such modulations are believed to be due to orbital motion, disk ellipticity, and disk precession (see, e.g., Skillman et al. 1999).
Table 4 summarizes the results of the frequency extraction exercise that we carried out with the Kepler light curve of KIC 004547333. This was done by several of us and with various methods, all leading to a similar outcome. We report here the results obtained with the code FELIX developed by one of us (S.C., and see Charpinet et al. 2010 for more details, including error estimates). A total of 11 periodicities with amplitudes well above a conservative limit of 4.3 times the mean local noise were identified in the Kepler bandpass. It is certain that there must be other periodicities in the light curve, but higher sensitivity observations (hopefully to be done during future longer runs with Kepler) must be obtained in order to be fully confident in their existence. For instance, we found another 15 potential periodicities with amplitudes anywhere from 3.2 to 4.3 times the mean local noise. The phase listed in Table 4 is defined with respect to the beginning of the run.
Table 4. Periodicities Detected in the Kepler Light Curve of KIC 004547333
| ID | Frequency | σF | Period | σP | Amplitude | σA | Phase | σPh | S/N |
|---|---|---|---|---|---|---|---|---|---|
| (μHz) | (μHz) | (s) | (s) | (%) | (%) | (s) | (s) | ||
| f01 | 1049.0300 | 0.0171 | 953.262 | 0.016 | 0.0922 | 0.0064 | 633.9 | 19.6 | 14.4 |
| f02 | 1065.5226 | 0.0282 | 938.507 | 0.025 | 0.0556 | 0.0064 | 792.8 | 31.9 | 8.7 |
| f03 | 1296.0307 | 0.0234 | 771.587 | 0.014 | 0.0615 | 0.0059 | 524.0 | 23.7 | 10.5 |
| f04 | 1867.6832 | 0.0464 | 535.423 | 0.013 | 0.0308 | 0.0058 | 166.6 | 32.9 | 5.3 |
| f05 | 2114.6644 | 0.0413 | 472.888 | 0.009 | 0.0365 | 0.0061 | 168.2 | 24.5 | 5.9 |
| f06 | 2131.1326 | 0.0047 | 469.234 | 0.001 | 0.3118 | 0.0060 | 91.9 | 2.8 | 51.9 |
| f07 | 2345.1008 | 0.0275 | 426.421 | 0.005 | 0.0732 | 0.0082 | 197.2 | 11.0 | 8.9 |
| f08 | 3427.1859 | 0.0303 | 291.785 | 0.003 | 0.0488 | 0.0060 | 102.7 | 11.3 | 8.1 |
| f09 | 3641.1147 | 0.0351 | 274.641 | 0.003 | 0.0393 | 0.0056 | 2.0 | 13.2 | 7.0 |
| f10 | 4492.8565 | 0.0501 | 222.576 | 0.002 | 0.0286 | 0.0058 | 129.2 | 14.7 | 4.9 |
| f11 | 4723.2438 | 0.0428 | 211.719 | 0.002 | 0.0310 | 0.0054 | 151.8 | 12.9 | 5.7 |
Download table as: ASCIITypeset image
We show the Fourier amplitude transform of the light curve in Figure 6. The 11 signals we retained in our Table 4 clearly stand out in the figure. At the same time, we notice a weak broad structure centered around 2.4–2.5 mHz in the Fourier transform which may be real and which very closely resembles a similar structure found by Patterson et al. (2002; see their Figure 1) in the light curve of HP Lib, another high-state AM CVn system. These authors refer to such a structure as a "QPO," meaning a quasi-periodic oscillation. The quasi periodicity of that brightness variation in HP Lib explains the broadening observed in Fourier space, but the exact nature of the QPO remains elusive. We show a zoomed-in view of the possible QPO region in Fourier space in Figure 7. The resemblance with the QPO described in Patterson et al. (2002) is rather striking. Hence, Kepler may have uncovered a similar QPO in KIC 004547333.
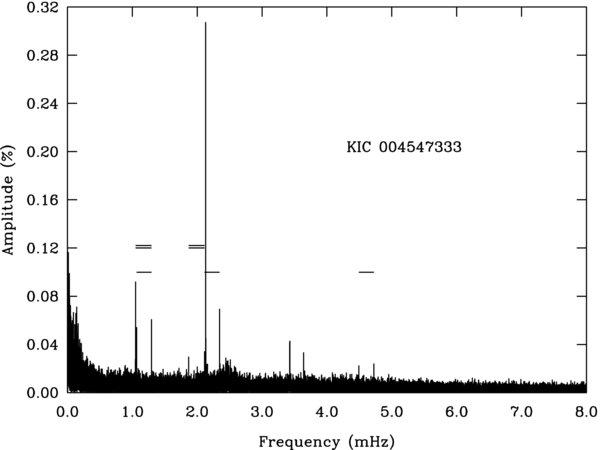
Figure 6. Fourier amplitude spectrum of the full Kepler light curve of KIC 004547333. The amplitude is expressed in percentage units of the mean brightness of the star in the Kepler bandpass. The 11 periodicities retained in our Table 4 clearly stand out in the figure. Single and double horizontal line segments indicate two kinds of common spacings in this frequency spectrum.
Download figure:
Standard image High-resolution image
Figure 7. Zoomed-in view of the Fourier amplitude spectrum centered on the QPO region. This was obtained after pre-whitening of the five previously identified periodicities in that bandpass (f04 through f08). The lower (upper) dotted line indicates an amplitude value equal to three (four) times the mean noise level in the 1.5–3.5 mHz bandpass after pre-whitening.
Download figure:
Standard image High-resolution imageAnother intriguing feature of the Kepler light curve of KIC 004547333 is the fact that the "noise" increases significantly below a frequency of about 0.25 mHz in its Fourier transform, as can be seen in Figure 6. This is unlike what is usually found in other targets including, for example, KIC 008302197. The latter is a long-period pulsating hot subdwarf B star of comparable magnitude to KIC 004547333 (Kepler magnitude of 16.432 versus 16.316) and was observed during the same period of time (run Q3.3). We compare the low-frequency part of the Fourier transforms of their Kepler light curves in Figure 8. As can be seen, contrary to the Fourier transform of KIC 004547333, that of the light curve of KIC 008302197 exhibits a noise level that remains low and uniform down across this frequency range (notwithstanding the presence of real peaks, of course). Hence, there seems to be some low-frequency activity in the light curve of our target. In fact, a cursory look at the short segment shown in Figure 9 readily suggests possible variations over timescales of hours. We believe that this low-amplitude "rumbling" bears the signature of low-frequency aperiodic activity associated with accretion. Indeed, the ramping up of the "noise" seen in the Fourier transform at low frequencies is most likely due to an aperiodic power-law distribution of flickering and flaring events believed to occur in accreting systems.

Figure 8. Comparison of the low-frequency (0.0–1.0 mHz bandpass) behavior of the Fourier amplitude transform of the Kepler light curve of KIC 004547333 (upper part of the plot) with that of KIC 008302197 (lower part), a long-period pulsating hot B subdwarf of comparable magnitude and observed during the same season.
Download figure:
Standard image High-resolution image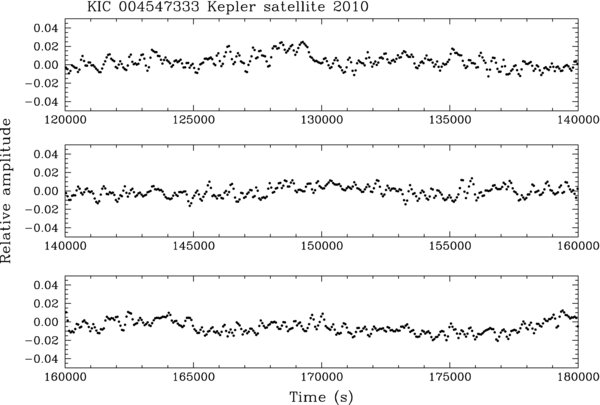
Figure 9. Typical segment of the Kepler light curve of KIC 004547333 covering 2.67% of the total length (623.75 hr). It is expressed in units of fractional brightness intensity and seconds. Some peculiar variations on timescales of hours can be seen. They are likely due to aperiodic flaring events associated with accretion.
Download figure:
Standard image High-resolution imageWhile we find this other manifestation of the AM CVn nature of KIC 004547333 to be particularly interesting, we warn that some of these long-period quasi-modulations may not be entirely intrinsic to the system because the Kepler contamination factor for KIC 004547333 is estimated to be rather high at 0.742. There is indeed a second star, somewhat fainter in the optical domain than KIC 004547333, that is only 5'' away in the field. Caution is advised because the Kepler pixel scale is 4'' and because each photometry target is a sum of many pixels due to the special design of the Kepler optics to accommodate its large FOV. We point out in this context that we have used the Kepler light curve formally corrected for this contamination in our frequency extraction analysis. Except for the values of the amplitudes (which are reduced by a factor of about 1.3), the results are equivalent to those reported in Table 4 when repeating this exercise with the raw light curve. The frequencies are unchanged, but the reader should be aware of potential uncertainties in the values of the amplitudes. We further examine this question of possible contamination in the Appendix where we report on some interesting follow-up observations taken from the ground.
Otherwise, the light curve of this target is dominated by a modulation—identified as f06 in Table 4—with a period of 469.234 s and an amplitude of about 0.31% (∼3.4 mmag) of the mean brightness of the star in the Kepler bandpass. This makes KIC 004547333 a low-amplitude photometric variable by AM CVn standards. That periodicity may be interpreted as the first harmonic of another variation (f02) with a period of 938.507 s and a significantly lower amplitude of 0.056 % (∼0.6 mmag).19 Photometric variations of this kind observed in other AM CVn systems tend to be dominated by a series of harmonic peaks related to the so-called superhump variation. In the standard picture (see, e.g., Patterson et al. 1993), we can hence interpret the f02 modulation as the superhump frequency, given a very short series (two terms) of harmonically related modulations. The shortness of this series could possibly be explained by the relatively low amplitudes involved. If confirmed, the orbital period of the KIC 004547333 system would very likely be equal to 953.262 s (f01), and the 938.507 s (f02) variation would correspond to a "negative" superhump, i.e., with a period less than the orbital period. Given those two periodicities, the true physical clocks involved would be a retrograde disk precession period of about 16.84 hr (corresponding to the frequency difference f02 − f01) along with the orbital motion. Note that we do not see direct evidence for a 16.84 hr periodicity (or its harmonics) in the Fourier domain.
One way to distinguish orbital variations from superhump variations is to verify the stability of the phase over long periods of time (Solheim et al. 1998). While the orbital phase should be strictly constant (at least over periods of time less than the timescale for period evolution), superhump periods are known to wander erratically at times. However, the excursion amplitudes are quite small, and some superhump periods have stayed unchanged for months at a time. In our specific case, we did check for phase stability by dividing the light curve into five equal segments and by measuring the amplitude and the phase of each oscillation for each curve segment. Unfortunately, the amplitudes of the periodicities found in the light curve of KIC 004547333 are so small that the uncertainties on the derived phases are too large for them to be generally useful. Only in the case of the dominant modulation f06 did we get some reasonable constraints, namely that the phase stayed constant over the 26 day-long run (5 measurements) to within about ±7 s as compared to the period of 469.234 s. However, this hardly provides much discriminatory power between orbital and superhump variations if we consider the low excursion amplitude of about 0.2 s for the superhump period of 1051.2 s described by Skillman et al. (1999) in their study of AM CVn itself.
Another diagnostic tool, useful for identifying AM CVn-type luminosity variations, is to study the pulse shape of the basic modulation, in the present case the presumed superhump variability with a period of 938.507 s. Given the quality of the Kepler light curve, we obtained a very well defined pulse shape as illustrated in Figure 10 after having folded the curve on that periodicity. This particular highly nonlinear shape is very reminiscent of the superhump pulse shape reported by Skillman et al. (1999) in their Figure 5 for AM CVn after taking into account the fact that the amplitude ratio f02/f06 is significantly higher in KIC 004547333 than its counterpart in AM CVn. In both cases, the minimum in the pulse shape near phase 1.0, where the basic modulation (f02 here) goes through maximum light, is created by the contribution of the higher-amplitude harmonic (f06 here) which is nearly in antiphase with its parent oscillation. This notion of pulse shape as a diagnostic tool in a white dwarf–AM CVn context was thoroughly discussed by Green et al. (2009).
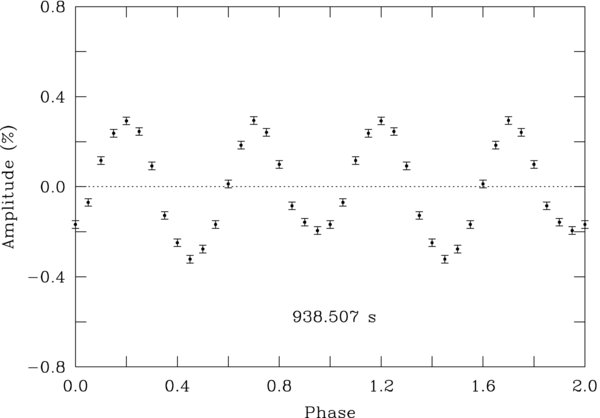
Figure 10. Light curve of KIC 004547333 folded on the period of 938.507 s and distributed in 20 phase bins, each containing 1908 points on average. The error bars about each point in the folded light curve correspond to the errors of the mean in each bin.
Download figure:
Standard image High-resolution imageA final comment about the frequency structure uncovered in the light curve of KIC 004547333 was inspired by the work of Skillman et al. (1999). These authors were able to explain all the modulations observed in AM CVn (some 20 of them) in terms of three basic frequencies only. Those basic frequencies are tied to three physical clocks: the orbital motion (period = 1028.7 s) and two kinds of disk precessions associated, respectively, with apsidal advance (period = 13.36 hr) and nodal regression (period = 16.69 hr). We investigated the possibility of perhaps achieving a similar result with the list of frequencies given in Table 4. We could not obtain a result similar to that of Skillman et al. (1999), i.e., deriving values of the orbital period and of two precession periods that are acceptable from a physical point of view, but we were nevertheless able to "explain" the 11 periodicities uncovered in KIC 004547333 in terms of only three "basic" modulations following the recipe of Skillman et al. (1999).
We first noted that there are two kinds of recurrent frequency spacings present in the Fourier transform. This is indicated in Figure 6 by the three single horizontal line segments defining a mean spacing of 230.467 ± 0.027 μHz (which we call N as in the notation of Skillman et al. 1999), and of two double horizontal line segments defining, this time, a mean frequency spacing of 246.997 ± 0.026 μHz. We call the difference between those two values Ω = 16.530 ± 0.037 μHz. Again, in keeping with the notation of Skillman et al. (1999), we pick our third basic "clock" as ω = 1065.523 ± 0.028 μHz, i.e., the f02 periodicity listed in Table 4. Using those three periodicities, and playing by the same rules as defined in Skillman et al. (1999) for obtaining combinations of them, we derive the results summarized in Table 5. To the measurement accuracy, we reproduce all 11 modulations in terms of combinations of only ω, Ω, and N. We find those results quite remarkable but unfortunately a physical interpretation currently eludes us. In the picture of Skillman et al. (1999), ω would correspond to the orbital frequency (period 938.507 s, which is different from the above interpretation), Ω to a disk precession frequency, but N would be a physical clock more difficult to justify at this stage. We leave that as a challenging puzzle to the reader.
Table 5. A Possible Three-Clock Model
| Combination | Combination Frequency | Observed Frequency | ID |
|---|---|---|---|
| (μHz) | (μHz) | ||
| ω − Ω | 1048.993 ± 0.047 | 1049.030 ± 0.017 | f01 |
| ω | 1065.523 ± 0.028 | 1065.523 ± 0.028 | f02 |
| ω + N | 1295.990 ± 0.039 | 1296.031 ± 0.023 | f03 |
| 2ω − 2Ω − N | 1867.518 ± 0.097 | 1867.683 ± 0.046 | f04 |
| 2ω − Ω | 2114.515 ± 0.067 | 2114.664 ± 0.041 | f05 |
| 2ω | 2131.045 ± 0.056 | 2131.133 ± 0.005 | f06 |
| 2ω − Ω + N | 2344.982 ± 0.073 | 2345.101 ± 0.027 | f07 |
| 3ω + N | 3427.035 ± 0.075 | 3427.186 ± 0.030 | f08 |
| 3ω − Ω + 2N | 3640.972 ± 0.107 | 3641.115 ± 0.035 | f09 |
| 4ω + N | 4492.557 ± 0.116 | 4492.857 ± 0.050 | f10 |
| 4ω + 2N | 4723.024 ± 0.119 | 4723.244 ± 0.043 | f11 |
Notes. The three basic periodicities are ω = 1065.523 μHz (period = 938.51 s), Ω = 16.530 μHz (period = 16.80 hr), and N = 230.467 μHz (period = 1.21 hr).
Download table as: ASCIITypeset image
5. CONCLUSION
The finding of multiperiodic luminosity variations by the Kepler satellite in the blue object SDSS J190817.07+394036.4 (KIC 004547333) has led to the discovery of a new AM CVn system. Originally selected by the KASC as a potential compact pulsator, it was initially hoped by many members of Working Group 11 that KIC 004547333 would turn out to be a pulsating He-atmosphere white dwarf of the V777 Her type. However, our follow-up spectroscopic measurements at the Bok Telescope have unambiguously revealed that the spectrum of KIC 004547333 is instead that of an AM CVn system in its high state, significantly reddened by interstellar absorption along the line of sight.
In order to further exploit our spectroscopic observations, we invested considerable efforts into building grids of NLTE synthetic spectra applicable to helium-dominated accretion disks of interest for AM CVn systems. We used these idealized models, in particular we assumed pure helium disks, to carry out a first exploration of parameter space. Assuming representative values for the mass of the white dwarf accretor in the system, we were able to reproduce the observed spectrum of KIC 004547333 quite satisfactorily, although the fits are not perfect by any means. Further progress on this front will require model improvements in the future. Also, the best-fit solutions are not unique in parameter space since there are degeneracies related to the effect of varying different parameters. Further progress on that front will require useful constraints on the mass of the accretor, the mass ratio, and the orbital period, all of which can be obtained from detailed follow-up spectroscopy. One firm result that is unlikely to change with future improvements, is that the accretion disk of KIC 004547333 is seen under a relatively well-constrained angle found in the range 10°–20°. The current mass transfer rate in the system is also estimated to be in the range 3.5–8.5 × 10⁻⁹M☉ yr−1. By comparing the measured energy distribution with those obtained from our model disk spectra, we further infer a reddening index E(g − r) = 0.26–0.29, an absorption coefficient Ar = 0.70–0.76, and a distance to the system in the range 250–330 pc.
Our detailed examination of the light curve of KIC 004547333 has revealed clear signatures of the AM CVn nature of the target. The luminosity variations are dominated by a basic periodicity (the 938.507 s variation along with its first harmonic) which, in the standard picture, is due to a superhump modulation. In that picture, the orbital motion would be associated with the f01 modulation having a period of 953.262 s. The light curve folded on the period of 938.507 s shows a pulse shape which is very similar to the 1051 s superhump waveform reported by Skillman et al. (1999) for AM CVn. In addition, a QPO may have been found in the light curve of KIC 004547333 analogously to what is seen in the Fourier spectra of some other high-state AM CVn systems. Kepler has also picked up some very low-frequency, low-amplitude photometric activity in the target, believed to be due to aperiodic flaring expected in accreting systems. We also uncovered some intriguing numerical relationships between the frequencies of the modulations detected in KIC 004547333, similar to what has been reported for the high-state systems AM CVn and HP Lib. Specifically, we are able to account for all the 11 detected periodicities in terms of combinations of only 3 basic frequencies: ω = 1065.523 μHz, Ω = 16.530 μHz, and N = 230.467 μHz. In this picture, the ω variation (period of 938.507 s) could correspond to the orbital period, the Ω modulation to a kind of disk precession, but the N component is currently left without an obvious physical explanation. Still, we find these relationships (as summarized in Table 5) to be extremely puzzling and worth further investigations. In particular, we suggest that time-resolved spectroscopy will be extremely useful in trying to understand the true physical interpretation of our proposed clocks because such clocks must leave their signatures in terms of radial velocities and line profile shape changes.
The discovery that KIC 004547333 is an AM CVn system is quite significant, because AM CVn systems are exceptional laboratories for testing binary stellar evolution theory. They correspond to the end-product of several evolutionary scenarios as described, for example, by Nelemans et al. (2001). They can contribute significantly to the Type Ia supernova production rate (Solheim & Yungelson 2005). They are also the strongest known sources that can be detected as gravitational-wave emitters with the future LISA experiment (Rau et al. 2010). Given that the photometric properties of AM CVn stars in general are not well understood and that they remain relatively rare, Kepler has a unique role to play on this front, and it is therefore hoped that KIC 004547333 will be given the status of long-term target. This will go a long way in elucidating the remaining mysteries surrounding AM CVn stars.
The authors gratefully acknowledge everyone who has contributed to make the Kepler Mission possible. Funding for the Kepler Mission is provided by NASA's Science Mission Directorate. We are also indebted to the Steward Observatory technical staff for its speedy and essential help with the Bok Telescope just prior to our first spectroscopic run, in particular.
This work was supported in part by the NSERC of Canada. G. Fontaine also acknowledges the contribution of the Canada Research Chair Program. S. Charpinet acknowledges support from the Programme National de Physique Stellaire (PNPS). P. Dufour is a CRAQ postdoctoral fellow. P. Bergeron is a Cottrell Scholar of Research for Science Advancement. V. Van Grootel acknowledges grant support from the Centre National d'Études Spatiales (CNES). The research of C. Aerts, R. Østensen, and S. Bloemen is based on funding from the European Research Council under the European Community's Seventh Framework Programme (FP7/2007–2013)/ERC grant agreement n°227224 (PROSPERITY). D.E. Winget and M.H. Montgomery gratefully acknowledge the support of the National Science Foundation under grant AST-0909107 and the Norman Hackerman Advanced Research Program under grants 003658-0255-2007 and 003658-0252-2009, and M.H. Montgomery further acknowledges the support of the Delaware Asteroseismic Research Center.
APPENDIX: FOLLOW-UP GROUND-BASED OBSERVATIONS
Given the presence of a somewhat fainter field star relatively close to the target in the FOV (about 5'' to the south), we thought that it would be worthwhile to investigate its nature since it is a potential contaminant. We first obtained two 1800 s spectra of that star during our 2010 August 12 run at the Bok Telescope using the exact same setup as that for KIC 004547333. Given its appearance, the combined spectrum was next cross-correlated with 27 standard main sequence star spectra spanning the range of spectral type from F0 to K7. The spectrum was found to best correlate with spectral type G0-G1. We are not aware of the existence of early G stars capable of producing the low-frequency aperiodic "rumbling" observed in the light curve of KIC 004547333.
We also obtained short light curves of both KIC 004547333 and the field star over two consecutive nights on UT 14 and 2010 September 15. We used the Mont4K CCD camera attached to the Steward Observatory 1.55 m Kuiper Telescope on Mount Bigelow near Tucson. The observations were taken on dark nights through a broadband Schott 8612 filter, and an effective exposure time of 62 s (on average) was used as a compromise between the signal-to-noise ratio and the need to adequately sample the luminosity variations uncovered by Kepler in KIC 004547333. The seeing was excellent on both nights, resulting in image FWHM's of 1 0 to 13, so that KIC 004547333 and the G star 5'' south were always completely resolved from each other.
Figure 11 shows the two nightly light curves that were obtained for the Kepler target (K) and the two corresponding ones for the field star (C). While luminosity variations are readily apparent in these ground-based light curves of KIC 004547333, no obvious repeating pattern is found in the light curves of the companion star. The relative faintness of that star explains the much larger scatter observed in the latter.
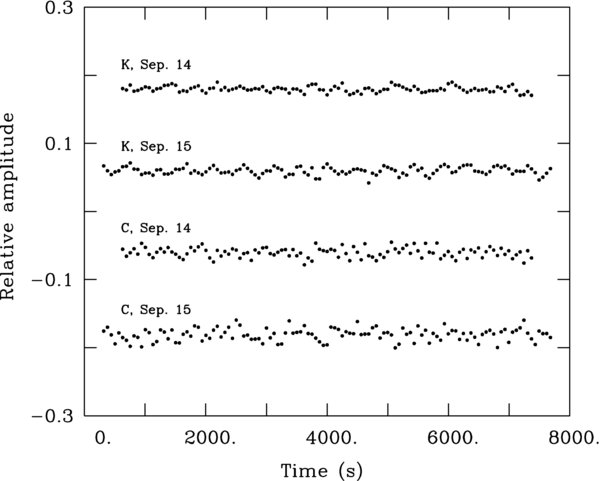
Figure 11. Broadband optical light curves obtained for KIC 004547333 (K) and the field star (C) 5'' to the south using the Mont4K CCD camera mounted on the Steward observatory 1.55 m Kuiper telescope. The data have been shifted arbitrarily along the x- and y-axes for visualization purposes. They are expressed in units of fractional brightness intensity and seconds. The average sampling time is 62 s.
Download figure:
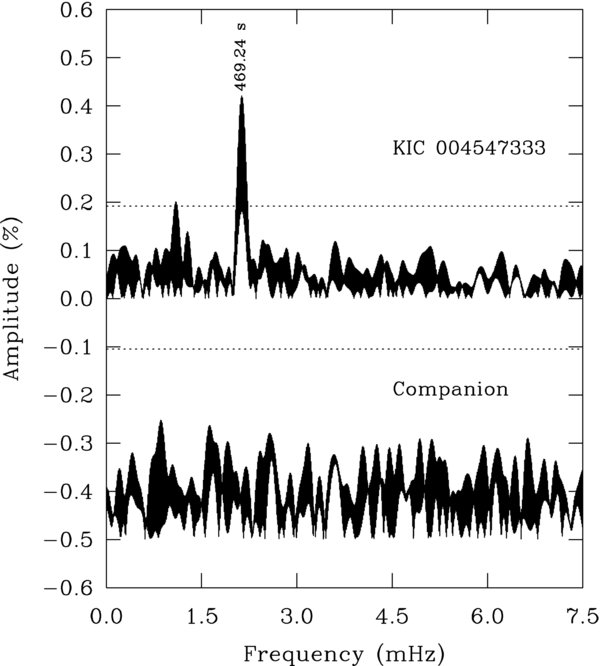
Standard image High-resolution imageThe Fourier amplitude spectrum of this short series of light curves for KIC 004547333 is illustrated in the top half of Figure 12. It is interesting to find out that, after only ∼4 hr of observing from the ground, the dominant periodicity at 469.24 s easily stands out in the Fourier spectrum. The derived period falls exactly on the Kepler value for f06 listed in Table 4. The second highest peak, f01, at 953 s also appears to have been detected, although just at the 4σ limit. In contrast, as can be seen in the lower half of Figure 12, we find no sign of possible luminosity variations in the field star in the frequency range illustrated, at least with detectable amplitudes. We conclude from this that the luminosity variations picked up by Kepler on all timescales are very likely intrinsic to KIC 004547333.
Figure 12. Fourier amplitude transform of the short Mont4K data set on KIC 00454733 (upper part of the figure) and on the companion field star (lower part), the latter being shifted vertically by 0.5% units for visualization purposes. The dotted horizontal lines correspond to four times the mean noise level in the 0–7.5 mHz bandpass in both cases.
Download figure:
Standard image High-resolution image
Footnotes
- 17
For brevity, in what follows, SDSS J190817.07+394036.4 will be referred to as KIC 004547333, its Kepler target name.
- 18
If most of the absorption is between the Earth and the target, then a diffuse interstellar band (DIB) of strength ∼100 mÅ would be expected at 5780 Å according to the relations given in Welty et al. (2006). Unfortunately, our spectrum is not of high enough sensitivity to reveal such a weak feature, although there might be a hint of it in Figure 1.
- 19
This is similar to what is observed in the prototype AM CVn where the first harmonic of the basic periodicity dominates the light variations.