


ABSTRACT
We create a baseline of the black hole (BH) mass ( )—stellar-velocity dispersion (σ) relation for active galaxies, using a sample of 66 local (
 ) Seyfert-1 galaxies, selected from the Sloan Digital Sky Survey (SDSS). Analysis of SDSS images yields AGN luminosities free of host-galaxy contamination, and morphological classification. 51/66 galaxies have spiral morphology. Out of these, 28 bulges have Sérsic index
  and are considered candidate pseudo-bulges, with eight being definite pseudo-bulges based on multiple classification criteria met. Only 4/66 galaxies show signs of interaction/merging. High signal-to-noise ratio Keck spectra provide the width of the broad Hβ emission line free of Fe ii emission and stellar absorption. AGN luminosity and Hβ line widths are used to estimate
  . The Keck-based spatially resolved kinematics is used to determine stellar-velocity dispersion within the spheroid effective radius (
 ). We find that σ can vary on average by up to 40% across definitions commonly used in the literature, emphasizing the importance of using self-consistent definitions in comparisons and evolutionary studies. The
  –σ relation for our Seyfert-1 galaxy sample has the same intercept and scatter as that of reverberation-mapped AGNs as well as that of quiescent galaxies, consistent with the hypothesis that our single epoch
  estimator and sample selection function do not introduce significant biases. Barred galaxies, merging galaxies, and those hosting pseudo-bulges do not represent outliers in the
  –σ relation. This is in contrast with previous work, although no firm conclusion can be drawn on this matter due to the small sample size and limited resolution of the SDSS images.
Export citation and abstract BibTeX RIS
1. INTRODUCTION
The discovery of relations between the mass of the central supermassive black hole (BH) and its host galaxy properties such as spheroid luminosity  (Kormendy & Richstone 1995), spheroid mass
  (e.g., Magorrian et al. 1998), and spheroid stellar velocity dispersion σ (e.g., Ferrarese & Merritt 2000; Gebhardt et al. 2000) has sparked a flood of observational studies pertaining both to the local universe (e.g., Merritt & Ferrarese 2001; Tremaine et al. 2002; Marconi & Hunt 2003; Häring & Rix 2004; Ferrarese & Ford 2005; Greene & Ho 2006; Graham 2007; Gültekin et al. 2009; Bennert et al. 2011a; Graham et al. 2011; Kormendy & Bender 2011; Kormendy et al. 2011; McConnell et al. 2011; Sani et al. 2011; Beifiori et al. 2012; Graham & Scott 2013) and cosmic history (e.g., Treu et al. 2004, 2007; Peng et al. 2006a, 2006b; Woo et al. 2006, 2008; Salviander et al. 2007; Jahnke et al. 2009; Riechers et al. 2009; Bennert et al. 2010, 2011b; Decarli et al. 2010; Merloni et al. 2010); for a recent review see Kormendy & Ho (2013). In particular the evolution with redshift of these correlations constrains theoretical interpretations and provides important insights into their origin (e.g., Croton 2006; Robertson et al. 2006; Hopkins et al. 2007), by probing whether BHs and their host galaxies are constantly on tight correlations through a feedback mechanism that controls their mutual growth (e.g., Kauffmann & Haehnelt 2000; Volonteri et al. 2003; Ciotti & Ostriker 2007; Hopkins et al. 2008), or whether the local relations are an end product of the more dramatic and stochastic process of galaxy merging in the hierarchical assembly of
 and stellar mass (e.g., Peng 2007; Jahnke & Maccio 2011).
Measuring  based on spatially resolving the BH's gravitational sphere of influence via stellar kinematics (e.g., van der Marel et al. 1998; Gebhardt et al. 2000), gaseous kinematics (e.g., Ferrarese et al. 1996; Marconi et al. 2001) or maser emission (e.g., Herrnstein et al. 2005; Kuo et al. 2011) is restricted to galaxies in the local universe. The only way to probe the evolution of the scaling relations is to rely on active galaxies, thought to represent an integral phase in the evolution of galaxies during which the BH is growing through accretion, resulting in the luminous galaxy center known as active galactic nucleus (AGN). For AGNs at cosmological distances,
  is estimated through application of the "virial method" (e.g., Wandel et al. 1999). In this method, it is assumed that gas clouds in the broad-line region (BLR) orbiting the BH in close proximity follow the gravitational field of the BH. In a time-consuming process called reverberation mapping (e.g., Wandel et al. 1999; Kaspi et al. 2000, 2005; Bentz et al. 2006, 2013), the delayed response of broad emission lines to changes in the AGN continuum is translated into a size of the BLR. When combined with the width of the broad emission lines (i.e., velocity of the gas clouds), the mass of the BH can be estimated, making use of the "virial coefficient" that depends on the gas kinematics and geometry. Assuming that broad-line AGNs and quiescent galaxies follow the same
  –σ relation (as probed in several studies, e.g., Woo et al. 2013 and references therein), this coefficient has been traditionally obtained by matching their
  –σ relations (e.g., Onken et al. 2004; Greene & Ho 2006; Woo et al. 2010, 2013, 2015; Park et al. 2012). More recently, by modeling reverberation-mapped data directly and constraining geometry and kinematics of the BLR,
  has been estimated for individual objects independent of a virial coefficient (Brewer et al. 2011; Pancoast et al. 2011, 2012, 2014). A secondary method called the "single-epoch method" makes use of an empirical correlation found from reverberation mapping that directly relates the BLR size to the AGN continuum luminosity, to allow the estimation of
  from a single spectrum (Vestergaard 2002; Woo & Urry 2002; Vestergaard & Peterson 2006; McGill et al. 2008).
While the majority of evolutionary studies point toward a scenario in which BH growth precedes spheroid assembly (e.g., Treu et al. 2004, 2007; Walter et al. 2004; McLure et al. 2006; Shields et al. 2006; Woo et al. 2006, 2008; Peng et al. 2006a, 2006b; Salviander et al. 2007; Weiss et al. 2007; Riechers et al. 2008, 2009; Gu et al. 2009; Jahnke et al. 2009; Decarli et al. 2010; Merloni et al. 2010; Bennert et al. 2010), no consensus has been reached on the interpretation of the evolutionary studies (see e.g., Volonteri & Stark 2011; Schramm & Silverman 2013; Schulze & Wisotzki 2014, especially concerning the role of scatter, observational bias, and selection effects) and, ultimately, the origin of the  scaling relations. A key toward understanding the
  scaling relations may lie in understanding the local relations for active galaxies and systematic effects in the analysis. First, all conclusions about evolution of these relations hinge on understanding the slope and scatter of local relations, especially those involving broad-line AGNs—the class of objects targeted by high-redshift studies, by necessity. Second, while reverberation-mapped AGNs benefit from smaller
  errors, their selection based on sufficient AGN variability may introduce biases (e.g., Woo et al. 2013 and references therein). Third, investigating the dependence of scaling relations on additional parameters, such as the amount of nuclear activity and the detailed properties of the host galaxies, is vital to understanding the physical origins of galaxies. For example, while the spheroid has been traditionally identified as the fundamental driver for
  , there have been studies that point toward tighter correlations of
  with the total host-galaxy light or stellar mass (Jahnke et al. 2009; Bennert et al. 2010, 2011b; Läsker et al. 2014). A related open question is the role of pseudo-bulges. Late-type galaxies are often known to host pseudo-bulges, characterized by nearly exponential light profiles, ongoing star formation or starbursts, and nuclear bars. It is generally believed that they have evolved secularly through dissipative processes rather than mergers (Courteau et al. 1996; Kormendy & Kennicutt 2004). Conversely, classical bulges are thought of as centrally concentrated, mostly red and quiescent, merger-induced systems. It is unclear how BHs would grow within pseudo-bulges and how their masses could be related: some authors find that pseudo-bulges correlate with
  (e.g., Kormendy 2001; Gu et al. 2009), while others propose either the opposite (Hu 2008; Greene et al. 2010; Kormendy & Bender 2011) or at least that both the
  –σ and
  –
– relations are not obeyed simultaneously (Greene et al. 2008; Nowak et al. 2010).
We present here the results of a program aimed at addressing these questions by building upon a robust and unique baseline of ∼100 local (0.02 ≤ z ≤ 0.09) Seyfert-1 galaxies selected from the Sloan Digital Sky Survey (SDSS; 
 ) for the study of the
  scaling relations. The homogeneous selection of our sample based on emission lines is disjoint from the reverberation-mapped AGNs and allows us to probe selection effects in the reverberation-mapped AGN sample which serves as a
  calibrator for the entire universe. Moreover, our selection is similar to high-redshift samples. Combining high-quality long-slit Keck/LRIS spectra with archival multi-filter SDSS images yields four different fundamental scaling relations. Results for a pilot sample of 25 objects have been presented by the first paper in the series (Bennert et al. 2011a, hereafter Paper I). Spatially resolved σ measurements for the full sample have been published by Harris et al. (2012, hereafter Paper II).
In this paper, we focus on the  –σ relation. We have obtained high signal-to-noise ratio (S/N) spatially resolved long-slit spectra and measured both aperture σ as well as spatially resolved σ (Paper II). Here, we derive spatially resolved σ within the bulge effective radius and compare it to different definitions of stellar velocity dispersion used in the literature.
The paper is organized as follows. We summarize sample selection, observations, and data reduction in Section 2. Section 3 describes the derived quantities, such as host-galaxy properties derived from surface photometry, stellar velocity dispersion, and  . In Section 4, we describe our final sample as well as comparison samples drawn from literature, consisting of local quiescent galaxies and reverberation-mapped AGNs. We present and discuss our results in Section 5. We conclude with a summary in Section 6. In Appendix
  . Appendix
Throughout the paper, we assume a Hubble constant of H0 = 70 km s−1 Mpc−1,  = 0.7 and
  = 0.3.
2. SAMPLE SELECTION, OBSERVATIONS, AND DATA REDUCTION
Sample selection, observations, and data reduction were described in detail in Papers I and II of the series, and are only summarized here briefly, for convenience. Details for the full sample of 103 objects are listed in Paper II (Tables 1 and 2).
Table 1. Sample and Derived Quantities
| Object | R.A. | Decl. | z |

|

|

|

|
log  / /
|
Host | Spheroid | Alt. Name |
|---|---|---|---|---|---|---|---|---|---|---|---|
| (J2000) | (J2000) | (km s−1) | (") | (km s−1) | (1044 erg s−1) | ||||||
| (1) | (2) | (3) | (4) | (5) | (6) | (7) | (8) | (9) | (10) | (11) | (12) |
| 0013-0951 | 00 13 35.38 | −09 51 20.9 | 0.0615 | 96 | 4.00 | 2111 ± 211 | 0.225 | 7.85 | BD | C | |
| 0026+0009 | 00 26 21.29 | +00 09 14.9 | 0.0600 | 172 | 1.54 | 1527 ± 227 | 0.025 | 7.05 | BDB | C | |
| 0038+0034 | 00 38 47.96 | +00 34 57.5 | 0.0805 | 127 | 1.23 | 3328 ± 239 | 0.208 | 8.23 | BD | C | |
| 0109+0059 | 01 09 39.01 | +00 59 50.4 | 0.0928 | 183 | 0.20 | 1797 ± 268 | 0.101 | 7.52 | BD | C | |
| 0121-0102 | 01 21 59.81 | −01 02 24.4 | 0.0540 | 90 | 1.74 | 1742 ± 106 | 0.290 | 7.75 | BDB | P | MRK1503 |
| 0150+0057 | 01 50 16.43 | +00 57 01.9 | 0.0847 | 176 | 2.85 | 2057 ± 129 | 0.020 | 7.25 | BD | C | |
| 0206-0017 | 02 06 15.98 | −00 17 29.1 | 0.0430 | 225 | 7.29 | 1979 ± 185 | 0.540 | 8.00 | BD(M) | C | UGC1597 |
| 0212+1406 | 02 12 57.59 | +14 06 10.0 | 0.0618 | 171 | 0.83 | 1586 ± 86 | 0.069 | 7.32 | BD | C | |
| 0301+0115 | 03 01 44.19 | +01 15 30.8 | 0.0747 | 99 | 1.90 | 1653 ± 105 | 0.155 | 7.55 | B | C | |
| 0310-0049 | 03 10 27.82 | −00 49 50.7 | 0.0801 | ... | 0.20 | 1558 ± 334 | 1.172 | 7.98 | BD | C | |
| 0336-0706 | 03 36 02.09 | −07 06 17.1 | 0.0970 | 236 | 7.17 | 2403 ± 192 | 0.036 | 7.53 | BD | C | |
| 0353-0623 | 03 53 01.02 | −06 23 26.3 | 0.0760 | 175 | 1.11 | 1548 ± 537 | 0.160 | 7.50 | BD | C | |
| 0731+4522 | 07 31 26.68 | +45 22 17.4 | 0.0921 | ... | 1.39 | 1885 ± 134 | 0.089 | 7.53 | BD | C | |
| 0737+4244 | 07 37 03.28 | +42 44 14.6 | 0.0882 | ... | 2.53 | 1692 ± 98 | 0.141 | 7.55 | BD | C | |
| 0802+3104 | 08 02 43.40 | +31 04 03.3 | 0.0409 | 116 | 3.41 | 1772 ± 185 | 0.072 | 7.43 | BD | C | |
| 0811+1739 | 08 11 10.28 | +17 39 43.9 | 0.0649 | 142 | 1.98 | 1520 ± 361 | 0.042 | 7.17 | BD | C | |
| 0813+4608 | 08 13 19.34 | +46 08 49.5 | 0.0540 | 122 | 0.99 | 1430 ± 91 | 0.048 | 7.14 | BDB | P | |
| 0845+3409 | 08 45 56.67 | +34 09 36.3 | 0.0655 | 123 | 1.15 | 1718 ± 172 | 0.064 | 7.37 | BDB | P | KUG0842+343A |
| 0854+1741 | 08 54 39.25 | +17 41 22.5 | 0.0654 | ... | 1.98 | 1472 ± 269 | 0.270 | 7.58 | BD | C | MRK1220 |
| 0857+0528 | 08 57 37.77 | +05 28 21.3 | 0.0586 | 126 | 2.22 | 1485 ± 51 | 0.135 | 7.42 | BD | C | |
| 0904+5536 | 09 04 36.95 | +55 36 02.5 | 0.0371 | 194 | 5.43 | 2483 ± 36 | 0.088 | 7.77 | B(M) | C | |
| 0921+1017 | 09 21 15.55 | +10 17 40.9 | 0.0392 | 83 | 3.37 | 2317 ± 286 | 0.030 | 7.45 | BD | C | VIIIZw045 |
| 0923+2254 | 09 23 43.00 | +22 54 32.7 | 0.0332 | 149 | 1.43 | 1824 ± 265 | 0.194 | 7.69 | BDB | P | |
| 0923+2946 | 09 23 19.73 | +29 46 09.1 | 0.0625 | 142 | 3.52 | 2936 ± 247 | 0.019 | 7.56 | B | C | |
| 0927+2301 | 09 27 18.51 | +23 01 12.3 | 0.0262 | 196 | 13.42 | 2112 ± 205 | 0.005 | 6.94 | BD | C | NGC2885 |
| 0932+0233 | 09 32 40.55 | +02 33 32.6 | 0.0567 | 126 | 0.63 | 1814 ± 72 | 0.069 | 7.44 | BD | C | |
| 0936+1014 | 09 36 41.08 | +10 14 15.7 | 0.0600 | ... | 3.25 | 1995 ± 80 | 0.091 | 7.59 | BD | C | |
| 1029+1408 | 10 29 25.73 | +14 08 23.2 | 0.0608 | 185 | 2.57 | 2456 ± 344 | 0.133 | 7.86 | BDB | C | |
| 1029+2728 | 10 29 01.63 | +27 28 51.2 | 0.0377 | 112 | 3.41 | 1544 ± 252 | 0.014 | 6.92 | B | C | |
| 1029+4019 | 10 29 46.80 | +40 19 13.8 | 0.0672 | 166 | 1.54 | 2193 ± 387 | 0.093 | 7.68 | BD | C | |
| 1042+0414 | 10 42 52.94 | +04 14 41.1 | 0.0524 | 74 | 3.13 | 1518 ± 102 | 0.039 | 7.14 | B | C | |
| 1043+1105 | 10 43 26.47 | +11 05 24.3 | 0.0475 | ... | 3.09 | 2314 ± 28 | 0.171 | 7.87 | B | C | |
| 1049+2451 | 10 49 25.39 | +24 51 23.7 | 0.0550 | 162 | 1.23 | 2534 ± 135 | 0.246 | 8.03 | BD | C | |
| 1058+5259 | 10 58 28.76 | +52 59 29.0 | 0.0676 | 122 | 0.99 | 1896 ± 645 | 0.075 | 7.50 | BDB | P | |
| 1101+1102 | 11 01 01.78 | +11 02 48.8 | 0.0355 | 197 | 8.16 | 3949 ± 170 | 0.068 | 8.11 | BD | C | MRK728 |
| 1104+4334 | 11 04 56.03 | +43 34 09.1 | 0.0493 | 87 | 1.15 | 1719 ± 160 | 0.016 | 7.04 | BD | C | |
| 1116+4123 | 11 16 07.65 | +41 23 53.2 | 0.0210 | 108 | 3.76 | 3136 ± 384 | 0.004 | 7.23 | BD | C | UGC6285 |
| 1132+1017 | 11 32 49.28 | +10 17 47.4 | 0.0440 | ... | 1.94 | 1900 ± 86 | 0.049 | 7.40 | BDB | C | IC2921 |
| 1137+4826 | 11 37 04.17 | +48 26 59.2 | 0.0541 | 155 | 1.07 | 1606 ± 92 | 0.006 | 6.74 | B | C | |
| 1143+5941 | 11 43 44.30 | +59 41 12.4 | 0.0629 | 122 | 3.13 | 1790 ± 128 | 0.099 | 7.51 | BD | C | |
| 1144+3653 | 11 44 29.88 | +36 53 08.5 | 0.0380 | 168 | 1.39 | 2933 ± 205 | 0.041 | 7.73 | BDB | P | KUG1141+371 |
| 1145+5547 | 11 45 45.18 | +55 47 59.6 | 0.0534 | 118 | 1.31 | 1837 ± 208 | 0.027 | 7.22 | BDB | P | |
| 1147+0902 | 11 47 55.08 | +09 02 28.8 | 0.0688 | 147 | 2.61 | 2896 ± 188 | 0.690 | 8.39 | B | C | |
| 1205+4959 | 12 05 56.01 | +49 59 56.4 | 0.0630 | 152 | 2.02 | 2678 ± 294 | 0.177 | 8.00 | BD | C | |
| 1210+3820 | 12 10 44.27 | +38 20 10.3 | 0.0229 | 141 | 1.23 | 2831 ± 148 | 0.062 | 7.80 | BD | C | KUG1208+3806 |
| 1216+5049 | 12 16 07.09 | +50 49 30.0 | 0.0308 | 189 | 6.57 | 4487 ± 477 | 0.035 | 8.06 | BDB | C | MRK1469 |
| 1223+0240 | 12 23 24.14 | +02 40 44.4 | 0.0235 | 124 | 7.25 | 2306 ± 107 | 0.007 | 7.10 | B | C | MRK50 |
| 1231+4504 | 12 31 52.04 | +45 04 42.9 | 0.0621 | 169 | 1.23 | 1555 ± 168 | 0.073 | 7.32 | BD(M) | C | |
| 1241+3722 | 12 41 29.42 | +37 22 01.9 | 0.0633 | 144 | 1.43 | 1574 ± 100 | 0.091 | 7.38 | BD | C | |
| 1246+5134 | 12 46 38.74 | +51 34 55.9 | 0.0668 | 119 | 3.05 | 1141 ± 130 | 0.044 | 6.93 | BD | C | |
| 1306+4552 | 13 06 19.83 | +45 52 24.2 | 0.0507 | 114 | 2.34 | 1892 ± 297 | 0.018 | 7.16 | BD | C | |
| 1307+0952 | 13 07 21.93 | +09 52 09.3 | 0.0490 | ... | 3.21 | 1630 ± 165 | 0.041 | 7.22 | BD | C | |
| 1312+2628 | 13 12 59.59 | +26 28 24.0 | 0.0604 | 109 | 1.47 | 1572 ± 496 | 0.154 | 7.51 | BD | C | |
| 1323+2701 | 13 23 10.39 | +27 01 40.4 | 0.0559 | 124 | 0.87 | 2414 ± 376 | 0.026 | 7.45 | BD | C | |
| 1355+3834 | 13 55 53.52 | +38 34 28.5 | 0.0501 | ... | 2.77 | 4034 ± 301 | 0.097 | 8.21 | B | C | MRK464 |
| 1405-0259 | 14 05 14.86 | −02 59 01.2 | 0.0541 | 125 | 0.59 | 1599 ± 140 | 0.020 | 7.04 | BD | C | |
| 1416+0137 | 14 16 30.82 | +01 37 07.9 | 0.0538 | 173 | 3.41 | 1514 ± 233 | 0.064 | 7.26 | BD | C | |
| 1419+0754 | 14 19 08.30 | +07 54 49.6 | 0.0558 | 215 | 4.99 | 3006 ± 371 | 0.116 | 8.00 | BD | C | |
| 1434+4839 | 14 34 52.45 | +48 39 42.8 | 0.0365 | 109 | 1.23 | 1731 ± 85 | 0.210 | 7.66 | BDB | C | NGC5683 |
| 1505+0342 | 15 05 56.55 | +03 42 26.3 | 0.0358 | ... | 2.10 | 2127 ± 139 | 0.382 | 7.98 | BD | C | MRK1392 |
| 1535+5754 | 15 35 52.40 | +57 54 09.3 | 0.0304 | 110 | 4.51 | 2442 ± 93 | 0.287 | 8.04 | B | C | MRK290 |
| 1543+3631 | 15 43 51.49 | +36 31 36.7 | 0.0672 | 146 | 2.93 | 1820 ± 168 | 0.229 | 7.73 | BD | C | |
| 1545+1709 | 15 45 07.53 | +17 09 51.1 | 0.0481 | 163 | 1.15 | 3588 ± 226 | 0.070 | 8.03 | BD | C | |
| 1554+3238 | 15 54 17.42 | +32 38 37.6 | 0.0483 | 158 | 1.82 | 2523 ± 159 | 0.125 | 7.87 | BD | C | |
| 1557+0830 | 15 57 33.13 | +08 30 42.9 | 0.0465 | ... | 1.62 | 2388 ± 91 | 0.063 | 7.66 | B | C | |
| 1605+3305 | 16 05 02.46 | +33 05 44.8 | 0.0532 | 187 | 1.58 | 1960 ± 272 | 0.254 | 7.82 | B | C | |
| 1606+3324 | 16 06 55.94 | +33 24 00.3 | 0.0585 | 157 | 1.54 | 2053 ± 80 | 0.067 | 7.54 | BD | C | |
| 1611+5211 | 16 11 56.30 | +52 11 16.8 | 0.0409 | 116 | 1.66 | 2515 ± 410 | 0.056 | 7.67 | BD | C | |
| 1636+4202 | 16 36 31.28 | +42 02 42.5 | 0.0610 | 205 | 8.24 | 2492 ± 230 | 0.125 | 7.86 | BD | P | |
| 1708+2153 | 17 08 59.15 | +21 53 08.1 | 0.0722 | 231 | 5.86 | 2975 ± 122 | 0.276 | 8.20 | B(M) | C | |
| 2116+1102 | 21 16 46.33 | +11 02 37.3 | 0.0805 | ... | 10.38 | 2484 ± 42 | 0.220 | 7.99 | BD | C | |
| 2140+0025 | 21 40 54.55 | +00 25 38.2 | 0.0838 | 126 | 1.90 | 1114 ± 64 | 0.585 | 7.52 | B | C | |
| 2215-0036 | 22 15 42.29 | −00 36 09.6 | 0.0992 | ... | 5.66 | 1636 ± 92 | 0.202 | 7.61 | BD | C | |
| 2221-0906 | 22 21 10.83 | −09 06 22.0 | 0.0912 | 142 | 3.60 | 2375 ± 131 | 0.104 | 7.77 | B | C | |
| 2222-0819 | 22 22 46.61 | −08 19 43.9 | 0.0821 | 122 | 1.07 | 1799 ± 168 | 0.177 | 7.66 | BD | C | |
| 2233+1312 | 22 33 38.42 | +13 12 43.5 | 0.0934 | 193 | 1.19 | 2477 ± 135 | 0.368 | 8.11 | BD | C | |
| 2254+0046 | 22 54 52.24 | +00 46 31.4 | 0.0907 | ... | 2.73 | 989 ± 261 | 0.481 | 7.37 | B(M) | C | |
| 2327+1524 | 23 27 21.97 | +15 24 37.4 | 0.0458 | 225 | 7.29 | 1924 ± 166 | 0.079 | 7.52 | B | C | |
| 2351+1552 | 23 51 28.75 | +15 52 59.1 | 0.0963 | 186 | 1.43 | 2974 ± 144 | 0.165 | 8.08 | B | C | |
Note. Column (1): target ID used throughout the text (based on R.A. and decl.). Column (2): right ascension. Column (3): declination. Column (4): redshift from SDSS-DR7. Column (5): spatially resolved stellar-velocity dispersion within spheroid effective radius. Determined from CaT, if available, else MgIb or CaHK (Paper II) according to Equation (1) (uncertainty of 0.04 dex). Column (6): spheroid effective radius in arcseconds. Column (7): second moment of broad Hβ.Column (8): rest-frame luminosity at 5100 Å determined from SDSS g' band surface photometry (fiducial error 0.1 dex). Column (9): logarithm of BH mass (solar units) (uncertainty of 0.4 dex). Column (10): host-galaxy decomposition: B = "bulge only," BD = "bulge+disk," BDB = "bulge+disk+bar." The "(M)" indicates an interacting or merging galaxy. Column (11): classification of spheroid as either classical bulge (C) or pseudo-bulge (P). Column (12): alternative name from NED.
The sample was selected from the SDSS Data Release (DR) six following these criteria: (i)  > 107
> 107 as estimated based on optical luminosity and FWHM of the broad Hβ line; (ii) redshift range 0.02 < z < 0.09 to measure stellar kinematics via the Ca ii triplet line in the optical and to ensure that the objects are well resolved. A total of 103 objects were observed between 2009 January and 2010 March with the Low Resolution Imaging Spectrometer (LRIS) at Keck I using a 1'' wide long slit, aligned with the host galaxy major axis as determined from SDSS ("expPhi_r"). The D560 dichroic (for data taken in 2009) or the D680 dichroic (for data taken in 2010) was used, the 600/4000 grism in the blue, and the 831/8200 grating in the red with central wavelength 8950 Å, resulting in an instrumental resolution of ∼90 km s−1 in the blue and ∼45 km s−1 in the red. A table with sample and observation details can be found in Paper II (Table 1).
The data were reduced following standard reduction steps including bias subtraction, flat fielding, and cosmic-ray rejection. Wavelengths were calibrated using arc lamps in the blue spectrum and sky emission lines in the red spectrum. Telluric absorption correction and relative flux calibration was performed using AOV Hipparcos stars.
All objects were covered by the VLA Faint Images of the Radio Sky at 20 cm survey,10 but only 32 have counterparts within a radius of 5''. Out of these, 21 are listed in Rafter et al. (2009) with only two being radio-loud. Thus, the majority of our objects are radio-quiet.
3. DERIVED QUANTITIES
To derive surface photometry, stellar-velocity dispersion, and  , we followed the same procedures as outlined in Papers I and II. We here briefly summarize the procedure and results.
3.1. Surface Photometry
In Paper I, we described in detail an image analysis code "Surface Photometry and Structural Modeling of Imaging Data (SPASMOID)" designed to allow for simultaneous fitting of multi-filter images with arbitrary constraints between the parameters in each band (Bennert et al. 2011a, 2011b). This joint multi-wavelength analysis enables a much more powerful disentanglement of the nuclear and host-galaxy components than using single-band imaging alone (e.g., using GALFIT, Peng et al. 2002). The bluer bands provide a robust measurement of the normalization of the nuclear flux while the redder data exploit the more favorable contrast between the AGN and the host galaxy to constrain the morphological structure of the latter. The approach of simultaneously using structural and photometric information is most successful for imaging of AGN hosts given the presence of a bright AGN point source. SPASMOID's reliance on a Markov Chain Monte Carlo (MCMC) technique also provides realistic uncertainties and the ability to explore covariances between various model parameters.
We use SPASMOID to perform surface-brightness photometry on the SDSS images, simultaneously fitting the AGN by a point-spread function (PSF) and the host galaxy by a combination of spheroid (Sérsic with free index n, in a range between 0.7 and 4.7), and if present, disk (exponential profile), and bar (Sérsic with index n = 0.5, i.e., a Gaussian). The results given in Table 1 correspond to the maximum a posteriori (MAP) values. Note that this approach differs slightly from Paper I, in which we fitted the spheroid with a single de Vaucouleurs (1948) profile. We thus here included all 25 objects from Paper I again and ran SPASMOID on the full sample of 103 objects. From the final sample, 11 objects were omitted due to either image defects, bright nearby stars complicating the fit, or no reliable fit achieved.
We use the Sérsic index to distinguish between classical bulges and pseudo-bulges (see Section 5.1). The spheroid radius is used to determine the stellar velocity dispersion within that effective radius (see Section 3.2). The PSF g'-band magnitude is corrected for Galactic extinction (subtracting the SDSS DR7 "extinction_g''" column), and then extrapolated to 5100 Å, assuming a power law of the form  ∝
∝  with α = −0.5. The resulting AGN luminosity free of host-galaxy contribution (except potential dust attenuation) is used for
  measurements (see Section 3.3). In the subsequent papers of the series (V. N. Bennert et al. 2015, in preparation), we will discuss luminosity and stellar masses of the different components when deriving the remaining
  -scaling relations.
3.2. Stellar-velocity Dispersion and Spatially Resolved Kinematics
From the full sample of 103 objects, the spectra of 21 objects did not yield a robust measurement of the stellar kinematics, due to dominating AGN flux and high redshift (12 objects) or problems with the instrument (9 objects), so our final kinematic sample consists of 82 objects (see Paper II, Table 2). While the exclusion of 10% of objects with faint galaxies compared to the AGN can in principle introduce a systematic effect in our sample, we consider this effect negligible, given the overall sample size.
For the majority of objects, broad nuclear Fe ii emission (∼5150–5350 Å) is present and interferes with the measurements of both σ in the MgIb range and broad Hβ width. Thus, for those objects, a set of IZw1 templates (varying width and strength) and a featureless AGN continuum were fitted simultaneously and subtracted.
Stellar-velocity dispersion σ was measured from three different spectra regions: around CaH&K (hereafter CaHK), around the Mg Ib
  (hereafter MgIb) lines and around Ca ii
  (hereafter CaT). σ measurements were obtained from a Python-based code described in detail in Papers I and II. In short, it is based on the algorithm by van der Marel (1994), fitting a linear combination of Gaussian-broadened (30–500 km s−1) template spectra (G and K giants of various temperatures as well as spectra of A0 and F2 giants from the Indo-US survey) and a polynomial continuum using a MCMC routine (with the best derived σ measurements corresponding to the MAP values). Telluric and AGN emission lines were masked and thus excluded from the fit.
In Paper II, σ measurements were derived for both aperture and spatially resolved spectra, i.e., as a function of distance from the center. The extracted spatially resolved spectra were used to determine the velocity dispersion within the spheroid effective radius  , free from broadening due to a rotating disk component. (Note that this assumes that the spheroid component dominates the velocity dispersion within the spheroid effective radius, and that contributions from bar and disk are negligible in comparison.) To do so, we calculate the velocity dispersion within the spheroid effective radius as determined from the surface photometry:
with I(r) = ![$I(\mathrm{reff})\cdot \mathrm{exp}(-{\kappa }_{n}\cdot [{(r/{r}_{\mathrm{reff}})}^{1/n}-1])$](https://content.cld.iop.org/journals/0004-637X/809/1/20/revision1/apj516745ieqn54.gif) the surface brightness of the spheroid fitted as a Sérsic profile. Here,
the surface brightness of the spheroid fitted as a Sérsic profile. Here,  is the rotational component of the spheroid. We approximated
  = 1.9992n-0.3271 (valid for 0.5
  10, Capaccioli et al. 1989; Prugniel & Simien 1997). (Note that n,
  , and
, and  are taken from the image analysis.) Since stellar velocity dispersions were measured for spectra on both sides of the center, along the major axis, we integrate from "
 " to "
 ." A spline function is used to interpolate over the appropriate radial range, since the
  measurements are discrete. In Section 5.2, we discuss other σ definitions used in the literature and compare them with the fiducial value used throughout this Paper from Equation (1).
3.3. BH Mass
We measure the second moment of the broad Hβ emission line from the central blue Keck/LRIS spectrum (1 square-arcsecond in size),using the IDL-based code implemented by Park et al. (2015), allowing for a multi-component spectral decomposition of the Hβ region. Here, we briefly summarize the procedure. First, we model and subtract the observed continuum by simultaneously fitting the pseudo-continuum, which consists of the AGN featureless power-law continuum, the AGN Fe ii emission template from Boroson & Green (1992), and the host-galaxy starlight templates from the Indo-US spectral library (Valdes et al. 2004), in the emission-line free windows of 4430–4770 Å and 5080–5450 Å. Second, we model the continuum-subtracted Hβ emission-line region by simultaneously fitting Gauss–Hermite series (van der Marel & Franx 1993; Woo et al. 2006; McGill et al. 2008) to the broad and narrow Hβ emission lines and the [O iii]  narrow emission lines and fitting Gaussian functions to the broad and narrow He ii
  emission lines (when blended with the broad Hβ component; see Section 3.1 of Park et al. 2015 for details). The final fits are shown in Figure 3.
From the resulting fit, the second moment of the broad Hβ component ( ) is combined with the 5100 Å AGN luminosity derived from surface photometryto estimate
  :
:
This equation is derived from adopting the most recent BLR radius-luminosity relation (Bentz et al. 2013, Table 14, Clean2+ExtCorr) and a virial factor of  (Park et al. 2012; Woo et al. 2013). The results are given in Table 1 for a sample of 79 objects (see the next paragraph). We assume a nominal uncertainty of the BH masses measured via the virial method of 0.4 dex (Vestergaard & Peterson 2006).
Note that from the full sample of 103 objects presented in Paper II, six objects showed only a broad Hα line in the SDSS spectrum and no broad Hβ line in either the SDSS or Keck spectra. While we can still estimate  from the broad Hα line in the SDSS spectrum, we decided to exclude them from the sample, for consistent
  measurements. An additional eight objects showed broad Hα and Hβ lines in the SDSS spectrum, but did not reveal any broad Hβ line in the Keck spectrum. We excluded these objects here as well, and our
  sample is thus comprised of 79 objects. However, we will discuss them individually in an upcoming paper (V. N. Bennert et al. 2015, in preparation). This upcoming paper will also include a direct comparison between the SDSS spectrum and the Keck spectrum, to study any broad-line variability. 57 objects are included in the BH mass function study by Greene & Ho (2007) with BH masses derived from the broad Hα line and luminosity in the SDSS spectra, with an overall good agreement in the mass measurements.
4. FINAL SAMPLE AND COMPARISON SAMPLES
While a sample of 103 objects was observed at Keck, not all properties could be determined for all objects (see Section 3). Taking into account the overlap between the measurements of surface photometry, stellar velocity dispersion and  , our final sample for the
  –σ relation consists of 66 objects (see Table 1).
We compare our sample with the compilation of  and σ for quiescent galaxies (McConnell & Ma 2013, 72 objects) as well as reverberation-mapped AGNs (Woo et al. 2015, 29 objects; adopting the same virial factor as for our sample;
  ). In Table 3, we additionally compare with the recent compilation of
  and σ for quiescent galaxies by Kormendy & Ho (2013, 51 objects; pseudo-bulges and mergers excluded). Our results do not change depending on what comparison sample we use. We discuss below the effects of different σ definitions used in the literature, including these comparison samples. Unfortunately, none of the literature uses the definition that we consider the most robust in this paper (see the discussion below).
Note that while for the quiescent galaxies, BH masses have been derived from direct dynamical measurements, the BH masses for active galaxies are calibrated masses either from reverberation mapping or from the virial method.
5. RESULTS AND DISCUSSION
For the discussion of our results, we only consider our final sample of 66 objects for which we have both  and σ measurements.
5.1. Host-galaxy Morphologies
We visually inspected the multi-filter SDSS images as well as the fits and residuals to determine the best host-galaxy decomposition. The majority of the host galaxies are classified as Sa or later (51/66 = 77%) and was fitted either by a spheroid+disk decomposition (40) or spheroid+disk+bar (11). For the remaining 15 objects, a spheroid only fit was deemed sufficient. The high fraction of spiral galaxies is typical for a sample of (mostly radio-quiet) Seyfert galaxies (e.g., Hunt & Malkan 1999 and references therein). This is consistent with the majority of objects (∼60%) showing rotation curves with a maximum velocity between 100 and 200 km s−1. 6% of the sample (4/66) are merging or interacting galaxies. This is lower than for our high-redshift Seyfert galaxies (∼30% at  , Park et al. 2015) and more comparable to quiescent galaxies in the local universe.
Of the 79 objects in our sample, 75 are included in the morphological classification by Galaxy Zoo (Lintott et al. 2011), but for only 28 did the vote reach the necessary 80% mark to flag the morphology as either spiral or elliptical. For those, our classification agrees in the majority of cases (82%) with the rest being classified as ellipticals by Lintott et al. (2011) while we classified them as spirals. However, we consider our classification as more robust since it also takes into accounts the fits and residuals, especially given the AGN central point source, which could lead to an overestimation of the presence of a bulge by Galaxy Zoo.
For the spiral galaxies in our sample, a little more than half of spheroid components are fitted by a Sérsic index  (28 objects = 55%, corresponding to 43% of the total sample). For the rest (23 objects), the spheroid component is fitted by a Sérsic index
  . On average, the Sérsic index for the spiral galaxies is 2.2 ± 1.6, for
  bulges 3.8 ± 0.8, and for
  bulges 0.9 ± 0.3.
If we take solely the Sérsic index as an indicator for the existence of a classical vs. pseudo-bulge, half of our spiral galaxies have pseudo-bulges; we consider them candidate pseudo-bulges. The host-galaxies of the reverberation-mapped AGNs have a similar distribution: Ho & Kim (2014) classify 75% as spiral galaxies with roughly half having classical bulges and half having pseudo-bulges. In a bulge+disk decomposition of galaxies in SDSS, roughly 25% of galaxies with sufficient image quality to study their bulge profile shape (a total of ∼53,000) have pseudo-bulges, if we use the same criterion with Sérsic index  (Simard et al. 2011, their Figure 15, when excluding bars with n = 0.5).
However, we further follow the guidelines by Kormendy & Ho (2013) to distinguish between classical bulges and pseudo-bulges, applying the following four criteria that we can probe with our data: (i) Sérsic index  for pseudo-bulges,
  for classical bulges; (ii) bulge-to-total luminosity ratios (in all four SDSS bands) B/T > 0.5 for classical bulges; (iii)
  /
/ > 1 for pseudo-bulges, < 1 for classical bulges (here,
  is the maximum velocity at the effective radius of the bulge and
  is the stellar velocity dispersion in the center); (iv) the presence of a bar in face-on galaxies as an indicator of a pseudo-bulge. To be conservative, we only classify objects as having a pseudo-bulge for which at least three of the above four criteria are met. That leaves us with a total of eight spiral galaxies with a definite pseudo-bulge.
5.2. Stellar-velocity Dispersions
The measurement of the stellar velocity dispersion profiles and rotation curves is described in detail in Paper II. In this paper, with the addition of the surface photometry parameters, we have all the necessary information to investigate the systematic uncertainties and biases related to the definition of the stellar velocity dispersion.
With this goal in mind, we carry out a systematic comparison between different definitions of the velocity dispersion parameter taken from the literature and our fiducial measurement ( , Equation (1)). Specifically we compute velocity dispersions as average of the second moment of the velocity field, by varying the size of the aperture, by considering the difference between correcting and not correcting the velocity rotation curve for inclination, and by considering the effects of contamination by nuclear light. While not 100% exhaustive, our list of definitions includes most of the choices adopted in the literature. For example, Ferrarese & Merritt (2000) use the second moment, integrating over one quarter of the effective radius of the galaxy and correcting the velocity for inclination. Neither Gültekin et al. (2009), McConnell & Ma (2013), nor Kormendy & Ho (2013) correct the velocity for inclination. However, Gültekin et al. (2009) and McConnell & Ma (2013) use the effective radius of the galaxy, while Kormendy & Ho (2013) use half of the effective radius of the galaxy. McConnell & Ma (2013) additionally discuss the choice of the minimum radius and find that setting it to zero (as done by e.g., Gültekin et al. 2009) can result in σ values smaller by 10%–15%, since it includes signal from within the BH gravitational sphere of influence. Thus, they instead set the minimum radius to the latter. However, for our data, we are not resolving the BH gravitational sphere of influence. Finally, many σ measurements in the literature are derived from aperture spectra, such as SDSS fiber spectra or spectra of distant galaxies integrated over different aperture sizes, making a direct comparison difficult. The reverberation-mapped AGN comparison sample falls into this category (Woo et al. 2015).
Table 2 lists the results for different possible comparisons, and Figure 1 shows three examples. Here,  (
( ) integrates out to half (one quarter) of the effective bulge radius.
  additionally corrects the velocity for inclination, as estimated from the disk:
Again, we adopt smaller integration radii in  and
and  (half and one quarter of the effective bulge radius, respectively).
  integrates out to the effective radius of the galaxy instead, or alternatively half/one quarter of that (
 ;
;  ). It follows that
  corrects the velocity for inclination, considering different integration limits in
  and
and  . Finally,
  integrates within the 1
 5 radius of the SDSS fiber. (Note that in fact our
  corresponds to a rectangular region with 15 radius and 1'' width, given the width of the long slit used.)
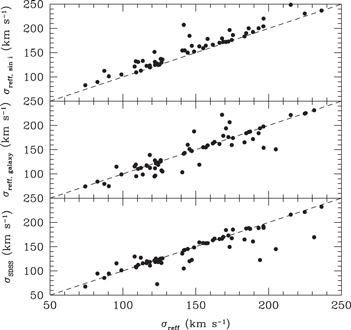
Figure 1. Comparison between stellar velocity dispersion as measured according to different definitions. The fiducial definition used throughout this paper,  , (Equation (1)) is shown on the x-axis, while alternative definitions based on different apertures (lower panel: "SDSS" corresponds to
  radius; middle panel: "galaxy" corresponds to the effective radius of the entire galaxy) or including corrections to the velocity for inclination (upper panel: "sini"). The dashed line represents the identity.
Download figure:
Standard image High-resolution imageTable 2. Comparison between Different Definitions for the Stellar Velocity Dispersion
| Ratio | Mean |
|---|---|
| (1) | (2) |
 / / |
0.98 ± 0.01 |
 / / |
0.99 ± 0.02 |
 / / a
a
|
1.31 ± 0.09 |
|
1.14 ± 0.06 |
|
1.05 ± 0.04 |
 a
a
|
0.99 ± 0.01 |
|
0.96 ± 0.01 |
|
0.98 ± 0.02 |
|
1.43 ± 0.09 |
|
1.18 ± 0.06 |
|
1.07 ± 0.04 |
 a
a
|
0.97 ± 0.01 |

|
1.01 ± 0.02 |
Notes. Comparison between the different definitions for the stellar velocity dispersion used in the literature. Column (1): ratio between a given definition of  (see text for details) and the fiducial
  used throughout the paper (Equation (1)). Column (2): mean and uncertainty of the ratio.
Download table as: ASCIITypeset image
The largest (average) effect on the derived σ is the correction of the velocity for inclination, which can result in σ measurements by on average 31% ± 9% larger (see Figure 1) (43% ± 9% in case of the galaxy effective radius), with individual objects as much as doubled. This discrepancy is reduced by considering smaller integration limits, since rotation is negligible at the center of most objects. However, such large differences are mainly due to galaxies seen close to face on, for which the velocities are highly uncertain and sometimes inflated beyond reasonably physical limits, resulting in large outliers. For example, if we impose arbitrarily that  (i.e., rotation not dominant), the average ratio falls to 1.06 ± 0.01. Or if instead less stringent we impose that
  (e.g., pseudo-bulges may be rotation dominated), the average ratio is 1.14 ± 0.02. Based on this source of uncertainty, we emphasize that the large difference should not be taken at face value, but more as an indication that for face-on galaxies we simply do not know the contribution of the rotational support. The intrinsic uncertainty in inclination correction for face-on objects is compounded by the fact that we do not have a good estimate of the inclination of the bulge. In the definitions of σ above labeled as "sini," we used the inclination of the disk component as a proxy. Given these caveats, we decided to not correct the velocities for inclination in our fiducial measurement,
  (Equation (1)), which is a common practice in the literature, including the comparison samples considered here. However, we caution that σ might be underestimated in some cases.
When increasing the radius to the galaxy effective radius, the σ measurement decreases on average by 1% ± 1% (see Figure 1). This is expected, since most objects show a decreasing stellar velocity dispersion with distance from the center (Paper II).
However, there is another effect that might counterbalance this trend: choosing a larger radius also includes more and more rotational velocities, in particular those of the disk. Depending on the viewing angle, disk rotation can lead to over-estimating σ, if seen edge-on, or under-estimating σ, if seen face-on, given that the disk is kinematically cold (e.g., Woo et al. 2006, 2013, Papers I and II). This effect can be potentially important, given the variety of host-galaxy morphologies in both local (e.g., Malkan et al. 1998; Hunt & Malkan 2004; Kim et al. 2008; Bennert et al. 2009, 2011b) and distant AGNs (Bennert et al. 2010, 2011b; Park et al. 2015). When considering the different morphologies and inclinations in our comparison between  and
and  , we confirm the expected trend.
Bellovary et al. (2014) use cosmological smoothed particle hydrodynamics (SPH) simulations of five disk galaxies and find that the line of sight effect due to galaxy orientation can affect σ by 30% with face-on views resulting in systematically lower velocity dispersion measurements and edge-on orientations leading to higher values due to a contamination of rotating disk stars. Both fiber-based SDSS data (e.g., Greene & Ho 2006; Shen et al. 2008) as well as aperture spectra for distant galaxies (e.g., our studies on the evolution of the  –σ relation; Woo et al. 2006, 2008; Treu et al. 2007) can suffer from the added uncertainty of the effect of the disk on σ. The evolutionary studies rely on active galaxies, by necessity, and given the distance of the galaxies, stellar velocity dispersion measurements are challenging. Aperture spectra typically include the central few kpc of the galaxy (for a typical aperture of 1'' = 5–7 kpc for the redshift range of z = 0.36–0.57 covered by, e.g., Woo et al. 2008), and can be contaminated by the disk kinematics, especially for Seyfert-1 galaxies chosen for these studies due to their relatively weak AGN power-law continuum. However, the evolutionary trend found by these studies is that of distant spheroids having on average smaller velocity dispersions than local ones. This effect cannot be explained by disk kinematics, since we would expect the opposite from rotational support. Thus, the offset of the distant AGNs from the local
  –σ scaling relations is, if anything, underestimated.
Choosing a generic radius of  as the SDSS fiber results in an underestimation of σ by 3% ± 1% (Figure 1). Note, however, that this difference is very sensitive to the distance of the particular objects, and the ratio between aperture size to bulge (or galaxy) effective radius. For our sample, the effective bulge radius (on average 2.9 ± 0.3) is close to the SDSS fiber size, so the difference is small.
In all the σ definitions mentioned above, we measured σ (and the velocity) as a function of distance from the center and integrated over it later out to the effective bulge radius (according to Equation (1)). However, this is not the same as directly integrating over the entire spectrum (out to the effective radius) and then measuring σ, since the latter will always include AGN power-law and emission lines, while in the former approach the central spectrum is sometimes excluded due to AGN contamination (Paper II). Thus, we also compare our fiducial stellar velocity dispersion  with the corresponding value derived from aperture spectra which on average overestimates σ by 1% ± 2%.
To conclude, these comparisons show that the choice of the exact definition of σ can have a non-negligible effect (up to 40%) and care needs to be taken, especially when comparing to other values in the literature. It is important to understand the effects of inclination, the rotational contribution of the disk, and the AGN contribution in the center, on the measurement of stellar velocity dispersion. We consider the value used in this paper,  (Equation (1)), the stellar velocity dispersion within the bulge effective radius derived from spatially resolved σ and velocity measurements, the most robust measurement since it excludes contributions of disk rotation and AGN emission. Moreover, distinguishing between bulge and disk in the context of the BH mass scaling relations is especially important if BHs correlate only with the bulge component and not the disk, as suggested by recent studies (Kormendy et al. 2011; Kormendy & Ho 2013).
5.3.
 –σRelation

In Figure 2, we show the resulting  –
– relation, as well as the offset from the fiducial relation. Overall, our sample follows the same
  –
– relation as that of reverberation-mapped AGNs as well as that of quiescent galaxies. Our sample covers a small dynamical range in BH mass (6.7
 < 8.2), mainly due to the fact that we selected low-luminous Seyfert galaxies with lower mass BHs to enable
  measurements. Considering the uncertainties of
  of 0.4 dex, we cannot independently determine the slope of the local relationship. The sample size is, however, sufficient to determine the zero point and scatter of the distribution around the local relationship, assuming a choice of the slope. Thus, when fitting a linear relation to the data of the form

we keep the value of  fixed to the corresponding relationships of quiescent galaxies (5.64 for McConnell & Ma 2013 and 4.38 for Kormendy & Ho 2013) or reverberation mapped AGNs (Woo et al. 2015, 3.97). The results are summarized in Table 3. Both zero point and intrinsic scatter are comparable to that of the quiescent galaxies, within the uncertainties, consistent with the hypothesis that the
  estimates we adopt do not introduce significant uncertainty in addition to the estimated one. Furthermore, biases based on different selection functions (reverberation mapped AGNs selected based on variability; quiescent galaxies selected based on the ability to resolve the BH gravitational sphere of influence; our sample selected based on Hβ line width) can be considered negligible.
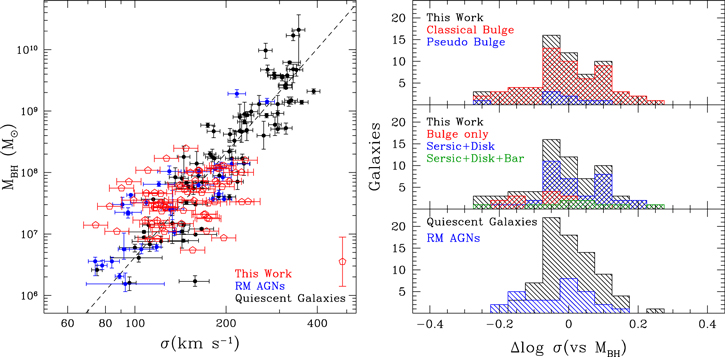
Figure 2.
 –σ relation. Left:
  –σ relation for our sample (red open pentagons), reverberation-mapped AGNs (blue; Woo et al. 2015), and a sample of quiescent local galaxies (black; McConnell & Ma 2013, with the black dashed line being their best fit). The error on the BH mass for our sample is 0.4 dex and shown as a separate point with error bar in the legend, to reduce confusion of data points. For our sample, the stellar velocity dispersion was determined within the spheroid effective radius according to Equation (1). We assume a nominal uncertainty of the stellar velocity dispersion of 0.04 dex. The reverberation-mapped AGNs have
  values derived from single apertures;
  for the quiescent galaxies is determined similar to Equation (1), but within the galaxy effective radius (see Section 5.2 for further comparison and discussion). Right: distribution of residuals with respect to the fiducial local
  –σrelation (McConnell & Ma 2013, Table 3). The lower panel shows literature data (reverberation-mapped AGNs from Woo et al. 2015 in blue; quiescent galaxies from McConnell & Ma 2013 in black), The middle panel shows our sample, the full sample in black, with different colors corresponding to different host-galaxy morphologies as indicated. The upper panel is the same as the middle panel, but distinguishing between classical and pseudo-bulges.
Download figure:
Standard image High-resolution imageTable 3.
Fits to the Local  –σ Relations
| Sample |

|

|
Scatter | Offset | Reference |
|---|---|---|---|---|---|
| (1) | (2) | (3) | (4) | (5) | (6) |
| Quiescent galaxies (72) | 8.32±0.05 | 5.64±0.32 | 0.38 | ⋯ | McConnell & Ma (2013) a |
| Quiescent galaxies (51) | 8.49±0.05 | 4.38±0.29 | 0.29 | ⋯ | Kormendy & Ho (2013) |
| Reverberation-mapped AGNs (29) | 8.16±0.18 | 3.97±0.56 | 0.41±0.05 | Woo et al. (2015) | |
| AGNs (66) | 8.38±0.08 | 5.64 (fixed) | 0.43±0.09 | −0.01±0.01 | this paper |
| AGNs (66) | 8.20±0.06 | 4.38 (fixed) | 0.25±0.10 | 0.06±0.01 | this paper |
| AGNs (66) | 8.14±0.06 | 3.97 (fixed) | 0.19±0.10 | 0.02±0.01 | this paper |
Notes. Fits to the  –σ relation,
  Column (1): sample and sample size in parenthesis. Column (2): mean and uncertainty on the best fit intercept. Column (3): mean and uncertainty on the best fit slope. Column (4): mean and uncertainty on the best fit intrinsic scatter. Column (4): mean and uncertainty of offset from fiducial relation of either McConnell & Ma (2013) (slope fixed to 5.64), Kormendy & Ho (2013) (slope fixed to 4.38), or Woo et al. (2015) (slope fixed to 3.97). Column (5): references for fit. Note that the quoted literature uses FITEXY with a uniform prior on the intrinsic scatter, so our fits assume the same.
Download table as: ASCIITypeset image
When probing dependencies on host-galaxy morphology, we find that barred galaxies (comprising 17% of the sample) do not lie preferentially off the  –σrelation, in agreement with studies by Graham (2008; Bentz et al. 2009; Beifiori et al. 2012) (see, however, Graham & Li 2009). Also, neither merging galaxies (6%) nor pseudo-bulges (12%) form particular outliers from the relation. This statement also holds true when considering all candidate pseudo-bulges (i.e., objects with spheroid with Sérsic index
  ; a total of 43% of the sample). In fact, candidate pseudo-bulges show an even smaller scatter in the relation.
While the latter is in agreement with some studies (e.g., Kormendy 2001; Gu et al. 2009), more recent studies suggest the opposite (Hu 2008; Greene et al. 2010; Kormendy & Bender 2011; Kormendy & Ho 2013; Ho & Kim 2014). Pseudo‐bulges, characterized by nearly exponential light profiles, ongoing star formation or starbursts, and nuclear bars, are believed to have evolved secularly through dissipative processes rather than mergers (Courteau et al. 1996; Kormendy & Kennicutt 2004), unlike their classical counterparts.
Given the sample of Seyfert-1 galaxies comprised of a majority of late-type galaxies and the small fraction of mergers, our results are consistent with secular evolution, driven by disk or bar instabilities and/or minor mergers, growing both BHs through accretion and spheroids through a re-distribution of mass from disk to bulge (e.g., Croton 2006; Jahnke et al. 2009; Parry et al. 2009; Bennert et al. 2010, 2011b; Cisternas et al. 2011; Schramm & Silverman 2013). We can only speculate here that the smaller scatter exhibited by pseudo-bulges might in fact be explained by a synchronizing effect that secular evolution has on the growth of BHs and bulges, growing both simultaneously at a small but steady rate. Major mergers, on the contrary, believed to create classical bulges (and elliptical galaxies) are a more stochastic and dramatic phenomenon with episodes of strong BH and bulge growth that can be out of sync due to the different time scales involved for growing BH and bulge in a major merger (e.g., Hopkins 2012). We cannot directly probe the latter with our data—as already mentioned, galaxies with obvious signs of interactions and mergers do not form particular outliers from the relation, but this is based on a very small sample statistics of 6% mergers.
However, we conclude with a note of caution: For one, when splitting our sample into sub-samples (such as classical versus pseudo-bulges), the results suffer from small sample statistics. Second, our morphological classification relies on ground-based SDSS images with inherent limitations such as limited depth and resolution. For example, the kpc-scale of bars and bulges is comparable to the spatial resolution of the SDSS images (a  PSF corresponds to 1.5 kpc at z = 0.05), significant given the presence of the bright point source in AGNs. The seeing in the ground-based SDSS images might also cause the host galaxies to appear rounder than they actually are. Likewise, faint tidal features indicative of merger events might have been missed in these shallow images. Deeper and higher spatial-resolution images are required to further test the connection between bars and bulges and BHs.
6. SUMMARY
To understand the origin of the scaling relations between the mass of the central supermassive BH and the properties of the host galaxy, studies relying on type-1 active galaxies probe the evolution of these relations. The robust determination of slope, scatter, and dependencies of a baseline consisting of a comparable sample of type-1 AGNs in the local universe is essential to minimize biases before any conclusions about their evolution can be drawn. We here create a local baseline of the  —stellar-velocity dispersion (
 ) relation for a homogeneously selected sample of 66 Seyfert-1 galaxies in the local universe (0.02
  0.09) selected from SDSS-DR6 based on BH mass (
 ), Combining high S/N long-slit Keck spectra with SDSS images yields
  using the virial method and stellar-velocity dispersion (
 ) from spatially resolved kinematics. Our results can be summarized as follows.
- 1.The majority of host galaxies (77%) are classified as Sa or later with roughly one-quarter of those showing evidence for a bar. This high fraction is also reflected in prominent rotation curves with a maximum velocity of 100–200 km s−1 in the majority of kinematic measurements (60%). The majority of spiral galaxies (28 objects; 55%) have spheroid components with Sérsic index. Of these candidate pseudo-bulges, eight can be considered as definite, when applying the classification criteria given by Kormendy & Ho (2013) that are measurable with our data. The minority (6%) shows signs of merging or interacting galaxies, comparable to quiescent galaxies in the local universe. These host-galaxy morphologies are typical for a sample of Seyfert-1 galaxies and suggest BH accretion being dominated by secular processes.
- 2.We use our spatially resolved kinematic data to reproduce various measurements of the stellar-velocity second moment, as used in the literature. The derived quantities differ significantly across definitions, in particular when considering effects of inclination, inclusion of a kinematically cold, rotating disk, and an AGN power-law continuum swamping the stellar absorption lines in the center. The average differences can be as much as 40%, highlighting the importance of using self-consistent definitions when comparing samples. We consider the definition of used in this paper as derived from spatially resolved measurements and integrated out to the bulge effective radius the most robust value for studies of the –σ relation, excluding disk rotation and AGN contamination.
- 3.Our Seyfert-1 galaxy sample follows the same–σ relation as the one of reverberation-mapped AGNs as well as that of quiescent galaxies, with the same intercept and scatter. This is consistent with the hypotheses that the uncertainty of the single epoch estimates we adopt is not significantly underestimated, and that the broad-emission line selection does not introduce a significant bias with respect to the criteria used in comparison samples (e.g., variability or BH sphere of influence).
- 4.Neither barred galaxies, merging galaxies, nor galaxies with pseudo-bulges seem to be significant outliers of the relation, at variance with recent predictions in the literature (Kormendy & Ho 2013). However, this conclusion is based on small sample statistics and relies on low-resolution ground-based SDSS images which make a morphological classification challenging in the presence of a bright AGN point source. Larger samples with higher quality data are needed to further test any correlations between detailed host-galaxy morphology and BH mass.


In the next paper of this series we will discuss the other scaling relations, namely with spheroid luminosity and stellar mass as well as host-galaxy luminosity and stellar mass.
We thank the anonymous referee for valuable comments helping to improve the paper. V.N.B. thanks Aaron Barth, Stéphane Courteau, Eric Emsellem, and Stefanie Komossa for discussions. V.N.B. acknowledges assistance from a National Science Foundation (NSF) Research at Undergraduate Institutions (RUI) grant AST-1312296. Note that findings and conclusions do not necessarily represent views of the NSF. V.N.B. and T.T. acknowledge support for program number HST-AR-12625.11-A, provided by NASA through a grant from the Space Telescope Science Institute, which is operated by the Association of Universities for Research in Astronomy, Incorporated, under NASA contract NAS5-26555. T.T. acknowledges support from the Packard Foundations in the form of a Packard Fellowship. T.T. gratefully acknowledges support from NSF through grant NSF-AST-1412315. D.P. acknowledges support through the EACOA Fellowship from The East Asian Core Observatories Association, which consists of the National Astronomical Observatories, Chinese Academy of Science (NAOC), the National Astronomical Observatory of Japan (NAOJ), Korean Astronomy and Space Science Institute (KASI), and Academia Sinica Institute of Astronomy and Astrophysics (ASIAA). J.H.W. acknowledges support by the National Research Foundation of Korea to the Center for Galaxy Evolution Research (2010-0027919). Data presented in this paper were obtained at the W. M. Keck Observatory, which is operated as a scientific partnership among Caltech, the University of California, and NASA. The Observatory was made possible by the generous financial support of the W. M. Keck Foundation. The authors recognize and acknowledge the very significant cultural role and reverence that the summit of Mauna Kea has always had within the indigenous Hawaiian community. We are most fortunate to have the opportunity to conduct observations from this mountain. This research has made use of the public archive of the Sloan Digital Sky Survey and the NASA/IPAC Extragalactic Database (NED) which is operated by the Jet Propulsion Laboratory, California Institute of Technology, under contract with the National Aeronautics and Space Administration.
Facilities: Keck:I (LRIS) -
APPENDIX A: BROAD Hβ EMISSION-LINE FITTING
Figure 3 show fits to the broad Hβ emission line for 79 objects for which we were able to measure  .
.
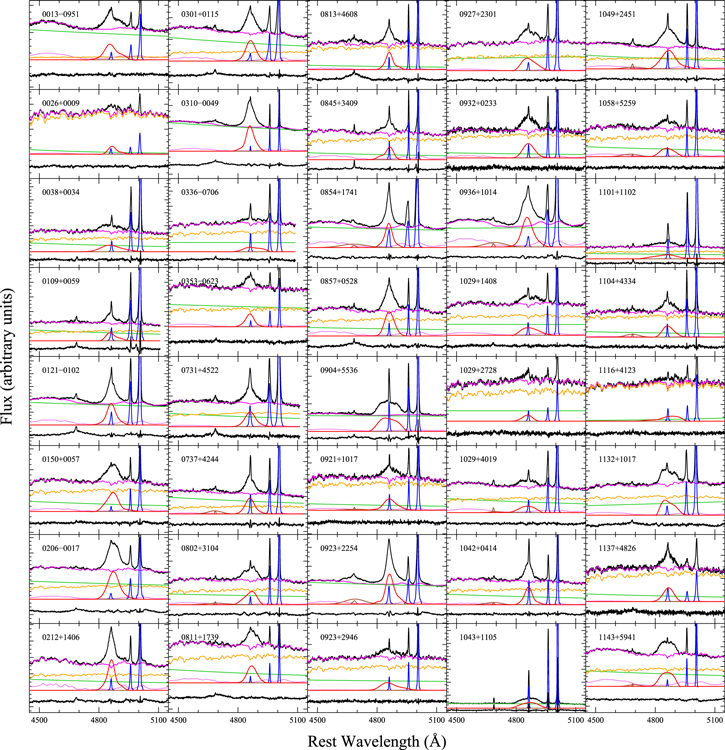
Download figure:
Standard image High-resolution image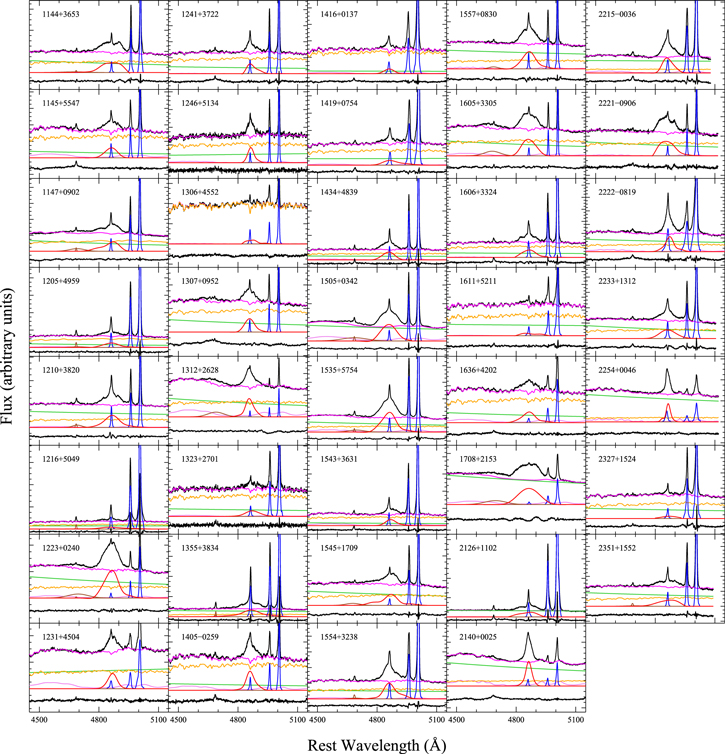
Figure 3. Determination of the second moment of the broad Hβ emission using a multi-component spectral decomposition. In the upper region, the observed spectrum is shown in black with the combined continuum model fit in magenta (consisting of power law, Fe ii, and host galaxy starlight). Below, the best-fit to the power-law continuum is shown in green with the stellar spectrum in yellow. Further below are the narrow lines of Hβ 4861, and [O iii]
  4959,5007 in blue, the broad and narrow components of He ii
  4686 in brown (only included if blended with the broad Hβ), the broad component of Hβ in red and the Fe ii contribution in purple. Finally, the residuals are shown in black (arbitrarily shifted downward for clarity).
Download figure:
Standard image High-resolution image
APPENDIX B: NOTES ON INDIVIDUAL OBJECTS
One object in our sample, 1223+0240 also known as MRK50, is also in the reverberation-mapped AGN sample and its BH mass has been estimated both in a traditional way (Barth et al. 2011),  (and that is also the value used when plotting the reverberation-mapped AGNs; note that the quoted uncertainty does not include the uncertainty on the virial factor) as well as using dynamical modeling (Pancoast et al. 2012),
  . Both values are within the uncertainties of the BH mass determined here via the virial method of
  . Pancoast et al. (2012) infer that the geometry of the BLR is a nearly face-on thick disk, with a potential net inflow or outflow. MRK50 is bulge dominated (MacKenty 1990; Koss et al. 2011) and Ho & Kim (2014) classify its bulge as classical bulge which matches our classification. Note that Figure 2 includes MRK50 twice, once among the reverberation-mapped AGNs with the reverberation-mapped MBH, once among our local sample.
1535+5754, aka MRK290, was included in the Lick AGN Monitoring Program (LAMP 2008), but did not exhibit strong variations, so no BH mass was derived. Bentz et al. (2013) classify the host galaxy as an early type spiral galaxy (Sa-Sab) at a relatively low inclination, based on HST images. However, this classification is questionable. Deo et al. (2006) describe the host galaxy as "probably elliptical," but mistakenly classified as unbarred spiral previously (Crenshaw et al. 2003). We classified MRK290 as elliptical galaxy with a classical bulge.
1216+5049 is known as MRK1469 and was classified as a highly inclined spiral galaxy with only large-scale dust lanes visible in Deo et al. (2006), in agreement with our classification
Footnotes
- 10
See VizieR Online Data Catalog, 8071 (Becker et al. 1997).