


ABSTRACT
Fluorine nucleosynthesis represents one of the most intriguing open questions in nuclear astrophysics. It has triggered new measurements which may modify the presently accepted paradigm of fluorine production and establish fluorine as an accurate probe of the inner layers of asymptotic giant branch (AGB) stars. Both direct and indirect measurements have attempted to improve the recommended extrapolation to astrophysical energies, showing no resonances. In this work, we will demonstrate that the interplay between direct and indirect techniques represents the most suitable approach to attain the required accuracy for the astrophysical factor at low energies,  keV, which is of interest for fluorine nucleosynthesis in AGB stars. We will use the recently measured direct
  astrophysical factor in the
  energy interval to renormalize the existing Trojan Horse Method (THM) data spanning the astrophysical energies, accounting for all identified sources of uncertainty. This has a twofold impact on nuclear astrophysics. It shows the robustness of the THM approach even in the case of direct data of questionable quality, as normalization is extended over a broad range, minimizing systematic effects. Moreover, it allows us to obtain more accurate resonance data at astrophysical energies, thanks to the improved
  direct data. Finally, the present work strongly calls for more accurate direct data at low energies, so that we can obtain a better fitting of the direct reaction mechanism contributing to the
  astrophysical factor. Indeed, this work points out that the major source of uncertainty affecting the low-energy S(E) factor is the estimate of the non-resonant contribution, as the dominant role of the 113 keV resonance is now well established.
Export citation and abstract BibTeX RIS
1. BACKGROUND
1.1. Astrophysical Scenario
Fluorine nucleosynthesis in galaxies is still a matter of debate. Massive and low-mass stars in the final stages of their evolution have been suggested to be the most important sites for the production of 19F, which is the only stable isotope of that element (Jorissen et al. 1992; Woosley & Weaver 1995). Alternative astrophysical scenarios for the nucleosynthetic origin of 19F are possible and include classical novae (Truran et al. 1986; Wiescher et al. 1986), Wolf–Rayet stars (Meynet & Arnould 1993), and SNe Ia, but all of these have been ruled out as dominant sources of galactic 19F because relevant yields are only obtained for particular choices of model parameters which correspond to cases that are very scarce in nature (José & Hernanz 1998; Kobayashi et al. 2011 and references therein). Moreover, an F abundance a factor of 100 higher than solar has been measured in cosmic rays (George et al. 2009), but we cannot state whether spallation in CRs plays an important role in the galactic chemical evolution of F due to the lack of data on this issue.
Today, state-of-the-art chemical evolution models must include contributions from both asymptotic giant branch (AGB) stars and SNe II to reproduce the F abundance in the Galaxy, but the yields from AGB or core-collapse supernovae alone are not sufficient to match observations. In particular, the ν process of core-collapse supernovae has been found to be crucial for synthesizing F at low metallicity [O/H] ≤ −1.2, but it does not sufficiently reproduce the rapid increase of the [F/O] ratio at higher metallicity ([O/H] ≥ −0.5), which can be accounted for by following pollution from AGB stars (Kobayashi et al. 2011).
Observations of stars in globular clusters and in the LMC instead indicate that AGB stars are the sole source of fluorine in these systems where the star formation and chemical enrichment histories are different from those of the solar neighborhood and field stars (Cunha et al. 2003; Abia et al. 2011; Kobayashi et al. 2011).
In our Galaxy, F abundances have been measured by stellar spectroscopy in AGB stars (Werner et al. 2009; Abia et al. 2010; Otsuka et al. 2011) and in some carbon-enhanced metal-poor stars (Lugaro et al. 2008; Lucatello et al. 2011). These observations might represent strong constraints and challenges for nucleosynthesis models, as they are very sensitive to the physical conditions of the stellar environment. Indeed, 19F is produced by core and shell He burning at  K, but it is also destroyed by α captures once temperatures exceed
  K. In AGB stars, where H and He burning take place alternately, an important contribution to F production comes from the chain of reactions
  , and
, and  is the main fluorine depletion channel in hydrogen-rich environments, such as in the base of the convective envelope of stars with masses of 4−7
  where fluorine can experience temperatures large enough to cause its destruction (Lugaro et al. 2004, hot bottom burning).
Even in AGB stars with masses smaller than 2  , 19F nuclei could undergo proton capture when involved in non-convective mixing mechanisms, which bring H-burning products to the stellar surface (Palmerini et al. 2011 and references therein). In a recent paper, Wachlin et al. (2014) demonstrated that fingering diffusion (or thermohaline mixing, Eggelton et al. 2006) cannot account for modification of the surface abundances in red giant stars. However, other physical origins have been proposed for non-convective mixing phenomena, such as stellar MHD (Busso et al. 2007; Denissenkov et al. 2009). The efficiency of the aforementioned mixing when modifying surface abundances might be limited not only by the small amount of the transported mass, but also by the low temperatures (smaller than a few 107 K) experienced by the mixed material. For this reason, an accurate estimate of the
  cross section at low energies is mandatory to determine whether or not non-convective mixing might deplete F in AGB stars and if it might be driven by stellar magnetic fields.
A recent work (La Cognata et al. 2011) pointed out the possible occurrence of resonances in the  astrophysical factor at energies
  keV, which are of interest for the study of stellar nucleosynthesis.
1.2. Assessment of Nuclear Data
Despite its importance, a few years ago no data were available on the  astrophysical factor at energies
  keV where fluorine burning is most effective (Gamow energy, Iliadis 2007). In particular, since the main contribution to the
  astrophysical factor is due to the emission of α particles from
  leaving
  in its ground state (referred to as
  , Spyrou et al. 2000); in what follows, we will focus on this channel. Widely adopted compilations such as the Nuclear Astrophysics Compilation of Reaction Rates (NACRE, Angulo et al. 1999) used data from different sources to supply a recommended astrophysical factor and, consequently, reaction rate (Isoya et al. 1958; Breuer 1959; Warsh et al. 1963; Morita et al. 1966; Caracciolo et al. 1974; Cuzzocrea et al. 1980). However, the lowest-energy data reach a 461 keV center-of-mass energy (Breuer 1959), well above the Gamow peak, and only the unpublished data of Lorentz-Wirzba (1978), which have been used in Herndl et al. (1991) and Yamashita & Kudo (1993), partially cover the relevant astrophysical range. While the older measurement discussed in Breuer (1959) indicates the existence of two resonances with
  and
and  at
at  MeV, the unpublished data of Lorentz-Wirzba (1978) and the NACRE extrapolation support a non-resonant trend in the low-energy S(E) factor. This contradiction and the very simple recommended extrapolation to astrophysical energies have generated speculation concerning a nuclear origin to the discrepancies observed in Galactic fluorine studies (La Cognata et al. 2011), since the largest observed fluorine overabundances cannot be explained with standard AGB models including extra-mixing (see Lucatello et al. 2011, for instance). This has required a reassessment of the nuclear reaction rates involved in fluorine production and destruction.
The Trojan Horse Method (THM, Spitaleri et al. 2011; Tribble et al. 2014) has proven very useful in investigating the  reaction at astrophysical energies, especially in the modified version implemented for the investigation of resonant reactions (Mukhamedzhanov et al. 2008; La Cognata et al. 2009, 2010, 2012, 2013; Mukhamedzhanov 2011). In La Cognata et al. (2011), we used the generalized R-matrix approach (Mukhamedzhanov 2011) to explore the energy region
  MeV, spanning both the range of astrophysical importance and the energy interval
  , where resonances were present that could be used for normalization. In fact, under the simplified assumptions used to deduce the THM astrophysical factor of the
  reaction, no absolute values could be defined and normalization to direct data was necessary (compare La Cognata et al. 2011, for more details). As a first step to normalization, a weighed fit of the direct S(E) factor data available in the literature, down to about 0.6 MeV (Angulo et al. 1999), was performed by means of standard R-matrix formulas (Lane & Thomas 1958). In this way, the resonance parameters of the 13.529, 13.586, and 13.642 MeV states in 20Ne were obtained. These were used to calculate the generalized R-matrix S(E) factor above 0.6 MeV. The normalization factor was then deduced by scaling the calculated
  to the experimental TH cross section in the overlap region between the direct and indirect data. The normalization error was deduced at the same time, essentially reflecting the spread of the direct and indirect data.
Of course, such a procedure could lead to systematic errors, as it relies on the existing measured  S(E) factors and the available
  spectroscopic data. These normalization errors add up to the systematic uncertainty linked to the theoretical framework used in the data reduction. If ambiguities for the direct data are present, as discussed above for the
  astrophysical factor, then the use of a weighted fit might be misleading as a small error affecting the direct data might not include systematic uncertainties, thus pushing the THM astrophysical factor to values potentially different from the "true" ones, that is, those corresponding to a negligible systematic error. In general, a thorough investigation of the uncertainties is necessary before proceeding to a weighted fitting, as extensively discussed, for instance, in Adelberger et al. (2011); however, in the case of old and defective data, such an analysis might be impossible. These considerations, among others, have led to new direct measurements of the
  reaction cross section with the aim of obtaining more reliable low-energy data, removing the ambiguities affecting the astrophysical factor (Lombardo et al. 2013).
2. COMPARISON WITH DIRECT DATA IN THE NORMALIZATION REGION AND THEIR FITTING
As reported in Lombardo et al. (2013), the authors performed a very accurate measurement of the  cross section in the
  energy interval. Since the
  reaction is highly exoenergetic (Q = 8.114 MeV), aluminum foils could be placed in front of the 12 silicon detectors to suppress the elastically scattered protons and keep the background below 1%. Angular distributions were measured at about 10° steps, while energies were changed at about 10 keV steps. A statistical error ranging between 6% and 20% affects the astrophysical factor in Lombardo et al. (2013), while a systematic error of about 7% was estimated by the authors. Close to the 20Ne state at 13.642 MeV, good agreement is found between the data in Lombardo et al. (2013) and the older data from Caracciolo et al. (1974) and Isoya et al. (1958), within the error bars. At lower energies,
  keV, good agreement is apparent between the data from Lombardo et al. (2013) and those from Breuer (1959), even if the uncertainties are quite large. Both data sets show a smooth increase in S(E) with decreasing energy in the overlapping energy range, possibly linked to the potential existence of 20Ne broad states at about ∼13.22 MeV, as reported in Breuer (1959) and in the indirect measurement in La Cognata et al. (2011). This energy trend is in sharp disagreement with the analysis of Isoya et al. (1958), supporting a significantly lower S(E) with a discrepancy amounting to ∼40%. A discrepancy of the same order is apparent in the
  energy region where the difference reaches about 30%, and above ∼900 keV, that is, the upper part of the investigated energy region. In the these last cases, the error bars are smaller, making the differences more striking.
Regarding the level at 13.642 MeV, Isoya (1958) attributed a spin parity of  based on an R-matrix analysis of the cross sections and angular distributions of the
  and
and  reaction. The latter corresponds to the case where α is emitted leaving 16O in its first excited state, which cannot decay to the ground state through one gamma-ray emission due to spin-parity matching. In contrast, Lombardo et al. (2013) analyzed the energy trend of the An and Bn coefficients from the decomposition of the differential cross section
  in terms of the cosine and Legendre polynomials, respectively. They concluded that the enhancement of the A0 and B0 coefficients around 800 keV center-of-mass energy is a clear signature of the occurrence of a
  state in 20Ne at an excitation energy of 13.642 MeV, in agreement with the spin-parity assignment from previous works (Webb et al. 1955; Caracciolo et al. 1974). Table 1 contains a summary of the
  data relevant in the normalization region. Specifically, the trend of the astrophysical factor below about 600 keV and the minimum center-of-mass energy reached in the experiments are cited. Moreover, for the 20Ne states at 13.529, 13.586, and 13.642 MeV, responsible for the resonances in the normalization region, the total widths and spin-parities are shown, labeled by the superscripts 1, 2, and 3, respectively. The presence of such contradictory results calls for a more detailed analysis, and makes it necessary to have a thorough discussion concerning the THM astrophysical factor normalization because of the significant difference in direct data at the THM normalization energies.
Table 1.
Summary of  Data Relevant in the Normalization Region
| Reference | Low-energy Behavior | Emin (keV) |

|

|

|

|

|

|
|---|---|---|---|---|---|---|---|---|
| Webb et al. (1955) | non-resonant | 550 | ⋯ | ⋯ | ⋯ | ⋯ | 23 |

|
| Isoya et al. (1958) | non-resonant | 598 | 63 | 2+ | 10 | 2+ | 22 | 2+ |
| Breuer (1959) | resonant | 461 | 35 | 2+ | 10 | ⋯ | 25 | 0+ |
| Caracciolo et al. (1974) | non-resonant | 760 | ⋯ | ⋯ | ⋯ | ⋯ | 23a | 0+ |
| Lorentz-Wirzba (1978) | non-resonantb | ⋯ | ⋯ | ⋯ | ⋯ | ⋯ | ⋯ | ⋯ |
| Herndl et al. (1991) c | non-resonant | 150 | 63 | 2+ | 9 | 2+ | 17 | 2+ |
| Yamashita & Kudo (1993) c | non-resonant | ⋯ | ⋯ | ⋯ | ⋯ | ⋯ | ⋯ | ⋯ |
| Tilley et al. (1998) | resonant | 400 | 61 | 2+ | 9 ± 1 | 2+ | 17 ± 1 | 0+ |
| Angulo et al. (1999) d | non-resonant | ⋯e | ⋯f | ⋯f | ⋯f | ⋯f | ⋯f | ⋯f |
| La Cognata et al. (2011) | resonant | 0g | ⋯h | 2+ | ⋯h | 2+ | ⋯h | 2+ |
| Lombardo et al. (2013) | resonant | 600 | ⋯ | 2+ | 9 | 2+ | 22 | 0+ |
| Present work | resonant | ⋯i | 65 ± 7 | 2+ | 17 ± 12 | 2+ | 22 ± 3 | 2+ |
| Present work—AZURE | resonant | ⋯i | 57 | 2+ | 13 | 2+ | 20 | 2+ |
Notes. For each reference, the trend of the astrophysical factor below about 600 keV, the minimum center-of-mass energy reached in the experiments (Emin), and the total widths and spin-parities of the resonances due to the 20Ne states at 13.529, 13.586, and 13.642 MeV, responsible for the resonances in the normalization regions, are shown, labeled by the superscripts 1, 2, and 3, respectively.
aSame as in Ajzenberg-Selove (1972). bDeduced from the NACRE compilation (Angulo et al. 1999). cUsing data from Lorentz-Wirzba (1978). dNACRE compilation. eSame as in Breuer (1959). fThe authors used the data by Isoya et al. (1958) and by Caracciolo et al. (1974; in the range of 0.760–0.817 MeV). gIndirect measurement using THM. hWidths were fixed to the values in Tilley et al. (1998). iSame as in Lombardo et al. (2013).Download table as: ASCIITypeset image
Following the procedure in La Cognata et al. (2011, 2012, 2013) and Tribble et al. (2014), we performed an R-matrix fit of the astrophysical factor in Lombardo et al. (2013) to determine the p-and α-reduced widths to be introduced in the generalized R-matrix fitting of the THM data (La Cognata et al. 2011). In our calculation, we took the non-resonant background from the NACRE compilation (Angulo et al. 1999) and the channel radii from La Cognata et al. (2011). At first, we fixed  for the three resonances under consideration, that is, we assumed the same conditions as in La Cognata et al. (2011). In Figure 1, we show the astrophysical factor from Lombardo et al. (2013, solid symbols), together with the R-matrix fit performed using the same R-matrix code as in La Cognata et al. (2011), based on Lane & Thomas (1958, red line), and the R-matrix fit obtained using the more advanced multi-level, multi-channel AZURE computer code (blue line, Azuma et al. 2010). Interference effects were fully taken into account and justify the sharp drop in the astrophysical factor in the energy region below about 0.66 MeV and above about 0.82 MeV. In the former fit, the resonance energies were fixed to those obtained in the AZURE fit, namely, 697, 739, and 807 keV (corresponding to the 20Ne states at 13.529, 13.586, and 13.642 MeV). Very good agreement is found between the two fits, as is also clear from the computed
  per degree of freedom, 0.3 and 0.5, respectively (the number of degree of freedom, hereafter ndf, is 14 and 18, respectively). Slightly smaller widths, still in agreement within our uncertainties (∼10%), were obtained in the AZURE fit, giving
  , 13, and 20 keV for the three resonances mentioned above, respectively. Our fit instead provided
  , 17 ± 12, and 22 ± 3 keV. The resonance energies and widths are in good agreement with those reported by Lombardo et al. (2013) and, taking into account the differences in the astrophysical factor between Lombardo et al. (2013) and Isoya (1958), also agree with this latest data set. The main difference between our widths and those cited in the literature (Isoya 1958) resides in the width of the resonance at 739 keV,
  keV (Isoya 1958); however, this value is well within the large uncertainty affecting this width in our calculation. The widths obtained through the fitting procedures described so far are reported in Table 1, together with the resonance parameters in the literature.

Figure 1. R-matrix fit of the astrophysical factor in Lombardo et al. (2013, solid symbols), using two different R-matrix codes, namely, that used in La Cognata et al. (2011, red line) and the more advanced AZURE code (Azuma et al. 2010, blue line).
Download figure:
Standard image High-resolution imageIn the comparison between the analysis in Lombardo et al. (2013) and Isoya (1958), two main differences have to be noted if we focus on the energy region close to the 800 keV resonance. The first difference is the spin-parity assignment for the 13.642 MeV 20Ne state, as discussed above. Moreover, based on the anomalies affecting the A2 and B2 terms at  keV, the presence of a
  20Ne state at 13.626 MeV with a width
  keV is deduced, in agreement with the results in Caracciolo et al. (1974). Using the parameters obtained in the previous case as initial values for the
  resonances and the values provided in Lombardo et al. (2013) for the
  and 0+ resonances, the AZURE code was used to perform a fit for the astrophysical factor in Lombardo et al. (2013) following the discussion contained therein. The resulting fitting curve is provided in Figure 2 (blue line), superimposed on the Lombardo et al. (2013) data. Even if a very good reproduction of the data were achieved (the
  per degree of freedom is 0.15, ndf = 12), the resonance parameters deviate from those mentioned above and generally accepted for the resonances under investigation. In particular, while
  keV was calculated for the
  state, as indicated in Lombardo et al. (2013),
  keV was obtained for the other three resonances, which does not match the values reported, for instance, by Lombardo et al. (2013). The present findings necessitate more direct measurements of the
  reaction and, in particular, a new measurement of the
  contribution, since the present considerations stem from the data of Isoya (1958). Based on such an analysis, we chose to normalize the THM data to the astrophysical factor of Lombardo et al. (2013), still assuming a spin-parity assignment of
  for the 13.642 MeV 20Ne state.
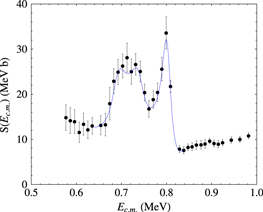
Figure 2. R-matrix fit of the astrophysical factor in Lombardo et al. (2013, solid symbols) using the AZURE code (Azuma et al. 2010, blue line), assuming  for the 13.642 MeV 20Ne state and introducing the
  13.626 MeV 20Ne state observed in Lombardo et al. (2013).
Download figure:
Standard image High-resolution image3. NORMALIZATION OF THM DATA AND CORRESPONDING UNCERTAINTY
As briefly discussed in the Introduction and at length in La Cognata et al. (2012, 2013), normalization was attained by extending the THM measurement up to 1 MeV to guarantee an overlap with the direct astrophysical factor. A standard R-matrix routine was used to compute the reduced widths necessary to reproduce the direct data, where available. Since the same reduced widths appear in the THM cross section  as in the direct S(E) factor, with the essential difference between the two being the absence of any Coulomb or centrifugal penetration factor in the entrance channel (Mukhamedzhanov 2011; La Cognata et al. 2013), such parameters were fixed to those previously obtained. After folding
  with a Gaussian having an FWHM of 60 keV to account for the energy resolution (La Cognata et al. 2011), as calculated from beam spot size and divergence, energy loss in the ΔE detectors, target and dead layers, and detectors intrinsic angular and energy resolution, we superimposed the calculated THM cross section onto the experimental one, leaving a scaling factor as the only free parameter. This is necessary to match the theoretical
  to the experimental data; it was found by comparing the two above 600 keV, but the same normalization factor was then used over the whole energy region covered by the experimental THM data. In this way, we fixed the relative normalization of the low-energy region, below 600 keV, to that at higher energies, 0.6 MeV ≲ Ec.m.. The ≲ 0.8 MeV data and calculated THM cross section are both given in arbitrary units. This means that the resonance parameters of the 20Ne states at excitation energies below about 13.5 MeV are normalized to those of the states at 13.529, 13.586, and 13.642 MeV. A normalization error of +12%–8% was determined.
The resulting calculation is shown in Figure 3. The solid symbols demonstrate the THM data as in La Cognata et al. (2011). The middle red line is the best-fit curve ( per degree of freedom 3.6, ndf = 8) while the upper and lower red lines highlight the upper and lower limits due to statistical and normalization uncertainties. The black arrows mark the 20Ne states introduced into the calculation. The reduced widths of the states at 13.529, 13.586, and 13.642 MeV are fixed to the values from the standard R-matrix fitting of the Lombardo et al. (2013) data. The resonance parameters of the other levels at 12.957, 13.048, and 13.226 MeV are instead adjusted to reproduce the trend of the experimental THM
  . In the region around 400 keV, a single resonance is considered as in La Cognata et al. (2011), the one with the largest spin (
 ), as states with higher spin are preferentially populated in the THM reaction yield (La Cognata et al. 2011, 2013; Mukhamedzhanov 2011). Other resonances are present, due to the 20Ne states at 13.224 MeV (
 ) and 13.222 MeV (
 ), which are less enhanced in the THM measurement than the
  state, due to the
  dependence of the THM cross section (La Cognata et al. 2011, 2013; Mukhamedzhanov 2011). Therefore, based on the THM data, we can state that around 400 keV, a resonance is present in the direct data, in agreement with the conclusions drawn in La Cognata et al. (2010, 2011), Lombardo et al. (2013), and Breuer (1959). However, the THM data do not allow us to provide quantitative information on the resonance parameters since the mentioned resonances cannot be resolved. As in La Cognata et al. (2011), the most important result of this work is the determination of the occurrence of a resonance at 113 keV in the
  –p center-of-mass system. Even if the resolution were better than 60 keV, the three resonances could be hardly resolved as they are located 2 keV apart. Guidance from direct data is necessary for more accurate indirect results.

Figure 3. Generalized R-matrix fit of the THM data in La Cognata et al. (2011, solid symbols). The lower and upper red lines delimit the region allowed by statistical and normalization uncertainties (red band), and the middle line is the best-fit curve. Above 600 keV, the only fitting parameter is the scaling factor. Below 600 keV, the fitting parameters are the reduced widths of the marked 20Ne states (black arrows).
Download figure:
Standard image High-resolution imageAn important characteristic clearly featured by the THM data set is the possible presence of a shift of about 25 keV in the energy scale. This is the radix of the  per degree of freedom which is larger than that in La Cognata et al. (2011). Its origin is associated with the contributions from the resonances at 685 and 742 keV in Lombardo et al. (2013), which are more prominent than those in Isoya (1958). When the generalized R-matrix calculation is folded with a Gaussian curve to account for the energy resolution (La Cognata et al. 2009), the resonances above 600 keV cannot be resolved and a single peak shows up, whose position is set by the weighted average of the resonance energies. Since the peaks at 685 and 742 keV are fed with a larger probability than in Isoya (1958; the astrophysical factor is about 30% larger in Lombardo et al. 2013), and the contribution of the 798 keV resonance remains constant, the centroid of the folded
  is shifted toward lower energy. This might signal the presence of a systematic error in the energy calibrations which has to be taken into account in the forthcoming analysis. It is worth noting that such a shift is apparent at energies above 600 keV while it is not evident at lower energies, especially at the energies of astrophysical interest.
From the fitting of the THM data, we obtained the widths of the resonances lying below 600 keV. In detail, we obtained  ,
,  , and
, and  keV for the three 20Ne states at 12.957, 13.048, and 13.226 MeV. The cited errors include correlations, as the different sources of uncertainty are clearly not independent. In contrast with La Cognata et al. (2011), these are fitted values and were not fixed in the calculation. The energy and spin parity of these resonances were instead fixed to the values given in the compilation (Tilley et al. 1998; see La Cognata et al. 2011, for more details). These values agree very well with those in La Cognata et al. (2011) and with those reported in the compilation (Tilley et al. 1998). The quite large error bars include the statistical and normalization errors, and reflect the uncertainty due to the possible shift in energy affecting the indirect data. As mentioned above, while the contribution of the 13.226 MeV state is dominant in the indirect measurement as no centrifugal barrier is suppressing its population, in the direct measurement, other levels at 13.224 MeV (
 ) and 13.222 MeV (
 ) might be dominant, and so information about the 13.226 MeV level may be of little interest for astrophysical applications, which is at odds with the 12.957 MeV state whose importance was already pointed out in La Cognata et al. (2011).
4. THE THM ASTROPHYSICAL FACTOR AND REACTION RATE
The resonance parameters provided by fitting the experimental  cross section were then introduced into a standard R-matrix code (Lane & Thomas 1958) to determine the energy trend of the astrophysical factor of the
  reaction (as stated above, of the more important
  channel) at low energies. This is possible because in the modified R-matrix approach, the same reduced widths appear as in the on-energy-shell S(E) factor, with the only difference being the absence of any Coulomb or centrifugal penetrability factor in the entrance channel (La Cognata et al. 2011, 2013; Mukhamedzhanov 2011). The S(E) factor calculated with the resonance parameters from the fitting of the THM data below 600 keV is shown in Figure 4. Since the TH cross section yielded the resonance contribution only, the non-resonant part of the cross section was taken from Angulo et al. (1999). However, there is a clear mismatch between the direct contribution recommended by Angulo et al. (1999) and the experimental measurement in Lombardo et al. (2013). New direct measurements are of the utmost importance to obtain a more realistic non-resonant contribution at low energies, since the one given in Angulo et al. (1999) is based on a very simple calculation. The middle red curve depicts the S(E) factor computed using the parameters from the best fit, while the red band arises from the uncertainties on the resonance parameters due to the combined statistical, normalization, and energy shift errors (including correlation). An average error of 20% is obtained. This is different from the result in La Cognata et al. (2011), where only the errors affecting the resonances below 600 keV were reported (no correlations).
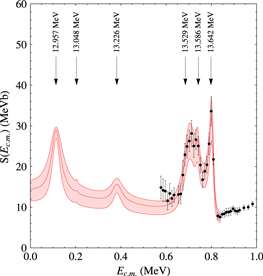
Figure 4. Red band shows the combination of the S(E) factor from the fitting of the Lombardo et al. (2013) data (above 600 keV) and of that calculated using the standard R-matrix formulae where the resonance parameters were taken from the generalized R-matrix fitting of the THM data in Figure 3 (below 600 keV). As before, the middle, upper, and lower red lines stand for the best fit, upper limits, and lower limits set by the combined statistical, normalization, and energy shift error. The solid symbols represent the direct astrophysical factor in Lombardo et al. (2013). As in Figure 3, the arrows mark the 20Ne states contributing to the S(E) factor.
Download figure:
Standard image High-resolution imageIf we focus on the main result of this measurement, that is, the resonance due to 12.957 MeV, then here we stress the very good agreement between the present result, based on the normalization of the THM data to the Lombardo et al. (2013) data, and the data in La Cognata et al. (2011) where the normalization to the older data in Isoya (1958) was carried out. This demonstrates the robustness of the THM approach and the weak dependence on the normalization if this is performed to more than one resonance. In this way, in fact, we reduce the impact of the systematic errors affecting the direct data. In detail, the top value of the resonance at 113 keV obtained in the present work,  MeVb, should be compared with the previous result (La Cognata et al. 2011),
  MeVb. The smaller uncertainty of the peak value is a consequence of the more thorough treatment of the different sources of uncertainty (statistical, normalization, and energy shift), attributing the uncertainty mostly to the non-resonant part. Indeed, from inspection of Figure 4, it is clear that the main source of uncertainty is our current poor knowledge of the non-resonant contribution, which was neglected in La Cognata et al. (2011). Such a consideration makes it clear that new direct measurements reaching energies lower than 600 keV are mandatory to improve our current understanding of the
  reaction, and such measurement should be aimed at both the
  and
and  channels.
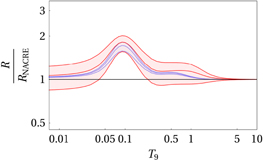
Using the astrophysical factor in Figure 4, we evaluated the variation of the reaction rate with respect to that recommended by NACRE (Angulo et al. 1999) and usually adopted in astrophysical modeling. The reaction rate for the  channel was calculated, for the present data set (R) and for that recommended by NACRE (
 ), by means of standard equations (Rolfs & Rodney 1988; Iliadis 2007), that is, by folding S(E) with the Maxwell–Boltzmann energy distribution. The ratio of the THM rate to that calculated using the NACRE data set is given in Figure 5 as a function of
  . As in the previous figures, the middle red line marks the recommended reaction rate ratio based on the best-fit curve in Figure 4. Similarly, the upper and lower red lines provide the uncertainty range. According to the discussion in the Introduction, the NACRE S(E) factor shows a non-resonant behavior from 0.6 MeV downward, which is in sharp disagreement with the THM result. Coherently, the
  in Figure 5 significantly deviates from 1 in the temperature range of interest for AGB studies,
  K (see the introductory section for more details). Such deviation, as large as a factor of 1.8, can be attributed to the presence of the 113 keV peak in the
  astrophysical factor due to the 12.957 MeV state of 20Ne. This result relies on the assumption that the non-resonant contribution is the same as that assumed in the NACRE compilation. Recently, new data from Lombardo et al. (2013) seem to suggest that such resonant behavior, even if they cannot reach energies of astrophysical relevance, is more realistic than the simple linear extrapolation recommended by NACRE (Angulo et al. 1999). Finally, the reaction rate given here essentially agrees with that from La Cognata et al. (2011), as should be expected since the contribution of the 113 keV resonance is the same in both works. In the present work, larger errors are found because a full error analysis has been performed, as discussed above, while in La Cognata et al. (2011) only the uncertainties affecting the resonances were taken into account. The
  ratio given in La Cognata et al. (2011) is shown as a blue band in Figure 5. For astrophysical calculations, the present work rate should be employed using the quoted uncertainties.
Figure 5. Ratio of the reaction rate calculated using the THM astrophysical factor in Figure 4 (red band) compared to that calculated adopting the NACRE-recommended S(E) factor (Angulo et al. 1999), as a function of the temperature expressed in units of 109 K. For comparison, the black line shows the  value, corresponding to the NACRE rate in this representation, while the
  ratio given in La Cognata et al. (2011) is shown as a blue band. Calculations were performed for the
  channel.
Download figure:
Standard image High-resolution image
5. CONCLUDING REMARKS
This work was motivated by the recent publication of a new measurement of the  channel (Lombardo et al. 2013), which is the most important channel for fluorine destruction in AGB stars (Spyrou et al. 2000). Since the new astrophysical factor departs from that in Isoya (1958), used to normalize the THM S(E) in La Cognata et al. (2011), we have reanalyzed the THM data to verify the dependence of the THM astrophysical factor on normalization in case more than one peak is used. This has important consequences for astrophysics and in the application of the method because it allows us to critically analyze systematic errors affecting the THM S(E) factor. Normalization is, in fact, a critical point in the application of the method and, very often, one of the largest sources of uncertainties. In the present work, it turns out that the new normalization negligibly alters the conclusions of our previous work (La Cognata et al. 2011), although it does show some critical points linked to the energy calibration and energy resolution. Indeed, the new direct data (Lombardo et al. 2013) suggest the presence of a shift in the
  –p relative energy spectrum. However, the poor energy resolution does not allow us to check the energy calibration since peaks are not resolved. These results call for a new THM measurement with improved energy resolution and better energy calibration.
Regarding direct measurements, this work underscores the importance of direct measurements for the application of indirect approaches. The two methods are strictly complementary and only a synergistic study can lead to an accurate understanding of low-energy nuclear reactions, which are of key importance for astrophysics. This paper has clearly demonstrated the necessity of a more comprehensive analysis of all the channels leading to the population of 20Ne at excitation energies ≳13 MeV to perform a correct attribution of the spin parity of the 13.642 MeV level, of new direct measurements to collect new  data for a more accurate determination of the resonance parameters, and of new low-energy data to fix the direct contribution. Only a complete picture of 20Ne excitation energies at ∼13 MeV can result in a significant improvement of our understanding of fluorine nucleosynthesis. In this framework, indirect measurements play an important role as they allow us to reach astrophysical energies, which is often impossible due to Coulomb suppression of the cross section and the electron screening effect.
The work was supported in part by the Italian MIUR under grant No. RBFR082838. A.M.M. acknowledges that his work is supported by the U.S. Department of Energy, Office of Science, Office of Nuclear Science, under awards No. DE-FG02-93ER40773 and No. DE-SC0004958. It is also supported by the U.S. Department of Energy, National Nuclear Security Administration, under award No. DE-FG52-09NA29467 and by the US National Science Foundation under award No. PHY-1415656.