


ABSTRACT
Classical Cepheids are useful tracers of the Galactic young stellar population because their distances and ages can be determined from their period–luminosity and period–age relations. In addition, the radial velocities and chemical abundance of the Cepheids can be derived from spectroscopic observations, providing further insights into the structure and evolution of the Galaxy. Here, we report the radial velocities of classical Cepheids near the Galactic center, three of which were reported in 2011 and a fourth being reported for the first time. The velocities of these Cepheids suggest that the stars orbit within the nuclear stellar disk, a group of stars and interstellar matter occupying a region of ∼200 pc around the center, although the three-dimensional velocities cannot be determined until the proper motions are known. According to our simulation, these four Cepheids formed within the nuclear stellar disk like younger stars and stellar clusters therein.
Export citation and abstract BibTeX RIS
1. INTRODUCTION
The Galactic center is comprised of complex systems of stars and interstellar matter (gas and dust) displaying interesting and important phenomena (e.g., see the review by Morris & Serabyn 1996). The Galactic bulge, extending over a few kiloparsecs, is populated predominantly by old stars, roughly 10 Gyr old (Zoccali et al. 2003), and possibly by a smattering of younger stars (a few Gyr old; Bensby et al. 2013). In contrast, the ∼200 pc region around Sgr A* at the center hosts many young stars and is the region of current star formation (Serabyn & Morris 1996). These young stars are distributed throughout a disk-like structure called the nuclear stellar disk (hereafter NSD; Launhardt et al. 2002). Interstellar gas and dust occupy the so-called the central molecular zone (CMZ; Morris & Serabyn 1996) found in the same region.
The most prominent stars in the NSD are young luminous stars such as O/B-type stars and Wolf–Rayet stars. These are found in large numbers in three stellar clusters: Arches, Quintuplet, and the nuclear star cluster surrounding Sgr A*. The Arches and Quintuplet clusters are, at most, 6 Myr old (Stolte et al. 2008; Liermann et al. 2012; Schneider et al. 2014), and young massive stars also reside in the nuclear star cluster (Krabbe et al. 1995). Similarly, young and massive stars are found across the NSD field (Yusef-Zadeh et al. 2009; Mauerhan et al. 2010). Recently, Matsunaga et al. (2011) discovered classical Cepheids in the direction of the NSD, and their distances (estimated from period–luminosity relations) are consistent with the distance to the NSD. From the period–age relation (Bono et al. 2005), these Cepheids were found to be similarly aged (∼25 Myr). Populations of relatively young stars are also evidenced by the concentration of OH/IR stars and mass-losing red supergiants (Lindqvist et al. 1992). Blommaert et al. (1998) found that some OH/IR stars are very luminous, suggesting ages of ∼1 Gyr or even ∼100 Myr (see also van Loon et al. 2003). However, these estimates have large uncertainties because we lack understanding of the mass loss phenomena in the stars (Gallart et al. 2005). From surface–density distributions, Matsunaga et al. (2013) suggested that a fraction of old stellar population represented by short-period Miras belongs to the NSD, although NSD membership requires confirmation by kinematical information.
The disk-like structure of the NSD and CMZ suggests that these systems spin around the Galactic center. In fact, the l–v diagram reveals elliptical orbits of the molecular gas in this region (Binney et al. 1991; Stark et al. 2004), which are understood as x2 orbits expected near or inside the inner Lindblad resonance (Contopoulos & Papayannopoulos 1980; Athanassoula 1992). On the other hand, x1 orbits are elongated along the bar potential and are exhibited by a portion of gas within the Galaxy. Gas transfer from x1 to x2 orbits is considered to supply interstellar matter to the CMZ and to sustain star formation therein (Stark et al. 2004). Numerical simulations conducted by Kim et al. (2011) demonstrated that gas moving along x1 orbits can fall down to x2 orbits, forming a ring in which stars form.
Some observational data show that stars in the NSD also orbit in a manner somewhat consistent with the x2 orbits. The first evidence of such rotation came from observations of maser emission by OH/IR stars and large-amplitude variables (Lindqvist et al. 1992; Deguchi et al. 2004). The radial velocities of the massive clusters Arches and Quintuplet (approximately +100 km s−1 at positive Galactic longitudes) also suggest prograde rotation in the NSD (Figer et al. 2002; Liermann et al. 2009). However, Stolte et al. (2008, 2014) reported that the proper motions of Arches and Quintuplet clusters are too large for movement along closed x2 orbits, but may be consistent with transitional trajectories from x1 to x2 orbits. To investigate the evolution of the NSD, we require the kinematics of stars of various ages; however, previously studied objects in the NSD are limited.
Here we report spectroscopic observations of classical Cepheids within 0 4 of the center. These stars are young (∼25 Myr), already suggesting that they belong to the NSD rather than to the extended bulge dominated by old stars, and their rotations should appear in the NSD. The dynamical (rotational) timescale in the NSD is several megayears; hence, these stars may have orbited several times since their birth. Such tracers would provide important insight into the formation and dynamical evolution of stars in the NSD. The pulsations of Cepheids cause red- and blueshifts of their stellar absorption lines, and spectra should preferably be taken at different pulsation epochs (see, for instance, Marconi et al. 2013). In addition, the severe interstellar extinction toward the NSD demands infrared observations, although little research exists on the infrared spectroscopy of Cepheids (Sasselov & Lester 1990; Sabbey et al. 1995; Nardetto et al. 2011). The present work utilizes the H-band spectra between 15680 Å and 17870 Å; in this wavelength range, the extinction for the Cepheids found near the NSD is around 4.5 mag in contrast to more than 30 mag in the optical. These infrared spectra are used for measuring the radial velocities in order to confirm the membership to the NSD and to study the kinematics within the NSD.
2. OBSERVATIONS
2.1. Targets
Our targets are the three Cepheids reported in Matsunaga et al. (2011, 2013) named GCC-a, -b, and -c and a similar newly discovered Cepheid named GCC-d (Table 1). Our recent survey of variable stars detected this Cepheid at 032 from Sgr A*. In this survey, 142 fields of view were captured along the Galactic plane (|l| < 10°, b = 0°) by the SIRIUS camera attached to the Infrared Survey Facility (IRSF). The monitoring started in 2007 April and continued until 2012 May; the numbers of phases was typically 30. The exposure time was 8 s per visit, ∼six times shorter than that in Matsunaga et al. (2011). Among several classical Cepheids discovered by our group (N. Matsunaga et al., in preparation), the coordinates of GCC-d and its distance from the Sun places this star near the NSD. The period of GCC-d, determined in the same way as in Matsunaga et al. (2013), approximates those of the other three Cepheids, suggesting a similar age (∼25 Myr) based on the period–age relation (Bono et al. 2005). The photometric measurements and the light curve of GCC-d are presented in Table 2 and Figure 1, respectively. The Barycentric Julian Date (BJD) in the Barycentric Dynamical Time standard was calculated for each JHKs data set (Eastman et al. 2010), while Modified Julian Date (MJD) is also listed to make the comparison with previous publications easier.
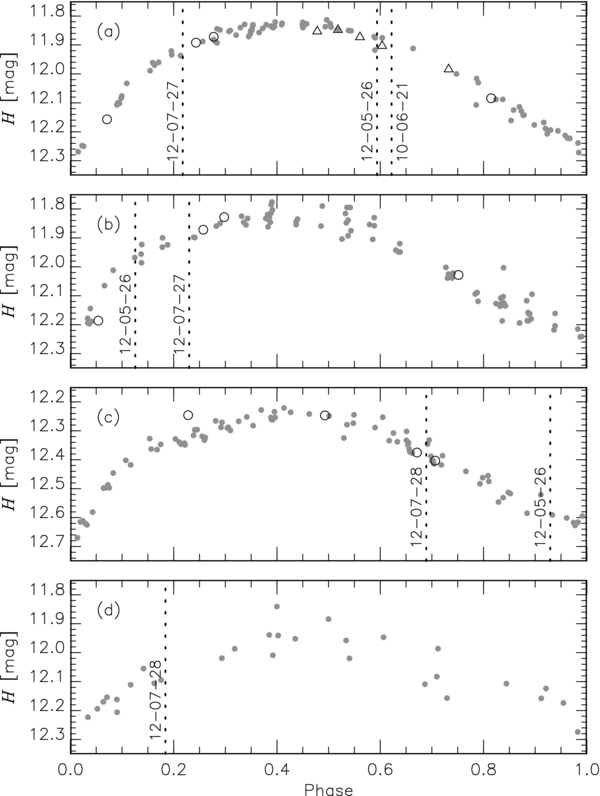
Figure 1. H-band light curves of the target Cepheids. Magnitudes of GCC-a, -b, and -c in 2010 June and 2012 July are indicated by open triangles and open circles, respectively. The photometric data in Matsunaga et al. (2013) are also included. Vertical dotted lines indicate the dates (YY-MM-DD) and phases of the IRCS spectroscopic observations (see Tables 4 and 6).
Download figure:
Standard image High-resolution imageTable 1. Target List
| Object | R.A. | Decl. | l | b | Period |
|---|---|---|---|---|---|
| (J2000.0) | (J2000.0) | (deg) | (deg) | (days) | |
| GCC-a | 17:46:06.01 | −28:46:55.1 | +0.186 | −0.009 | 23.528 |
| GCC-b | 17:45:32.27 | −29:02:55.2 | −0.105 | −0.043 | 19.942 |
| GCC-c | 17:45:30.89 | −29:03:10.5 | −0.112 | −0.041 | 22.755 |
| GCC-d | 17:44:56.90 | −29:13:33.7 | −0.324 | −0.026 | 18.886 |
Download table as: ASCIITypeset image
Table 2. Photometric Catalog of GCC-d
| BJD | MJD | J | eJ | H | eH | Ks |  |
|---|---|---|---|---|---|---|---|
| (mag) | (mag) | (mag) | (mag) | (mag) | (mag) | ||
| 2454172.62180 | 54172.12153 | 15.63 | 0.05 | 12.10 | 0.01 | 10.33 | 0.03 |
| 2454220.48339 | 54219.97875 | 15.71 | 0.11 | 12.08 | 0.01 | 10.27 | 0.01 |
| 2454224.47362 | 54223.96870 | 15.87 | 0.08 | 12.12 | 0.01 | 10.33 | 0.01 |
| 2454231.50812 | 54231.00275 | 15.35 | 0.07 | 12.02 | 0.01 | 10.25 | 0.02 |
| 2454246.56109 | 54246.05498 | 15.97 | 0.07 | 12.21 | 0.01 | 10.41 | 0.04 |
| 2454284.32459 | 54283.81819 | 15.71 | 0.06 | 12.16 | 0.01 | 10.38 | 0.02 |
| 2454321.38376 | 54320.87922 | 15.75 | 0.08 | 12.19 | 0.01 | 10.41 | 0.01 |
| 2454326.40654 | 54325.90239 | 15.49 | 0.09 | 11.99 | 0.01 | 10.21 | 0.01 |
| 2454349.36209 | 54348.85997 | 15.55 | 0.05 | 11.96 | 0.01 | 10.16 | 0.03 |
| 2454360.36648 | 54359.86543 | ⋅⋅⋅ | ⋅⋅⋅ | 12.11 | 0.04 | 10.45 | 0.03 |
| 2454384.32315 | 54383.82442 | ⋅⋅⋅ | ⋅⋅⋅ | 11.94 | 0.01 | 10.19 | 0.01 |
| 2454385.26846 | 54384.76981 | 15.44 | 0.11 | 11.95 | 0.02 | 10.17 | 0.01 |
| 2454537.57722 | 54537.07699 | 15.51 | 0.06 | 11.88 | 0.01 | 10.12 | 0.01 |
| 2454573.51165 | 54573.00799 | 15.54 | 0.07 | 11.94 | 0.02 | 10.18 | 0.03 |
| 2454619.63155 | 54619.12519 | 15.70 | 0.08 | 12.11 | 0.01 | 10.28 | 0.01 |
| 2454697.25949 | 54696.75580 | 15.80 | 0.09 | 12.17 | 0.01 | 10.39 | 0.02 |
| 2454715.33246 | 54714.83041 | ⋅⋅⋅ | ⋅⋅⋅ | 12.16 | 0.01 | 10.35 | 0.01 |
| 2454743.28785 | 54742.78852 | ⋅⋅⋅ | ⋅⋅⋅ | 12.01 | 0.02 | 10.16 | 0.01 |
| 2454889.64600 | 54889.14703 | ⋅⋅⋅ | ⋅⋅⋅ | 12.05 | 0.01 | 10.29 | 0.01 |
| 2454919.63460 | 54919.13269 | ⋅⋅⋅ | ⋅⋅⋅ | 12.16 | 0.01 | 10.25 | 0.01 |
| 2455010.50274 | 55009.99624 | 15.87 | 0.09 | 12.02 | 0.01 | 10.22 | 0.01 |
| 2455020.38676 | 55019.88049 | 15.50 | 0.07 | 12.17 | 0.02 | 10.34 | 0.01 |
| 2455058.28738 | 55057.78332 | 15.85 | 0.07 | 12.15 | 0.02 | 10.36 | 0.02 |
| 2455114.24664 | 55113.74783 | ⋅⋅⋅ | ⋅⋅⋅ | 12.22 | 0.01 | 10.40 | 0.01 |
| 2455324.42128 | 55323.91606 | 15.64 | 0.07 | 12.11 | 0.01 | 10.29 | 0.02 |
| 2455434.33571 | 55433.83256 | 15.66 | 0.07 | 12.27 | 0.01 | 10.45 | 0.01 |
| 2455617.60239 | 55617.10364 | ⋅⋅⋅ | ⋅⋅⋅ | 12.11 | 0.02 | 10.46 | 0.06 |
| 2455725.51261 | 55725.00603 | 15.26 | 0.05 | 11.84 | 0.02 | 10.09 | 0.05 |
| 2456050.47590 | 56049.97095 | ⋅⋅⋅ | ⋅⋅⋅ | 11.95 | 0.02 | 10.21 | 0.01 |
| 2456052.46567 | 56051.96059 | ⋅⋅⋅ | ⋅⋅⋅ | 11.99 | 0.02 | 10.23 | 0.02 |
Download table as: ASCIITypeset image
Also at the IRSF, we conducted additional photometry of GCC-a, -b, and -c in 2010 June and 2012 July (Table 3 and see also Figure 1). By combining the new data with the previous data, we obtained more precise periods (Table 1) with a longer baseline and can more accurately estimate the pulsational phases at which the following spectroscopic observations were made.
Table 3. Additional Photometry in JHKs for GCC-a, -b, and -c
| Object | BJD | MJD | J | eJ | H | eH | Ks |  |
|---|---|---|---|---|---|---|---|---|
| (mag) | (mag) | (mag) | (mag) | (mag) | (mag) | |||
| GCC-a | 2455365.52974 | 55365.02314 | 15.45 | 0.03 | 11.85 | 0.01 | 9.95 | 0.01 |
| 2455366.47019 | 55365.96359 | 15.47 | 0.03 | 11.85 | 0.01 | 9.96 | 0.01 | |
| 2455367.47477 | 55366.96817 | 15.47 | 0.03 | 11.87 | 0.01 | 9.99 | 0.01 | |
| 2455368.48445 | 55367.97786 | 15.56 | 0.02 | 11.90 | 0.01 | 10.01 | 0.01 | |
| 2455371.51335 | 55371.00677 | ⋅⋅⋅ | ⋅⋅⋅ | 11.98 | 0.01 | 10.11 | 0.01 | |
| 2456126.34383 | 56125.83790 | 15.79 | 0.04 | 12.08 | 0.01 | 10.22 | 0.01 | |
| 2456132.37312 | 56131.86750 | 15.69 | 0.06 | 12.16 | 0.01 | 10.30 | 0.01 | |
| 2456136.42675 | 56135.92137 | 15.48 | 0.06 | 11.89 | 0.01 | 10.04 | 0.01 | |
| 2456137.23325 | 56136.72792 | 15.48 | 0.04 | 11.87 | 0.01 | 10.02 | 0.01 | |
| GCC-b | 2456126.34712 | 56125.84120 | 15.53 | 0.04 | 12.03 | 0.04 | 10.21 | 0.03 |
| 2456132.37648 | 56131.87087 | 15.54 | 0.05 | 12.19 | 0.03 | 10.31 | 0.04 | |
| 2456136.43006 | 56135.92469 | 15.34 | 0.05 | 11.87 | 0.02 | 10.04 | 0.03 | |
| 2456137.23654 | 56136.73122 | 15.25 | 0.04 | 11.83 | 0.02 | 9.97 | 0.03 | |
| GCC-c | 2456126.34712 | 56125.84120 | 16.12 | 0.06 | 12.25 | 0.02 | 10.19 | 0.01 |
| 2456132.37648 | 56131.87087 | 16.33 | 0.11 | 12.25 | 0.01 | 10.13 | 0.01 | |
| 2456136.43006 | 56135.92469 | ⋅⋅⋅ | ⋅⋅⋅ | 12.38 | 0.01 | 10.24 | 0.01 | |
| 2456137.23654 | 56136.73122 | ⋅⋅⋅ | ⋅⋅⋅ | 12.40 | 0.01 | 10.28 | 0.01 | |
Download table as: ASCIITypeset image
2.2. Spectroscopy with Subaru/IRCS
In 2010 and 2012, we collected near-infrared spectra of our Cepheids at several epochs when possible using the Infrared Camera and Spectrograph (IRCS) attached to the Subaru 8.2 m telescope (Kobayashi et al. 2000). This instrument allows us to obtain high-resolution (λ/Δλ = 20, 000) echelle spectra in the near-infrared region. We observed GCC-a three times, GCC-b and -c twice, and GCC-d once. Most spectra were in the H band but one K-band spectrum of GCC-a was taken in 2010 June (Table 4). During the 2012 July run, we used the adoptive optics system, AO188, with laser star guiding (Hayano et al. 2010). Unfortunately, the AO-guided observations in the other runs (2010 June and 2012 May) were interrupted by instrumental problems and poor seeing conditions, and the quality of the spectra was poorer than that in 2012 July. Nevertheless, all data were usable in the radial velocity measurements.
Table 4. Log of Spectroscopic Observations
| UTCa | BJDb | Object | Band | Integrationsc | S/Nd |
|---|---|---|---|---|---|
| t1(s) × N | |||||
| 2010 June 21 09:30 | 2455368.90243 | GCC-a | K | 300 × 8 | 45 |
| 2012 May 26 14:00 | 2456074.08954 | GCC-a | H | 300 × 12 | 25 |
| 2012 May 26 11:00 | 2456073.96453 | GCC-b | H | 300 × 12 | 25 |
| 2012 May 26 12:40 | 2456074.03398 | GCC-c | H | 300 × 12 | 25 |
| 2012 July 27 07:30 | 2456135.81792 | GCC-a | H | 300 × 12 | 100 |
| 2012 July 27 09:00 | 2456135.88041 | GCC-b | H | 300 × 12 | 100 |
| 2012 July 28 08:00 | 2456136.83868 | GCC-c | H | 300 × 12 | 100 |
| 2012 July 28 10:40 | 2456136.94978 | GCC-d | H | 300 × 8 | 85 |
Notes. aCoordinated Universal Time (UTC) at around the middle of the observation. bBarycentric Julian Date calculated from the UTC. cDuration of each integration (t1) and the number N. dTypical signal-to-noise ratio at the continuum level.
Download table as: ASCIITypeset image
3. ANALYSIS
Data reduction of the spectra was performed by standard procedures, including background subtraction, wavelength calibration, and normalization using the Image Reduction and Analysis Facility (IRAF11). Wavelength calibration was based on the telluric absorption lines within individual target spectra. Spectra of each object in each run were combined into a single spectrum and normalized by the continuum level that can be reasonably traced. We retained the telluric absorption lines for redshift measurements, as explained below. Detailed plots of the target Cepheid spectra are compared in Figure 2. Clear differences are observed in the redshifts of the four objects.
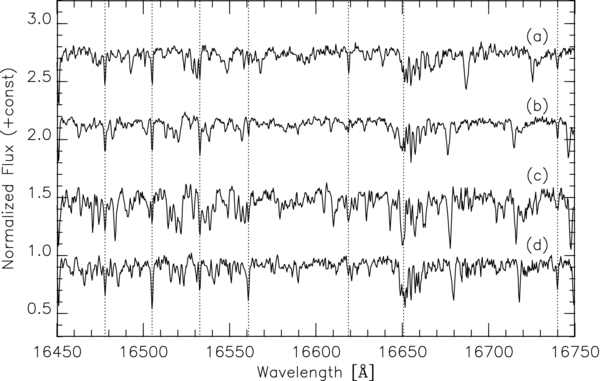
Figure 2. Detailed plot of the Subaru/IRCS spectra in the H band for four Cepheids (data collected in 2012 July). Vertical dotted lines indicate telluric lines used for wavelength calibration. Intrinsic absorption lines show different redshifts of the targets.
Download figure:
Standard image High-resolution imageTo estimate the radial velocities, we compared the observed spectra with synthetic spectra constructed by the tools ATLAS9 and SYNTHE developed by Kurucz (1993).12 They calculate plane-parallel atmospheric models and generate the synthetic spectra for a given stellar parameter set including the effective temperature Teff and the gravity log g. These tools do not take the pulsation into account, but we assume the validity of the quasi-static approximation for the Cepheid atmosphere (see, e.g., Molinaro et al. 2011). Line lists were extracted from the Vienna Atomic Line Database. Although these lists differ from the original list provided by Kurucz, the redshift estimates were essentially unaffected (the following results in our paper would remain unchanged within 1 km s−1). Figure 3 illustrates the method used to measure the redshifts; a telluric spectrum (1) constructed from an A-type star was convolved with a model spectrum (2) shifted by a trial velocity to construct a synthesized spectrum (3). The synthetic spectrum was then compared with (4) the observed spectrum. Each target spectrum was assigned the redshift that minimized the χ2 value of the difference between (3) and (4); the residual obtained by subtracting (3) from (4) is indicated in the lower panel of Figure 3. The reduced χ2 value is typically ∼25. Although some differences exist among the spectra of the four Cepheids and between the model and observed spectra, such differences were annulled by the many common absorption lines, thus exerting negligible effects on the radial velocity measurements. Therefore, for every spectrum, we applied the stellar model spectrum with the following parameter set: Teff = 5000 K, log g = 1.0, and Z = Z☉. We applied this method to each of the following ranges in five echelle orders: 17500–17870 Å in the order H32, 16960–17340 Å in H33, 16460–16840 Å in H34, 15980–16150 Å in H35, and 15680–15840 Å in H36. In case of the K-band spectrum of GCC-a, the following five ranges are used: 23920–24480 Å in K23, 22920–23480 Å in K24, 22000–22560 Å in K25, 21160–21680 Å in K26, and 20460–20780 Å in K27. The telluric absorption lines distributed in these ranges ensure well-calibrated wavelength scales. These spectral ranges yielded consistent velocities (within a few km s−1; see σV in Table 6), and the statistical error was estimated from the scattering in the measured velocities over the five ranges. The obtained velocities were then transformed into barycentric velocities, Vbary, and velocities relative to the local standard of rest (LSR), VLSR, assuming the standard solar motion (Crovisier 1978; Reid et al. 2009).

Figure 3. Illustration of the method used to measure the radial velocities. A telluric spectrum (1) constructed from an A-type star was convolved with a model spectrum (2) shifted by a trial velocity to construct a synthesized spectrum (3). This spectrum is compared with (4) the observed spectrum. The lower panel shows the difference between spectra (3) and (4).
Download figure:
Standard image High-resolution imageCepheid pulsations can alter the radial velocities measured at each epoch by tens of km s−1 (e.g., Pejcha & Kochanek 2012). First of all, we need the pulsational phase in each spectrum to discuss such variations. The pulsational phase is usually defined based on the optical V-band curves, but it is not possible to obtain the optical light curves of our targets because of severe extinction. Here, we define the zero phase at the H-band minimum. For our purpose, we require only the relative phase offsets between the H-band light curves and the radial velocity curves.
To obtain mean velocities of the target Cepheid, we first constructed a template of the velocity variations of the Cepheids with P ≃ 20 days. All of our targets have similar periods, but the prediction template is yet to be established. We adopted the infrared photometry and radial velocities of 11 nearby Cepheids with 18 ⩽ P ⩽ 24 days (Table 5) compiled by Groenewegen (2013). First, the H band and velocity curves of each template Cepheid were fitted by a seventh-order Fourier series, and the amplitude and the mean were obtained. Here we refer to the peak-to-peak amplitude of a Fourier series fit and the average of its maximum and minimum as the amplitude and the mean (or zero), respectively. Then, amplitude-normalized templates of the H band and velocity curves were constructed combining the data of the 11 Cepheids (Figure 4). Within the period range, the template Cepheids show similar variations in both H-band light and velocity. In addition, the amplitudes of the template H-band light curves are well correlated with those of the velocity curves, as shown in Figure 5. The amplitude ratio, ARV/AH = 135 km s−1mag−1, is taken as the mean value for the 11 template stars and the standard deviation is 19 km s−1mag−1. We can use this ratio to predict velocity amplitudes based on H-band light curves.
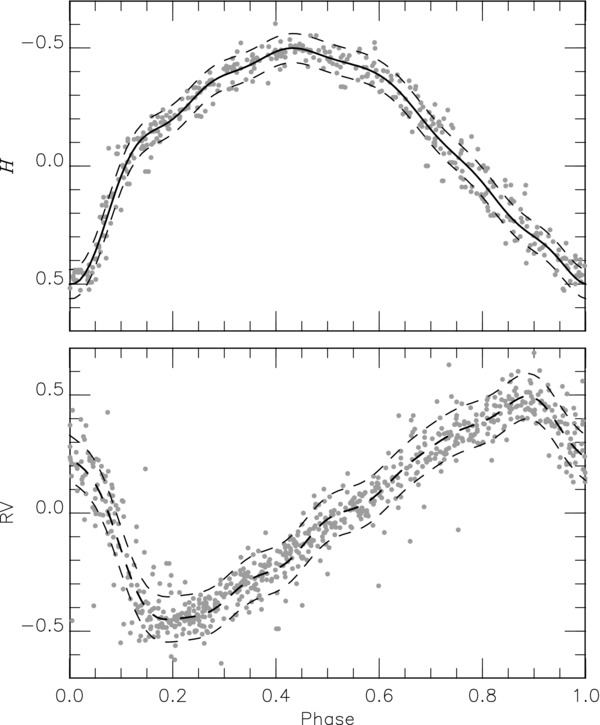
Figure 4. Normalized variations of H-band light curves and radial velocity curves for nearby Cepheids with P ≃ 20 days (Groenewegen 2013). Fitted template curves and the ±1σ ranges are indicated by solid and dashed curves, respectively.
Download figure:
Standard image High-resolution image
Figure 5. Velocity amplitude vs. amplitude of H-band light curves for nearby Cepheids with P ≃ 20 days (Groenewegen 2013). Object names and data sets used are stated in the text. The slope of the solid line was obtained as the average of ARV/AH values, and its standard deviation σ is indicated by the dotted lines.
Download figure:
Standard image High-resolution imageTable 5. Cepheids Considered for the Templates
| Object | Period | AH | ARV |
|---|---|---|---|
| (days) | (mag) | ( km s−1) | |
| YZ Aur | 18.193 | 0.38 | 54 |
| VY Car | 18.905 | 0.40 | 66 |
| RU Sct | 19.703 | 0.42 | 58 |
| VX Cyg | 20.133 | 0.41 | 58 |
| RY Sco | 20.320 | 0.29 | 41 |
| RZ Vel | 20.397 | 0.46 | 73 |
| WZ Sgr | 21.851 | 0.47 | 63 |
| BM Per | 22.952 | 0.60 | 59 |
| WZ Car | 23.013 | 0.55 | 62 |
| VZ Pup | 23.175 | 0.50 | 71 |
| SW Vel | 23.428 | 0.53 | 62 |
Notes. The peak-to-peak amplitudes of H-band light curves (AH) and those of velocity curves (ARV) are obtained by fitting a seventh-order Fourier series. References to the original photometric and spectroscopic data are listed in Table 1 of Groenewegen (2013).
Download table as: ASCIITypeset image
We estimated the H-band amplitudes and the pulsation phases of our target Cepheids in individual spectroscopic observations by fitting a seventh-order Fourier series to the light curves. The velocity amplitude ARV was estimated combining the AH and the amplitude ratio, and the mean velocity was obtained by shifting the velocity curve template multiplied by the predicted amplitude. When two or more measurements were available, the estimated mean velocities of each object were averaged. Figure 6 shows the template, which is vertically shifted to fit the measured values. Note that the amplitudes are predicted based on the amplitude ratio ARV/AH, rather than by fitting the black circles in Figure 6. Nevertheless, the predicted velocity curves adequately accommodate the measured velocities, particularly for GCC-a and -c. The estimated mean velocities are listed in Table 6 and indicated by horizontal lines in Figure 6.

Figure 6. Velocities at individual epochs indicated by filled circles are compared with the velocity curve templates. Panels (a), (b), (c), and (d) show the data for our targets GCC-a, -b, -c, and -d, respectively. Thick curves have the amplitudes obtained based on the amplitude ratio ARV/AH = 135 km s−1mag−1, while thin curves have those with the ratio larger by 30% (Nardetto et al. 2011; see the text). Horizontal lines indicate the estimated mean velocities, and thick dashed lines are given by the smaller amplitude ratio and dotted lines by the larger ratio.
Download figure:
Standard image High-resolution imageTable 6. Measured Radial Velocities of the Cepheids
| Object | BJD | Phase | Vbary | VLSR | ΔV | σV |
|---|---|---|---|---|---|---|
| ( km s−1) | ( km s−1) | ( km s−1) | ( km s−1) | |||
| GCC-a | 2455368.90243 | 0.62 | +121.1 | +128.9 | −7 | 2.1 |
| 2456074.08954 | 0.59 | +125.0 | +132.7 | −4 | 1.9 | |
| 2456135.81792 | 0.22 | +97.3 | +105.1 | +25 | 1.4 | |
| Mean | +119 | +127 | ||||
| GCC-b | 2456073.96453 | 0.13 | −75.6 | −68.0 | +17 | 6.2 |
| 2456135.88041 | 0.23 | −95.8 | −88.1 | +24 | 0.8 | |
| Mean | −66 | −58 | ||||
| GCC-c | 2456074.03398 | 0.93 | −67.2 | −59.5 | −24 | 2.5 |
| 2456136.83868 | 0.69 | −71.8 | −64.2 | −15 | 1.4 | |
| Mean | −89 | −81 | ||||
| GCC-d | 2456136.94978 | 0.18 | −38.1 | −30.5 | +21 | 0.8 |
| Mean | −17 | −9 | ||||
Notes. The barycentric velocities (Vbary) and velocities relative to the LSR (VLSR) are listed at individual epochs; each velocity was calculated from measurements over five echelle orders and the standard error σV of the measurements is also listed. Velocities for each object are averaged after correcting for the pulsational effects (ΔV).
Download table as: ASCIITypeset image
The uncertainty in predicting the amplitude ratio, ARV/AH, introduces the largest error in our correction of the pulsation effect. First, the standard deviation in Figure 5 leads to an error of 7.6 km s−1 in predicted velocity amplitude considering that the H-band amplitudes of our Cepheids are approximately 0.4 mag. In addition, there can be a systematic difference between the velocity amplitudes from optical spectroscopic data and the counterparts from infrared data. While the ARV for the temperate Cepheids were obtained with optical spectra, our spectra for the target Cepheids are in the infrared. Nardetto et al. (2011) found that the velocity amplitude of ℓ Car (P = 35.56 days) from infrared K-band absorption lines is 1.3 times larger than that from optical absorption lines based on their four-epoch spectroscopic observations using CRIRES at Very Large Telescope. If this is true for our target Cepheids with AH ∼ 0.4 mag, we should consider the velocity amplitude 70 km s−1 rather than 55 km s−1. The difference, if any, between the velocity curves from optical, H- and K-band absorption lines is not established. Unfortunately, our spectroscopic observations are too few to determine the amplitudes. Thin curves in Figure 6 indicate fits obtained by assuming the larger amplitude ratio. Two horizontal lines in each panel indicate how the estimated mean velocity is affected by the amplitude ratio. The effect is small in the case of GCC-a, which has two measurements around the mean, and the three points slightly prefer the predicted curve with the smaller amplitude ratio. The mean velocities of the others get offset by ∼7 km s−1. Velocity curves of Cepheids obtained with infrared spectra and their difference from those obtained with optical spectra should be investigated with more data as Nardetto et al. (2011) also suggested. We here adopt the results with the smaller amplitude ratio and they are listed in Table 6. Considering the above uncertainties, the velocity amplitudes are expected be between ∼45 km s−1 and ∼80 km s−1 for a Cepheid with AH = 0.4 mag. Since we adopted 55 km s−1, this range introduces an error of ±13 km s−1 in mean velocity because the mean estimate is affected by half the change of the velocity amplitude if a measured velocity is obtained at the extreme.
4. DISCUSSION
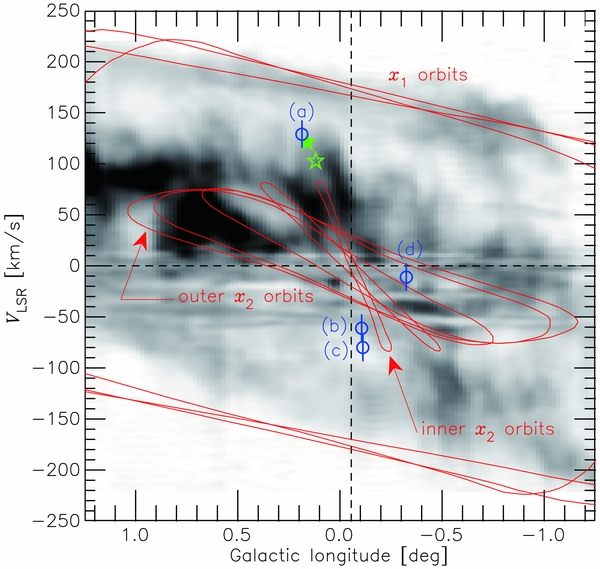
Figure 7 plots the VLSR of the Cepheids against the Galactic longitude. The longitude and VLSR of GCC-a are both positive, whereas those of GCC-b, -c, and -d are negative. This result is consistent with the prediction that the Cepheids orbit around Sgr A* similar to other objects in the NSD. The solid curves in Figure 7 are extracted from Figure 1 in Stark et al. (2004) and indicate several x1 and x2 orbits from the model of Bissantz et al. (2003). Their model adopts the bar gravitational potential constructed from photometric data collected by the COBE satellite (Bissantz & Gerhard 2002).
Figure 7. Velocities relative to the LSR (VLSR) of our four Cepheids are plotted against the Galactic longitude (open circles). The error bars have the size of 13 km s−1, which is discussed in the text. The velocities and locations of the Arches and Quintuplet clusters are indicated by open and filled star symbols, respectively. The x1 and x2 orbits calculated by Bissantz et al. (2003) are taken from Figure 1 of Stark et al. (2004) and indicated by solid curves. The background displays the l–v diagram of the CO J = 1–0 emissions taken from Oka et al. (1998).
Download figure:
Standard image High-resolution image
Examining the l–v diagram, we find that GCC-b and -c follow inner x2 orbits, whereas GCC-d follows an outer x2 orbit. GCC-b and -c are close to each other not only in projected position but also in radial velocity. The error of their estimated distances is ±500 pc, which does not allow us to determine their line-of-sight positions within the NSD (radius ∼200 pc). It is tempting to argue that the two stars could have been formed in the same star-forming event, but their proper motions and three-dimensional (3D) velocities are required to confirm the similarity in the kinematics and to further investigate their possible association.
In contrast, the velocity VLSR of GCC-a (127 km s−1), is larger than the expected velocities for x2 orbits (<80 km s−1) at its projected distance of 30 pc from Sgr A*. The x2 orbits depend on the mass distribution within the NSD, which is dominated by stars rather than the central supermassive black hole, except at the very center (Launhardt et al. 2002). The mass enclosed within a circular orbit of a radius 30 pc and velocity of 130 km s−1 is 2.5 × 10⁸ M☉, more than twice that predicted by the mass distribution constructed from infrared photometric data (Bissantz & Gerhard 2002; Launhardt et al. 2002). The kinematics of OH/IR stars and SiO masers are consistent with the smaller mass (Lindqvist et al. 1992; Deguchi et al. 2004). On the other hand, the location and velocity of GCC-a approximates those of the Arches and Quintuplet clusters, although the two clusters, ∼4 Myr, are much younger than GCC-a, ∼25 Myr. The radial velocities of these clusters, plotted in Figure 7, are taken from Figer et al. (2002) and Liermann et al. (2009). It is known that these clusters have large proper motions and do not follow closed x2 orbits (Stolte et al. 2008, 2014). Stolte et al. suggested that these clusters are following transitional trajectories between x1 and x2 orbits. Although the proper motion is necessary to compare their 3D kinematics, GCC-a may have followed a motion similar to those of the two clusters when it was young and may not yet have settled into a circular orbit. Notably, Lindqvist et al. (1992) and Deguchi et al. (2004) reported objects with similarly large velocities, and large-velocity molecular clouds are evidenced in the CO emission in the background of Figure 7 (Oka et al. 1998). In summary, despite the unavailability of proper motions, we can infer that the four Cepheids are rotating within the NSD, although not necessarily along closed orbits.
According to our results, the Cepheids are not only currently located within the NSD but most likely formed therein. To investigate the birth sites of NSD stars, we investigated their dynamical histories in a N-body/SPH simulation of the Galaxy (J. Baba et al., in preparation). This simulation self-consistently accounts for the stellar dynamics, self-gravity of the gas, radiative cooling, heating by interstellar far-ultraviolet radiation, energy feedback from supernova explosions, and H ii regions. In several simulation runs, we identified star particles aged 20–30 Myr in the NSD and traced their motions to 100 Myr ago, when they existed as gas clouds. At ∼75 Myr before star formation, i.e., during the gas cloud phase, some of the tracked particles had reached the CMZ while others were moving along the bar. However, all these clouds were trapped within the CMZ at the time of star formation. Star formation was scarce along the bar but common within the CMZ, consistent with the simulations of Kim et al. (2011).
5. SUMMARY
We conducted infrared spectroscopic observations of classical Cepheids near the Galactic center. From the measured radial velocities of the Cepheids, we inferred that they orbit within the NSD in a manner similar to other contained objects. Preliminary simulation suggested that these Cepheids formed in the same disk region 20–30 Myr ago and may have undergone several rotations rather than becoming trapped in the disk after birth. The orbits of the Cepheids should be further investigated once the proper motions become available, and a detailed study on their kinematics would provide important clues on stellar formation and dynamical evolution in the NSD region. Furthermore, by investigating the chemical abundance of these objects, we could elucidate the chemical evolution in and around this region; this topic is left for future study.
We acknowledge the anonymous referee for many useful comments that improved the manuscript. We express our thanks to Takahiro Naoi, Nagisa Oi, and Tatsuhito Yoshikawa who collected additional IRSF photometric data for our targets. We are also grateful to Subaru support astronomers Miki Ishii, Yosuke Minowa, and Tae-Soo Pyo for their help during our Subaru observations in 2010 and 2012. Martin Groenewegen provided the data set for nearby template Cepheids that were published in 2013. A part of this paper was written in a hospital in Cape Town, South Africa, where the first author, N.M., was treated after his accidental fall in the IRSF dome on 2014 May 3. N.M. is grateful to everyone, in both South Africa and Japan, who rescued and supported him after the accident; especially to Patricia Whitelock, John Menzies, Michael and Connie Feast, and Rie Matsunaga for their warm support. This work has been supported by Grants-in-Aid for Scientific Research (Nos. 22840008, 23684005, and 26287028) from the Japan Society for the Promotion of Science (JSPS).
Facilities: IRSF - Infrared Survey Facility, Subaru - Subaru Telescope
Footnotes
- 11
IRAF is distributed by the National Optical Astronomy Observatory, which is operated by the Association of Universities for Research in Astronomy (AURA) under cooperative agreement with the National Science Foundation.
- 12