


ABSTRACT
We present a new scenario to explain the soft X-ray excess in an active galactic nucleus (AGN). Magnetic reconnection could happen in a thin layer on the surface of an accretion disk. Electrons are accelerated by a shock wave and turbulence is triggered by magnetic reconnection. Inverse Compton scattering then takes place above the accretion disk, producing soft X-rays. Based on the standard disk model, we estimate the magnetic field strength and the energy released by magnetic reconnection along the accretion disk and find that the luminosity arising from magnetic reconnection is mostly emitted in the inner disk, which is dominated by radiation pressure. We then apply the model to fit the spectra of AGNs with strong soft X-ray excess.
Export citation and abstract BibTeX RIS
1. INTRODUCTION
Soft X-ray excess is a major component of many Type 1 active galactic nuclei (AGNs), especially Narrow Line Seyfert 1 (NLS1) galaxies (e.g., Boller et al. 1996; Laor et al. 1997). Below 1 keV in the X-ray band, the X-ray data are above the low energy extrapolation of the best-fitting 2–10 keV power law characterized by a power law index of Γ ∼ 2.0 (Gondhalekar et al. 1997); this is so-called soft X-ray excess. Historically, the soft X-ray excess has often been fit using a blackbody model, yielding best-fit temperatures in the range of 0.1–0.2 keV (Czerny et al. 2003; Gierliski & Done 2004). The standard disk model (Shakura & Sunyaev 1973) gives a maximum effective temperature of the accreting material of  eV, where
  is the accretion rate in units of the Eddington accretion rate (i.e.,
  ) and m8 = M/108 M☉. However, according to this model, assuming a high accretion rate and low-mass black holes, the peak of the accretion disk blackbody spectrum is just 0.1 keV. Current observations show, however, that the black hole mass of a source with a soft X-ray excess exceeds 106 M☉ (Crummy et al. 2006). Because different NLS1 galaxies have different masses and accretion rates, it is difficult to maintain a stable temperature within a range of 0.1–0.2 keV for the blackbody spectrum of the accretion disk. For the standard disk model, it is difficult to explain these properties (Turner & Pounds 1989; Done et al. 2012).
From the analysis of the soft X-ray data, it is found that strong emission and absorption features appear in the soft X-ray spectra of most AGNs. As discussed in Gierliski & Done (2004), the imprint of spectral features such as the strong jump in opacity at ∼0.7 keV from O vii, O viii, and the Fe M-shell can lead to an apparent soft excess below this energy. However, the problem is that some parts of the soft excess are often smooth and certain predicted features are not evident. Schurch & Done (2007, 2008) computed the X-ray spectra of outflowing gas with density and velocity, demonstrating that a high outflow velocity would be required if absorption in outflows solely explains the soft excesses observed in AGN spectra. A high velocity of 0.9c even exceeds the speeds of the relativistic wind components detected through energy-shifted absorption lines. Schurch et al. (2009) found that the models of line-driven accretion-disk winds do not attain sufficiently high velocities.
The origin of the soft X-ray excess in AGNs is as yet unknown. We try to explore a new radiation mechanism by considering the role of the magnetic field in accretion disks. We present a new scenario as follows: magnetic reconnection could happen in a thin layer on the surface of the accretion disk as in a solar active region (Kurtz 1984). Electrons are accelerated by the shock wave and turbulence is triggered by magnetic reconnection (Kirk et al. 1994). These electrons then emit X-rays through Compton scattering with photons from the accretion disk. In Section 2, we estimate the magnetic field and the energy released by magnetic reconnection in accretion disks to show whether the released magnetic energy is sufficient to produce the soft X-ray excess. In Section 3, we depict the radiative processes and obtain the Compton spectrum. In Section 4, we apply a new model to AGNs with strong soft X-ray excesses. Finally, Section 5 summarizes our main results and presents our conclusions.
2. THE MAGNETIC FIELD AND ENERGY RELEASE
We assume that magnetic reconnection emerges frequently in a thin layer on the surface of the standard accretion disk. In previous works, the magnetic field B was calculated adopting the equipartition of gas energy and magnetic energy in the disk given by Miller & Stone (2000): ξ ≡ ndiskkTdisk/(B2/8π). This result is not a useful guide, however, because the authors ignore radiation, assume an isothermal equation of state, and do not show how the magnetic field scales in the radiation-dominated regime. In fact, it is unclear why the magnetic energy density should scale as a constant fixed ratio of the midplane gas pressure. The best numerical simulations have been done by Hirose et al. (2009a, 2009b) and Blaes et al. (2011). Their simulations show that the vertically averaged rms of the magnetic field scales as the square root of the total (gas + radiation) pressure, i.e.,

where a = 7.564 × 10⁻¹⁵ erg cm−3 K−4. Figure 1 shows the distribution of the magnetic field versus the radius of the accretion disk in units of RS with the parameters α = 0.1, ξ = 1, and 108 M☉. It is shown that the magnetic field rapidly declines along the radius of the accretion disk inside about 20 RS, but is relatively flat outside 20 RS. The different curves are calculated at accretion rates of  = 0.01, 0.1, and 1, respectively (
 has units of the Eddington accretion rate). The magnetic field in the inner disk is stronger than that in the outer disk, implying that the magnetic energy is mainly deposited in the inner disk. We calculate the energy released by fast magnetic reconnection on the accretion disk, in which the magnetic dissipation scales as B2VA, where VA is the Alfvén speed. But it has an upper limit near the disk surface, which is limited by the Poynting flux (see Figure 2) as (Hirose et al. 2006)

where the factor f represents the departure from hydrostatic balance that permits the upward motion and cs is the sound velocity. From Figure 2, we know that the Poynting flux rapidly decreases from the innermost steady radius to 20 RS. Because the gas pressure is far less than the radiation pressure inside 20 RS, the Poynting flux is approximately given by
where RS is the Schwarzschild radius. Assuming that almost all the energy released by magnetic reconnection is converted to soft X-ray radiation energy, we can estimate the maximum soft X-ray luminosity by integrating the Poynting flux from the inner radius to 20 RS as

Figure 1. Magnetic field strength vs. the radius of the accretion disk in unit of RS with α = 0.1, ξ = 1, and 108 M☉. The dashed, solid, and dotted lines correspond to  of 1, 0.1, and 0.01, respectively.
Download figure:
Standard image High-resolution image
Figure 2. Solid and dotted lines represent the Poynting flux with α = 0.1, ξ = 1, 108 M☉,  , and α = 0.1, ξ = 1, 108 M☉,
  , respectively. The dashed line represents the Poynting flux with α = 0.1, ξ = 1, 109 M☉,
  .
.
Download figure:
Standard image High-resolution image3. THE RADIATIVE PROCESSES
3.1. The Electron Spectrum
Considering that electrons are accelerated by shock waves and turbulence in magnetic reconnection, we can obtain the electron energy spectrum as (Droege & Schlickeiser 1986)

where the electron spectrum index is
and the parameters η, a, λ, and b are determined by the microcosmic structure of the shock wave and turbulence expressed as follows (Bogdan & Schlickeiser 1985; Droege & Schlickeiser 1986):
where a = α1VS2/α2VA2, λ = κ/α2VA2T0. When the electrons are not accelerated to high energies for fast magnetic reconnection, the electron spectrum will become a power law with constant index (Droege & Schlickeiser 1986), given by

E1 and E2 are the cutoffs in the spectrum. When E2 ≫ E1 and q > 1, the factor A is given by  , in which Ne is the number density of electrons. The kinetic energy E of non-relativistic electrons is expressed as E = (γ − 1)mec2, in which
  and βc are the Lorentz factor and velocity of the electron, respectively. When E ≪ mec2,
  .
.
3.2. Comparison of Electron Energy Losses through Bremsstrahlung and Compton Radiation
The electrons in the magnetic field produce Bremsstrahlung, inverse Compton scattering, and synchrotron emission. Because the electrons are non-relativistic, we can ignore synchrotron radiation. Next, we will compare the electron energy losses through Bremsstrahlung and Compton radiation.
The energy loss rate due to Compton radiation of an electron with energy E is given by (Blumenthal & Gould 1970):
where σT is the Thompson cross section and Uph is the energy density of soft photons. The total energy loss rate of the non-thermal electrons is given by
The energy loss rate due to Bremsstrahlung radiation of an electron with energy E is given by (Gould 1980)
αf = 1/137 is the fine structure constant, and nZ is the number density of the ion. The total energy loss rate is
Then, we have
where np = ∑nZZ2,
and
In the accretion disk, where  , Teff is the effective temperature of the disk, σ is the radiation constant, and np is the number density of the proton, we obtain
where r = R/3Rs,  , and
, and  is the Eddington accretion rate. Because H1(β1, β2) > H2(β1, β2), Pc ≫ Pb in the inner region of the accretion disk for the larger accretion rate, indicating that the Compton radiation of electrons dominates the Bremsstrahlung radiation.
3.3. Compton Radiation
Because the magnetic field decreases along the radius of the accretion disk, the parameters of accelerated electrons will change with radius. Assuming that E1, E2, and q are independent of the magnetic field, we can estimate the number density of electrons along the radius. Assuming that the energy loss rate of electrons equals the magnetic dissipation, i.e., Pc = B2VA/8πhr, in which hr is the characteristic scale of reconnection, we obtain

When an electron is not accelerated to a high energy, the Compton spectrum in the Thomson limit given by Blumenthal & Gould (1970) for a relativistic electron should be changed as
where n( )d represents the differential photon density, 1 is the energy of the scattered photon, and the electron has an energy E = (γ − 1)mec2 and a velocity βc. When β → 1, the above formula returns to the Compton spectrum produced by a high-energy electron in the Thomson limit (Blumenthal & Gould 1970). We note that the above distribution function equals zero at β* = (1/ − 1)(1/ + 1)−1. Since the differential number of electrons is dN = AE−qdE, the total Compton spectrum is given by
where dγ = γ3βdβ, βmin = max [β*, β1], βmax = β2, β1, and β2 correspond to the energy cutoffs E1 and E2 in the electron spectrum. For the soft photons in the accretion disk, the differential photon density n(, R)d in a radius R is given by
where T(R) is the temperature of the disk surface at a radius R. We then obtain the Compton spectrum along the radius
where
and 0 is given by (1/0 − 1)(1/0 + 1)−1 = β2, e.g., 0 = 1(1 − β2)/(1 + β2). In fact, H(1/, q) can be simplified as
The total Compton radiation spectrum is given by
where we take Rin = 3 RS and Rout = 20 RS for the radiation-dominated region of the accretion disk, and B2VA/Uph is given by
where we use the structure of the accretion disk as
and m8 = M/108 M☉.
Finally, we obtain

where  , and
, and
where kT0 = 2.0 × 10⁻²(αm8)−1/4, which corresponds to the temperature of the inner stable radius of the accretion disk, and rout = 20/3. The curves of  with
with  for the parameters of q, β1, β2, and kT0 are shown in Figures 3–5.
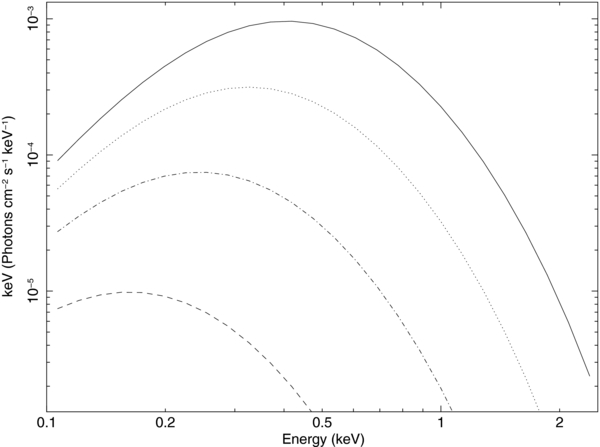
Figure 3. Spectral shapes with different kT0, in which the dashed, dash-dotted, dotted, and solid lines correspond to kT0 = 0.04, 0.06, 0.08, and 0.1 keV, respectively. q = 2, β1 = 0.02, and β2 = 0.196.
Download figure:
Standard image High-resolution image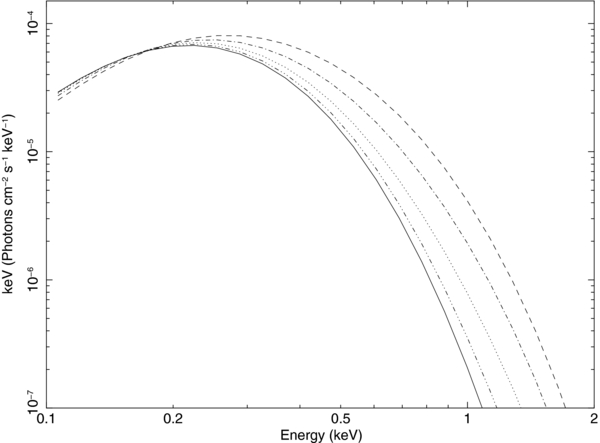
Figure 4. Spectral shapes with different q, in which the dashed, dash-dotted, dotted, and solid lines correspond to q = 1, 2, 3, 4, and 5, respectively. kT0 = 0.05 keV, β1 = 0.02, and β2 = 0.196.
Download figure:
Standard image High-resolution image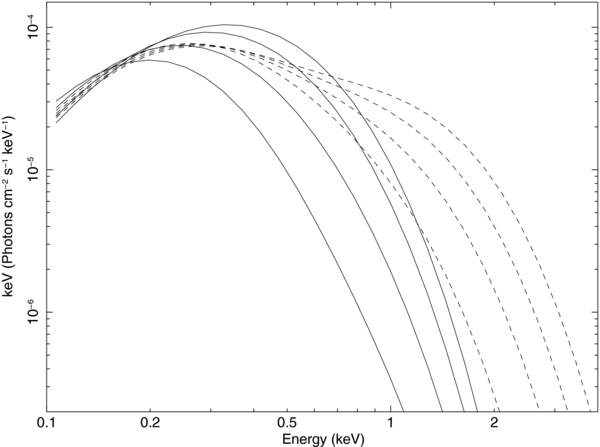
Figure 5. Spectral shapes with different β1 and β2. Solid lines from bottom to top (above 0.5 keV) correspond to β1 = 0.002, 0.020, 0.059, and 0.098, respectively, when β2 = 0.196. Dotted lines from bottom to top (above 0.5 keV) correspond to β2 = 0.391, 0.587, 0.783, and 1, respectively, when β1 = 0.02. kT0 = 0.05 keV, and q = 2 are adopted.
Download figure:
Standard image High-resolution image4. MODEL APPLICATION
In this section, we apply the model to fit the X-ray spectra (EPIC-pn of XMM-Newton data) of AGNs (PG quasars and NLS1 galaxies) with high-mass accretion rates given by Crummy et al. (2006, see Table 1). The soft X-ray radiation of these objects includes thermal radiation and inverse Compton scattering. The Compton spectrum caused by magnetic reconnection is added in XSPEC v12.7.1 (Arnaud 1996) through the initpackage and lmod codes. As these samples have different black hole masses and accretion rates, different temperatures of the blackbody spectrum of the accretion disks appear. According to the standard disk model, for high accretion rate and low-mass black holes, the peak of the accretion disk blackbody spectrum can occur in an X-ray band and we need to add the blackbody model in spectral fitting. Because the radiation of the accretion disk is a multi-temperature blackbody spectrum, we use the diskbb model of XSPEC to fit the thermal spectrum. A power law with a spectral index Γ is used to fit the hard X-ray component because the hard X-ray radiation is considered to be from inverse Compton scattering in the accretion disk corona (Liu et al. 2002). For some sources with low black hole masses and high accretion rates, the thermal radiation of the accretion disk partly contributes to the soft X-rays. We use the mixing model absorption (diskbb + compton + powerlaw) to fit the soft excess and use the newpar code to link kT0 and the temperature of the inner stable radius of diskbb. For other sources with high black hole masses and low accretion rates, the thermal radiation can be ignored due to the low blackbody temperature to radiate soft X-rays; we use the mixing model absorption (compton + powerlaw) to fit the soft excess. In the Compton model, there are four parameters that determine the spectrum: kT0, q, β1, and β2. The fitting parameters are listed in Table 2 and the fitting spectra are shown in Figures 6 and 7. Then, we can estimate ξ by equating the observed soft X-ray luminosity with the Compton luminosity obtained by integrating Equation (26) from 0.1 keV to 5 keV. Combining Equation (4) which gives the maximum of the soft X-ray luminosity, we can estimate the maximum magnetic energy conversion rate. We take f = 0.1 because the mean growing speed of magnetic structures is 0.1cs (Hirose et al. 2006). The results are listed in Table 3.

Figure 6. Fitting spectra. The black crosses are the data points; the solid line is the best fit to the data. The dotted line shows the inverse Compton scattering component from the disk and the dashed line is the power-law component from the corona.
Download figure:
Standard image High-resolution image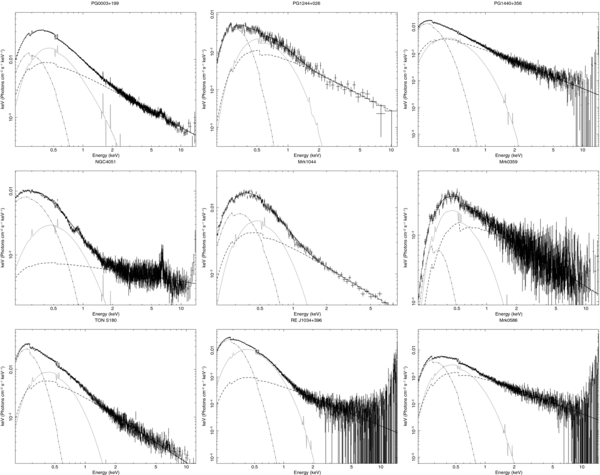
Figure 7. Fitting spectra with the blackbody component. The black crosses are the data points, and the solid line is the best fit to the data. The dotted and dash-dotted lines show the inverse Compton scattering component and the blackbody component from the disk, respectively. The dashed line is the power-law component from the corona.
Download figure:
Standard image High-resolution image
Table 1. Source Properties of AGNs Analyzed
| Source | z | logM/M☉ | L/LEdd | Observation ID |
|---|---|---|---|---|
| PG 0003+199 | 0.025 | 7.07 | 0.62 | 0306870101 |
| PG 0844+349 | 0.064 | 7.66 | 0.41 | 0554710101 |
| PG 0947+396 | 0.206 | 8.46 | 0.14 | 0111290101 |
| PG 0953+414 | 0.239 | 8.52 | 0.58 | 0111290201 |
| PG 1048+342 | 0.167 | 8.14 | 0.25 | 0109080701 |
| PG 1116+215 | 0.177 | 8.41 | 0.74 | 0111290401 |
| PG 1202+281 | 0.165 | 8.37 | 0.11 | 0109080101 |
| PG 1211+143 | 0.080 | 7.81 | 1.14 | 0112610101 |
| PG 1244+026 | 0.048 | 6.24 | 3.97 | 0051760101 |
| PG 1307+085 | 0.155 | 8.50 | 0.24 | 0110950401 |
| PG 1309+355 | 0.184 | 8.20 | 0.33 | 0109080201 |
| PG 1322+659 | 0.168 | 7.74 | 0.81 | 0109080301 |
| PG 1352+183 | 0.158 | 8.20 | 0.29 | 0109080401 |
| PG 1402+261 | 0.164 | 7.76 | 1.24 | 0109081001 |
| PG 1427+480 | 0.221 | 7.86 | 0.57 | 0109080901 |
| PG 1440+356 | 0.077 | 7.28 | 1.07 | 0107660201 |
| PG 1444+407 | 0.267 | 8.17 | 0.71 | 0109080601 |
| PG 1501+106 | 0.036 | 8.23 | 0.12 | 0070740301 |
| NGC 4051 | 0.002 | 6.13 | 0.31 | 0157560101 |
| MRK 1044 | 0.016 | 6.23 | 1.25 | 0112600301 |
| MRK 0359 | 0.017 | 6.23 | 1.79 | 0112600601 |
| RE J1034+396 | 0.042 | 6.45 | 0.28 | 0561580201 |
| PKS 0558−504 | 0.137 | 7.65 | 1.72 | 0125110101 |
| MRK 0586 | 0.155 | 7.86 | 3.37 | 0048740101 |
| TON S180 | 0.062 | 7.06 | 2.98 | 0110890401 |
Note. Mass and luminosity are taken from Middleton et al. (2007).
Download table as: ASCIITypeset image
Table 2. The Fitting Results of the Sources
| Source | nH | kT0 | β1 | β2 | q | Γ | Reduced χ2(dof) |
|---|---|---|---|---|---|---|---|
| PG0003+199 | 2.83 | 0.07 | 0.053 | 0.770 | 3.60 | 1.92 | 1.294(973) |
| PG0844+349 | 2.32 | 0.05 | 0.063 | 0.571 | 3.35 | 0.97 | 0.995(297) |
| PG0947+396 | 2.22 | 0.03 | 0.028 | 1 | 3.14 | 1.97 | 0.946(866) |
| PG0953+414 | 0.90 | 0.01 | 0.066 | 1 | 1.01 | 2.32 | 0.966(871) |
| PG1048+342 | 1.20 | 0.08 | 0.002 | 0.461 | 1.82 | 1.68 | 0.927(412) |
| PG1116+215 | 1.78 | 0.04 | 0.027 | 1 | 3.25 | 2.31 | 0.951(928) |
| PG1202+281 | 1.03 | 0.04 | 0.074 | 1 | 3.68 | 1.65 | 1.003(598) |
| PG1211+143 | 3.26 | 0.02 | 0.007 | 1 | 2.85 | 2.06 | 1.164(1028) |
| PG1244+026 | 7.68 | 0.04 | 0.098 | 0.493 | 1.00 | 2.42 | 1.234(208) |
| PG1307+085 | 10.51 | 0.01 | 0.046 | 0.561 | 4.11 | 1.72 | 1.545(230) |
| PG1309+355 | 3.63 | 0.01 | 0.026 | 0.767 | 2.12 | 1.75 | 1.147(284) |
| PG1322+695 | 1.36 | 0.04 | 0.025 | 0.489 | 2.58 | 2.15 | 1.058(450) |
| PG1352+183 | 2.08 | 0.04 | 0.016 | 0.622 | 2.64 | 2.02 | 1.104(435) |
| PG1402+261 | 0.25 | 0.04 | 0.047 | 1 | 3.27 | 2.12 | 0.972(667) |
| PG1427+480 | 3.91 | 0.01 | 0.045 | 1 | 4.25 | 2.24 | 1.270(494) |
| PG1440+356 | 3.46 | 0.04 | 0.080 | 0.366 | 1.56 | 2.46 | 1.006(680) |
| PG1444+407 | 2.07 | 0.03 | 0.006 | 0.678 | 2.70 | 2.31 | 1.122(297) |
| PG1501+106 | 1.16 | 0.05 | 0.055 | 1 | 3.54 | 1.80 | 0.974(818) |
| NGC4051 | 1.04 | 0.10 | 0.035 | 0.362 | 2.95 | 1.25 | 2.051(1121) |
| Mrk1044 | 3.44 | 0.08 | 0.062 | 0.196 | 5.00 | 2.02 | 1.387(185) |
| Mrk0359 | 7.66 | 0.04 | 0.031 | 0.608 | 2.79 | 1.92 | 1.004(877) |
| REJ1034+396 | 4.90 | 0.04 | 0.098 | 0.290 | 1.42 | 2.50 | 1.196(746) |
| PKS0558−504 | 3.60 | 0.04 | 0.027 | 0.608 | 2.92 | 2.25 | 1.108(712) |
| Mrk0586 | 6.89 | 0.04 | 0.090 | 0.312 | 1.09 | 2.35 | 1.212(776) |
| TON S180 | 4.09 | 0.04 | 0.077 | 0.418 | 1.57 | 2.39 | 1.272(685) |
Notes. nH is in units of 1020 cm−2, kT0 is the temperature of the inner stable radius of the accretion disk (in units of keV), and Γ is the hard X-ray spectrum index.
Download table as: ASCIITypeset image
Table 3. The Parameters Estimated by the Model
| Source | Lsoft(× 1044) | ξ | Ratio (%) |
|---|---|---|---|
| PG0003+199a | 0.55 | 13.00 | 4.34 |
| PG0844+349b | 3.78 | 4.13 | 10.90 |
| PG0947+396b | 2.55 | 6.14 | 27.50 |
| PG0953+414b | 7.77 | 2.96 | 8.69 |
| PG1048+342b | 1.07 | 48.27 | 6.03 |
| PG1116+215b | 5.00 | 3.87 | 6.21 |
| PG1202+281b | 2.22 | 6.65 | 33.89 |
| PG1211+143b | 0.16 | 19.00 | 0.82 |
| PG1244+026b | 0.36 | 15.04 | 0.66 |
| PG1307+085b | 0.36 | 5.33 | 3.39 |
| PG1309+355b | 0.46 | 6.33 | 2.30 |
| PG1322+695b | 2.21 | 6.00 | 4.80 |
| PG1352+183b | 1.85 | 7.32 | 12.36 |
| PG1402+261b | 2.70 | 5.25 | 3.30 |
| PG1427+480b | 2.00 | 2.22 | 1.93 |
| PG1440+356b | 1.00 | 9.35 | 3.02 |
| PG1444+407b | 2.60 | 4.96 | 4.71 |
| PG1501+106b | 0.57 | 20.07 | 26.71 |
| NGC4051a | 0.015 | 146.80 | 2.82 |
| Mrk1044a | 0.16 | 120.84 | 7.69 |
| Mrk0359c | 0.07 | 46.08 | 0.86 |
| REJ1034+396 | ... | ... | ... |
| PKS0558−504d | 68.1 | 0.59 | 4.24 |
| Mrk0586c | 3.55 | 4.43 | 1.29 |
| TON S180a | 68.1 | 0.53 | 2.46 |
Notes. Lsoft is the observed luminosity. aLuminosity taken from Grupe et al. (2010). bLuminosity taken from Piconcelli et al. (2005). cLuminosity taken from NED (http://ned.ipac.caltech.edu/). dLuminosity taken from Mahony et al. (2010), and the ratio is the magnetic energy conversion rate.
Download table as: ASCIITypeset image
5. DISCUSSION AND CONCLUSIONS
The soft X-ray excess is a major component of the X-ray spectra in many AGNs and is usually well fit with a blackbody that has a roughly constant temperature of 0.1–0.2 keV over several decades in AGN mass. If the soft X-rays are thermal, their temperature is too high to be explained by the standard accretion disk model. Although a high temperature can occur in a slim accretion disk (Mineshige et al. 2000), its accretion rate is super-Eddington (Tanaka et al. 2005) and extreme ultraviolet photons are Comptonized (Porquet et al. 2004). Strong emission and absorption features are found in the soft X-ray spectra of most AGNs. There is a strong jump in opacity at 0.7 keV from partially ionized material, where O vii/O viii and the Fe M-shell unresolved transition array are combined to produce an apparent soft excess that is not intrinsic in two different geometries, either by reflection from optically thick material out of the line of sight, or through absorption by optically thin material in the line of sight. However, both geometries would show characteristic and sharp atomic features that can be smeared by strong relativistic effects in the reflection model, but the parameters required are quite extreme; the disk has to extend to the last stable orbit in the high spin black hole and the reflection has to be highly concentrated in the innermost regions (Crummy et al. 2006). Reflection off the surface of the accretion disk was proposed by Fabian et al. (2002) to explain the soft excess, in which the primary X-rays go through substantial reprocessing in the upper layers of the disk and emerge as a smooth spectrum due to relativistic blurring. Some sources are explained by disk reflection, such as Mrk 335 (Larsson et al. 2008), Mrk 478 (Zoghbi et al. 2008), Fairall 9 (Schmoll et al. 2009; Emmanoulopoulos et al. 2011), and Ark 120 (Nardini et al. 2011). A self-consistent, dual-reflector model is needed to explain the soft excess of TonS180 at different epochs (Nardini et al. 2012). Recently, intensity-correlated spectral analysis was developed to constrain the origin of the soft X-ray excess in several AGNs (Noda et al. 2011, 2013), in which multi-zone Comptonization is required to interpret a stable soft excess component that is independent of the dominant power-law emission. Mehdipour et al. (2011) and Petrucci et al. (2013) find that the soft X-ray excess emission varies in association with the UV emission and is independent of the X-ray power-law component based on the UV and X-ray observations of Mrk 509. A long-look Suzaku observation of Mrk 509 also supports the hypothesis that the soft excess is independent of the X-ray continuum (Rivers et al. 2012). It is indicated that the soft X-ray excess could be produced by the Comptonization of the thermal optical–UV photons from the accretion disk by a warm corona (Mehdipour et al. 2011) or with the disk photosphere itself (Done et al. 2012). Done et al. (2012) also find that the Compton upscattered soft X-ray excess decreases in importance with increasing L/LEdd, in which the strongest soft excesses are associated with low-mass accretion rate AGNs rather than being tied to some change in the disk structure around Eddington.
Based on the standard disk model, we present a new scenario to explain the soft X-ray excess. Magnetic reconnection is assumed to happen in a thin layer on the surface of the accretion disk; its released energy accelerates electrons through a shock wave and it triggeres turbulence. These electrons then undergo inverse Compton scattering above the accretion disk; this process contributes the soft X-ray excess. We find that the magnetic field declines continuously with the radius of the accretion disk and that it decreases rapidly inside of the disk, but that it is relatively flat outside of the disk. We then calculate the upper limit on the energy released by the Poynting flux on the accretion disk. The distribution of the Poynting flux implies that the soft X-ray excess should arise from the inner region of the disk. In the inner region of the accretion disk, gas pressure can be ignored and we estimate the maximum luminosity by integrating the Poynting flux from the innermost steady radius to 20 RS. In Section 3, we compared the electron energy losses from Bremsstrahlung and Compton radiation. The results show that the electron energy losses through Bremsstrahlung are far less than those through Compton radiation. This means that the Compton radiation of electrons dominates over Bremsstrahlung radiation. Then, we calculated the Compton spectrum of non-relativistic and non-thermal electrons and obtained that the Compton spectrum is determined by kT0, q, β1, β2 and is independent of the accretion rate as found by Winter et al. (2009). From Equation (27), we know that the Compton spectrum is mainly determined by kT0. According to the standard disk model, T0∝M−1/4 and the masses of the black holes in AGNs are in the range of 106–109 M☉ and the Compton spectrum weakly depends on mass. Figure 3 shows that the Compton spectrum with different kT0 values maintains a narrow range of 0.1–0.5 keV corresponding to the characteristic temperature of the soft X-ray excess. Therefore, the Compton spectrum can fit the soft X-ray excess well, as shown in Figures 6 and 7. Figure 7 includes the component with a multi-temperature blackbody spectrum. It is shown that the soft photons from the accretion disk are scattered to higher energies by non-thermal electrons generated by magnetic reconnection; these photons contribute to the soft excess. We also give the Compton spectrum depending on q, β1, and β2, shown in Figures 4 and 5. The spectrum maintains a similar shape and shifts to lower energy when q increases. The spectrum also shifts in energy with β1 and β2. Finally, we estimate ξ representing the magnetic strength and the magnetic energy conversion rate listed in Table 3, and find that the magnetic energy conversion rates are low for many sources.
We are grateful to the referee for useful comments that improved the paper. We acknowledge financial support from the National Basic Research Program of China (973 Program 2009CB824800); the National Natural Science Foundation of China 11133006, 11163006, 11173054; and the Policy Research Program of the Chinese Academy of Sciences (KJCX2-YW-T24).