


ABSTRACT
The absorption spectrum of ethyne, C2H2, in solid Ar was measured in the wavelength region 107–220 nm with light from a synchrotron. Based on that absorption, irradiation of samples of ethyne dispersed in neon with vacuum-ultraviolet (VUV) radiation yielded various products that were identified through their infrared absorption spectra including Cn (n = 3–12), C2H, C2H3, C4H, C4H2, C8H−, and C8H2. The efficiency of photolysis of ethyne and the nature of photoproducts depend on the selected wavelength of VUV light. Information about the photodissociation of C2H2 with various photon energies and the formation and identification of large carbon clusters and hydrides at low temperature might be useful in photochemical models to simulate the composition of the atmosphere of Titan and as a source of aerosols.
Export citation and abstract BibTeX RIS
1. INTRODUCTION
Ethyne, a simple unsaturated hydrocarbon, attracts attention because it plays an important role in combustion and is a source of highly reactive radicals (Laufer & Fahr 2004). Ethyne is an abundant species in the interstellar medium, planetary atmospheres, and comets (Evans et al. 1991; Schilke et al. 1995). Its photochemistry and photodissociation in the ultraviolet and vacuum-ultraviolet (VUV) regions have thus been investigated theoretically and experimentally (Balko et al. 1991; Wang et al. 1997).
The photochemical degradation of ethyne is achieved with resonance lamps at 121 and 185 nm (Okabe 1975), ArF excimer lasers at 193 nm (Wodke & Lee 1985; Seki & Okabe 1993), resonant multiphoton excitation (Hsu et al. 1991), and synchrotron radiation (Wu et al. 1989; Han et al. 1989). Such works focused on photoproducts, especially on ethynyl radical C2H. The photodissociation of ethyne at 193 nm was studied through measurement of fluorescence (Hsu et al. 1995), infrared emission (Fletcher & Leone 1989), the translational energy of C2H (Balko et al. 1991; Wang et al. 1997), and the quantum yield of H (Läuter et al. 2002). Below the first ionization energy, the absorption of ethyne, with an onset about 237 nm, shows complicated diffuse bands in the wavelength region 155–200 nm (Suto & Lee 1984; Haijima et al. 1990) and discrete lines in the range 155–108 nm dominated mainly by four Rydberg series. Upon irradiation at 193 nm, ethyne is excited to vibrationally excited levels of the trans-angular A1Au valence state, from which the dissociation correlates with products C2H (A2Π) and H, but the observed primary dissociation channel is C2H (X2Σ+) + H. The bond energy HCC–H is about 548 kJ mol−1.
The photolysis of ethyne with Lyα radiation at 121.6 nm opens further dissociation channels:
Near that wavelength, the vibronic Rydberg state denoted as 3R'' (1Πu) 210 is most relevant. The earliest reports of photolysis of ethyne at 121 nm mentioned unstructured emission of photofragments in the region 350–900 nm (Okabe 1975); this emission was attributed to highly excited C2H fragments. The photodissociation of C2H2 at 121.6 nm yielded C2H predominantly in the excited state A2Π (Lai et al. 1996). Subsequent experiments performed with Doppler-selected and high-resolution Rydberg H-atom measurements (Wang et al. 1997) of the time of flight provided valuable information on the distribution of internal energy of C2H and showed two competing mechanisms of dissociation: a rapid channel exhibits a dependence on polarization and a slow channel shows a statistical distribution of internal energy of the fragment.
The photolysis of ethyne with solar radiation is the main source of ethynyl radicals in interstellar and planetary environments. Photoproduct ethynyl radical is believed to be a trigger for the formation of large carbon clusters in comets and interstellar media. Although photolysis of ethyne with VUV photons in the gaseous phase provided much valuable knowledge of its photochemistry, little effort has been devoted to the photolysis of ethyne in the solid phase or in a matrix. Because of the low temperature of outer space, ethyne is undoubtedly present in the solid state. For this reason, the photochemistry of ethyne in a condensed phase is worthy of investigation. Here, we report the VUV photolysis of ethyne in solid neon at 3 K and identify its photoproducts with infrared absorption spectra after irradiation at various photon energies.
2. EXPERIMENTS
We measured the absorption spectra of condensed samples in the VUV region to the limit of transmission of optical components, about 105 nm, with a double-beam absorption apparatus as described previously (Lu et al. 2005; Kuo et al. 2007; Lu et al. 2008). For these measurements, VUV light was dispersed with a 6 m monochromator on the high-flux cylindrical-grating monochromator beam line of the 1.5 GeV storage ring at Taiwan's National Synchrotron Radiation Research Center (NSRRC). A gaseous sample was deposited onto a rotatable LiF window maintained at 10 K. With the cold LiF window set to face the gas inlet port, the VUV light from the synchrotron intersected this LiF window at an angle near 45°. The transmitted light irradiated a glass window coated with sodium salicylate; the converted visible light was measured with a photomultiplier. The fluorescence signal was detected with a photomultiplier tube (Hamamatsu R943-02) in a photon-counting mode.
For the photodissociation experiments, the source of VUV radiation was an undulator with periodically spaced permanent magnets (9 cm, U9) attached to the storage ring at NSRRC. This beam line delivered pseudo-continuous and tunable VUV light with a photon flux of about 1016 photons s−1 (2% bandwidth). The higher harmonics from the undulator were suppressed through absorption by an appropriate gas (Ne, Ar, or Kr, depending on the desired photon energy, at pressure 1.33 kPa). When the energy of photolysis photons was less than 11.8 eV, another LiF window installed downstream from the beamline also served to eliminate light from high harmonics. The apparatus for photodissociation is similar to that described previously (Wu et al. 2008, 2009). A closed-cycle cryogenic system (Janis RDK-415) was employed to cool the substrate to 3 K; an attached CsI window served as a cold target for a matrix sample. A turbomolecular pump backed by a scroll pump maintained the vacuum of the cryo-chamber; the pressure was normally less than 4 μPa. Typically, a gaseous mixture of C2H2 (0.03 mol) and Ne (1000-fold excess) was deposited on the CsI window at 3 K over 2 hr before photolysis with VUV radiation at selected wavelengths 171, 130, and 114 nm.
IR absorption spectra were recorded at various stages of experiments with an interferometric infrared (FTIR) spectrometer (Bomem, DA8) equipped with a KBr beamsplitter and an HgCdTe detector (cooled to 77 K) to cover the IR spectral range 500–4000 cm−1; 400 scans at resolution 0.5 cm−1 were typically performed at each stage of the experiment.
C2H2 (99.0%, Matheson Gases), C2D2 (isotopic purity 98%, Cambridge Isotopic Laboratory), 13C2H2 (isotopic purity 98%, Cambridge Isotopic Laboratory), Ar (99.9995%, Matheson Gases), and Ne (99.999%, Scott Specialty Gases) were used without further purification.
3. RESULTS AND DISCUSION
3.1. VUV Absorption of Ethyne in the Solid Matrix
For an investigation of the VUV photochemistry of a compound, knowledge of the absorption spectrum and electronic states of its molecules in this region serves as a guide for the selection of light to induce dissociation from its excited states. For C2H2 in the region 105–220 nm, the absorption features have been identified as transitions to valence states at wavelengths greater than 155 nm and to Rydberg states less than 155 nm. The profiles and features of the absorption of molecules might differ between the gaseous and condensed phases. Although the absorption spectrum of gaseous C2H2 is well documented (Suto & Lee 1984; Wu et al. 2001), no absorption spectrum in the condensed phase has been reported.
Figure 1 displays the absorption of a sample of C2H2/Ar (1/100) in the region 107–220 nm at 10 K. The absorption features of C2H2 exhibit spectral broadening and shifts relative to the gaseous phase; the two known valence transitions show redshifts whereas the Rydberg transitions all display blueshifts. For example, weak maxima of absorption into electronic state B1Bu show vibrational features at wavelengths 185.09, 182.58, 180.27, 177.66, 175.66, 173.75, 171.05, 169.04, 166.94, 165.13, 163.23, 161.33, 159.53, and 157.63 nm for v = 0–13, respectively; these values average 0.31 nm greater than those in the gaseous phase. In contrast, the discrete series of Rydberg transitions for gaseous C2H2 at wavelengths less than 155 nm congest into a strong continuous band with features at 137.82, 134.42, 129.62, 126.83, 124.63, 121.73, and 119.04 nm; these maxima might correspond to Rydberg series 3R0, 3R1, 3R'0, 3R'1, 3R'2, 4R'0, and 4R'1, respectively. The positions of these Rydberg transitions shift significantly to the blue for the matrix sample.
Figure 1. Absorption spectrum of the sample C2H2/Ar (1/100) at 10 K in the wavelength region 107–220 nm; arrows denote wavelengths selected for photolysis.
Download figure:
Standard image High-resolution image3.2. VUV Irradiation of Ethyne in Solid Neon
The photolysis of ethyne with VUV radiation has been little investigated; because of the difficulty of operating in the VUV region with conventional lamps or lasers, only two excitation wavelengths—193 and 121 nm—were applied for the VUV photolysis of gaseous ethyne. An undulator beam from a synchrotron has the advantage of the wavelength becoming tunable by varying the gap of the magnets; by these means, the VUV undulator readily delivers intense radiation to initiate photolysis. In this work, we investigated the photolysis of ethyne with photons corresponding to wavelengths 171, 130, and 114 nm that excite ethyne into states B (v = 6), Rydberg band 3R0', and unresolved higher Rydberg states, respectively.
A partial IR absorption spectrum of the sample C2H2/Ne (1/1000) after deposition at 3 K is shown in Figure 2. Four intense IR lines of ethyne at 731.8, 1329.9, 3283.6, and 3296.8 cm−1 are associated with vibrational modes ν5, ν4+ν5, ν3, and ν2+ν4+ν5, respectively. Weak lines observed at 739.5, 745.0, and 3269.7 cm−1 are assigned to a dimer of C2H2 (Hirabayashi & Hirahara 2002). Upon VUV photolysis, the intensity of all of these absorptions of ethyne decreased uniformly with increasing duration of photolysis; the extent of depletion was determined by the ratios of absorbances at a particular duration with those of the original sample.
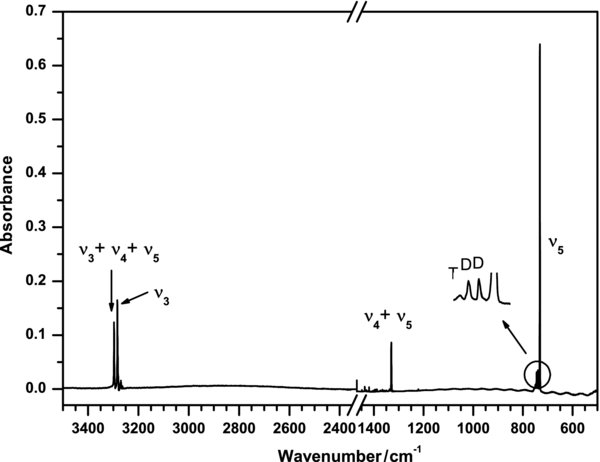
Figure 2. Partial infrared absorption spectrum of the matrix sample C2H2/Ne(1/1000) deposited at 3 K; D denotes a dimer, and T denotes a trimer of ethyne.
Download figure:
Standard image High-resolution imageFigure 3 displays temporal profiles of depletion ratios of ethyne irradiated at various wavelengths. The fact that these curves exhibit diverse profiles indicates that the photolysis mechanism varies with wavelength. The curve for temporal depletion at 171 nm is almost linear up to 50 minutes, but there is no linear relation for 130 nm and 114 nm even for a short period. Upon VUV irradiation for 50 minutes, the intensities of lines due to ethyne decreased by ∼40%, 76%, and 55% at 171, 130, and 114 nm, respectively. For irradiation less than 3 minutes, the ratio of depletion is about 1:40:15 for wavelengths 171, 130, and 114 nm; this ratio is near the ratio of the absorption, 1:52:14, at these wavelengths. The extent of the nascent VUV photolysis for ethyne hence depends on its absorption at particular wavelength: the greater the absorption is, the greater the rate of depletion will be.

Figure 3. Temporal profiles of depletion ratios for C2H2/Ne = 1/1000 irradiated at indicated wavelengths.
Download figure:
Standard image High-resolution imageIrradiation of C2H2 in solid Ne with VUV light produced various photoproducts. Figure 4(a) displays a partial difference IR absorption spectrum recorded after irradiation of the matrix sample at 130 nm for 50 minutes; in this spectrum, obtained by subtracting the spectrum recorded before VUV irradiation from that recorded after irradiation, lines pointing upward indicate production whereas those pointing downward indicate destruction. On irradiation at 130 nm, ethyne was destroyed efficiently; as shown in Figure 3, C2H2 became depleted to an extent of 76% within 50 minutes.

Figure 4. Difference infrared spectrum of ethyne in solid Ne upon irradiation at 130 nm (a) C2H2, (b) C2D2, and (c) 13C2H2 for 50 minutes. Some assignments are indicated.
Download figure:
Standard image High-resolution imageAfter photolysis of C2H2 in solid Ne at 130 nm, abundant features appear in Figure 4(a). To identify these photoproducts, we undertook experiments with isotopically substituted ethyne—C2D2 and 13C2H2—dispersed in solid Ne under the same conditions of photolysis with 130 nm; the difference IR absorption spectra for these samples are shown in Figures 4(b) and (c), respectively. Based on previous work and experiments on isotopic species, we identified the various photoproducts. For example, the ν1 and ν3 modes of the C2H radical in solid Ne were previously reported at 3293.3 and 1835.7 cm−1, respectively (Wu & Cheng 2008); in the test of photolysis of C2H2 in solid Ne upon 130 nm, we observed two lines at 3293.3 and 1835.8 cm−1, which we thus assign to the C2H species. Upon photolysis of C2D2 under the same conditions, the corresponding ν1 and ν3 modes of C2D were recorded at 2536.5 (ν1) and 1737.6 (ν3) cm−1, respectively; the results from isotopic experiments thus confirmed these assignments.
We similarly identified photoproducts containing hydrogen species such as C2H3, C4H, C4H2, C8H−, and C8H2. The observed line at 895.0 cm−1 upon photolysis of C2H2/Ne is assigned to ν7 of C2H3 (895.4 cm−1; Wu et al. 2008) and is shifted to 704.0 cm−1 in D-isotopic experiments, corresponding well with previous values of vinyl generated from photolysis of ethylene in solid Ne. The infrared spectra of C4H and C4H2 in solid Ne have been reported by Forney et al. (1995b). They used an H2 discharged flow lamp to generate VUV light to initiate photolysis of C2H2/Ne matrix samples; in their work, they also performed D- and 13C-isotopic substitution experiments to confirm their assignment. Our observed line positions of C4H at 2064.1 cm−1 (ν3) and C4H2 at 3333.1 (ν4), 2017.5 (ν5), and 628.6 cm−1 (ν8) as well as the isotopic variants are similar to their values. For C8H2, the pertinent line at 621.5 cm−1 is identical to the reported value of ν14 of C8H2 measured in the gas phase (Shindo et al. 2001). This line shifts to 525.0 cm−1 in D-isotopic experiments yielding the D-isotopic ratio of 0.8447, which is close to the value of 0.8411 of C4H2. Thus, we tentatively assigned the line at 621.5 cm−1 to ν14 of C8H2. The lines at 2106.1 and 2021.7 cm−1 showed the same photolysis behavior and shifted in D-isotopic experiments, suggesting that these two lines may belong to the same species. Grutter et al. (1999) used a mass-selected technique to deposit C8H−/Ne matrix samples at 6 K and measured the infrared spectrum of C8H−; they thus identified the lines at 2106.5 and 2021.2 cm−1 attributed to C8H−. We recorded lines at 2106.1 and 2021.7 cm−1 that are similar to previous values; we thus assigned these two lines to C8H−. In the D-isotopic experiment, the pertinent line at 2106.1 cm−1 shifted to 2101.8 cm−1 yielding the D-isotopic ratio of 0.9980, suggesting that this species contains a long carbon chain framework, supporting our assignment. Vibrational wavenumbers of observed lines and their assignments for samples of C2H2 and C2D2 are summarized in Tables 1 and 2, respectively.
Table 1. Products Observed After Photolysis of C2H2/Ne at the Indicated Wavelengths
| Species | Wavenumbera (cm−1) | Photolysis wavelength (nm) | ||
|---|---|---|---|---|
| 171 | 130 | 114 | ||
| C2H | 3292.3 (ν1), 1835.8 (ν3) | sb | mb | mb |
| C2H3 | 895.0 (ν7) | w | w | m |
| C3 | 2043.5 (ν3) | – | w | w |
| C4 | 1546.8 (ν3) | m | s | s |
| C4H | 2064.1 (ν3) | m | s | s |
| C4H2 | 3333.1 (ν4), 2017.5 (ν5), 628.6 (ν8) | s | m | m |
| C5 | 2165.5 (ν3) | – | w | m |
| C6 | 2049.0 (ν1), 1958.6 (ν4), 1199.0 (ν5) | m | s | m |
| C7 | 2134.8 (ν4), 1897.2 (ν5) | – | w | w |
| C8 | 2067.9 (ν5), 1707.5 (ν6), | m | s | w |
| C8H− | 2106.1, 2021.7 | – | w | w |
| C8H2 | 621.5 (ν14) | m | m | w |
| C9 | 2078.4 (ν5), 2010.0 (ν6) | – | w | w |
| C10 | 1915.7, 2074.8 | – | m | – |
| C10− | 2095.0 | – | w | – |
| C11 | 1939.2 (ν7) | – | w | w |
| C12 | 2004.2 (ν8) | – | m | w |
Notes. aC2H, C4, C4H, and C4H2 from Wu & Cheng (2008), C2H3 from Wu et al. (2008), C3 from Weltner et al. (1964), C5 and C7 from Forney et al. (1996) and Kranze et al. (1996), C6 from Forney et al. (1995a) and Kranze & Graham (1993), C8 from Freivogel et al. (1995), C8H− from Grutter et al. (1999), C8H2 from Shindo et al. (2001), and C9, C10, C10−, C11, and C12 from Freivogel et al. (1997). bS denotes strong; m, medium; and w, weak for intensities of observed lines; "–" denotes undetected.
Download table as: ASCIITypeset image
Table 2. Vibrational Wavenumbers of Observed Products After Irradiation of C2D2/Ne at 130 nm for 1 hr
| Species | Wavenumber (cm−1) |
|---|---|
| C2D | 2536.5 (ν1), 1737.6 (ν3) |
| C2D3 | 704.0 (ν7) |
| C3 | 2043.5 (ν3) |
| C4 | 1546.8 (ν3) |
| C4D | 2052.9 (ν3) |
| C4D2 | 2596.5 (ν4), 1870.0 (ν5), 528.7 (ν8) |
| C5 | 2165.5 (ν3) |
| C6 | 2049.0 (ν1), 1958.6 (ν4), 1199.0 (ν5) |
| C7 | 2134.8 (ν4), 1897.2 (ν5) |
| C8 | 2067.9 (ν5), 1707.5 (ν6) |
| C8D− | 2101.8 |
| C8D2 | 525.0 (ν14) T |
| C9 | 2078.2 (ν5), 2010.0 (ν6) |
| C10 | 1915.7, 2074.8 |
| C10− | 2095.0 |
| C11 | 1939.2 (ν7) |
| C12 | 2004.2 (ν8) |
Note. T denotes tentative assignments.
Download table as: ASCIITypeset image
Besides photoproducts containing H atom(s), carbon clusters are expected to be present in Figure 4. The lines of these carbon clusters show no isotopic shift in the spectra after photolysis of C2H2 and C2D2, as shown in Figures 4(a) and (b), but shift on photolysis of 13C2H2, as displayed in Figure 4(c). For example, the ν3 modes of C3 (2043.5 cm−1; Weltner et al. 1964), C4 (1547.0 cm−1; Forney et al. 1995a), and C5 (2166.4 cm−1; Vala et al. 1989) were recorded at 2043.5, 1546.8, and 2165.3 cm−1, respectively, after photolysis of C2H2 and C2D2, whereas related lines belonging to 13C3, 13C4, and13C5 after photolysis of 13C2H2 are found at 1964.9, 1487.2, and 2081.6 cm−1, respectively, as listed in Table 3. The 13C-isotopic ratios of these CC stretching modes for C3, C4, and C5 are 0.9615, 0.9615, and 0.9613, respectively; these values are almost the same and support these assignments. For the species C6, the associated lines of ν4 and ν5 were noted at 1958.6 and 1199.0 cm−1, respectively, based on the previous work (1958.7 and 1199.4 cm−1; Smith et al. 1994). The connected lines of 13C6 were found at 1882.4 and 1152.8 cm−1, respectively, in which, the derived 13C-isotopic ratios are 0.9611 and 0.9615 for ν4 and ν5 of C6, respectively, further supporting our assignment. Similarly, the ν4 and ν5 lines of C7 (2134.4 and 1897.5 cm−1; Smith et al. 1994; Forney et al. 1996) were recorded at 2134.8 and 1897.2 cm−1, respectively; while, the ν4 of 13C7 was observed at 2052.2 cm−1, with a 13C-isotopic ratio of 0.9613. For the species C8, the ν5 and ν6 modes (2067.8 and 1707.8 cm−1; Freivogel et al. 1995) were recorded at 2067.9 and 1707.5 cm−1, respectively, in the tests of C2H2 and C2D2, whereas related lines due to 13C8 after photolysis of 13C2H2 are found at 1986.4 and 1641.8 cm−1, respectively.
Table 3. Vibrational Wavenumbers of Observed Products After Irradiation of 13C2H2/Ne at 130 nm for 1 hr
| Species | Wavenumber (cm−1) |
|---|---|
| 13C2H | 1776.1 (ν3) |
| 13C2H3 | 888.9 (ν7) |
| 13C3 | 1964.9 (ν3) |
| 13C4 | 1487.2 (ν3) |
| 13C4H | 1984.9 (ν3) |
| 13C4H2 | 3313.6 (ν4), 625.4 (ν8) |
| 13C5 | 2081.6 (ν3) |
| 13C6 | 1968.5 (ν1), 1882.4 (ν4), 1152.8 (ν5) |
| 13C7 | 2052.2 (ν4) |
| 13C8 | 1986.6 (ν5), 1641.8 (ν6) |
| 13C8H− | 2023.7 |
| 13C8H2 | 617.0 (ν14) |
| 13C9 | 2001.3 (ν5) T, 1932.7 (ν6) T |
| 13C10 | 1998.8 T |
| 13C10− | 2011.7 T |
| 13C11 | 1865.4 (ν7) T |
| 13C12 | 1932.7 (ν8) T |
Note. T denotes tentative assignments.
Download table as: ASCIITypeset image
The vibrational spectra of larger carbon clusters with a 13C-isotopic substitution have been seldom reported in literature; therefore, such 13C-isotopic data are lacking. In this work, we found that the 13C-isotopic ratios of CC stretching modes for linear C3 to C8 are 0.9611 ± 0.0004. Based on isotopic ratios and peak intensities, we might thus identify the lines of larger carbon clusters near the estimated positions. By these means and with careful examination, we accordingly recognized more carbon cluster species C9, C10, C10−, C11, and C12 generated after VUV photolysis of ethyne in solid Ne. Table 3 summarized the line positions and assignments for the carbon hydrides and carbon clusters with fully 13C-isotopic substitutions.
A difference spectrum recorded after irradiation of the matrix sample with 171 nm for 50 minutes is presented in Figure 5(a). After irradiation at 171 nm for 50 minutes, intensities of lines due to C2H2 decreased by ∼40%. Upon photolysis of ethyne at 171 nm, the most prominent photoproduct is the C2H radical; its most intense line recorded at 1835.8 cm−1 is the vibrational ν3 mode. Other weak but abundant absorptions of C2H in vibronic structures were found in the spectral region 2000–5000 cm−1; these vibronic absorptions of C2H are discussed in detail elsewhere (Wu & Cheng 2008). Continued subjection of this primary photoproduct C2H to irradiation is expected to produce C2 molecules; because of inactivity of the homodiatomic molecules in IR, the spectra showed no line indicative of absorption due to C2 near 1800 cm−1 (Marenin & Johnson 1970), whereas new lines associated with H containing photoproducts C2H3, C4H, C4H2, and C8H2 and those coupled to carbon clusters C4, C6, and C8 appeared. The wavenumbers, observed qualitative intensities, and assignments of these lines for various photoproducts are summarized in Table 1. To compare the effect of varied VUV excitation, we present the spectrum upon photolysis at 130 nm in Figure 5(b). The proportions of carbon hydrides C2H, C4H2, and C8H2 upon irradiation at 130 nm seemed generally to be less than at 171 nm, but lines due to large carbon clusters including C3–C12 suggest the contrary. Notably, lines due to species of carbon in clusters with atoms of odd number and of higher even numbers C10 and C12 appeared in the spectrum upon photolysis at 130 nm.
Figure 5. Difference infrared spectrum of C2H2 in solid Ne upon irradiation at (a) 171 nm, (b) 130 nm, and (c) 114 nm for 50 minutes. Some assignments are indicated.
Download figure:
Standard image High-resolution imageFigure 4(c) displays a difference IR absorption spectrum recorded after irradiation of a sample at 114 nm for 50 minutes; pertinent data are summarized in Table 1. The efficiency of photolysis at 114 nm is intermediate between those experiments with irradiation at 171 and 130 nm, as reflected in the distribution of photoproducts. Similar to the experiment at 130 nm, abundant lines appear in the spectral region 2000–2200 cm−1, corresponding to CC stretching modes of carbon clusters, but the intensities of observed lines of carbon clusters are less than those observed upon irradiation at 130 nm for the same duration.
3.3. Mechanism of VUV Photochemistry for Ethyne in Solid Ne
The photochemical behavior of species isolated in matrices differs from that in the gaseous phase. At a small density, gaseous fragments have little chance to collide with each other upon photodissociation, whereas photofragments produced in a matrix and with insufficient energy to escape are typically constrained within the immediate environment. In this work, we detected strong IR absorption lines of C2H radicals upon irradiation at 171, 130, and 114 nm. The results demonstrate that radical C2H is the primary photoproduct of ethyne at these wavelengths. The dissociation thresholds to form C2H in the ground state X2Σ+ and the excited state A2Π are 46056 cm−1 and 49750 cm−1, which correspond to about 217 nm and 201 nm, respectively (Mordaunt & Ashfold 1994; Lai et al. 1996; Wang et al. 1997). The photoproduct C2H from ethyne upon irradiation at 171, 130, and 114 nm might thus possess sufficient energy to migrate from the site of production to react with another C2H to form butadiyne C4H2. Figure 6 displays the temporal profiles of the formation of C2H and C4H2 at varied wavelengths; these profiles are all similar at the same wavelength. This effect implies that the secondary photoproduct C4H2 was generated from C2H. Further photodissociation of C4H2 might produce the radical C4H, which might then react with itself to generate C8H2. As another possible reactive route, butadiyne C4H2 might combine with itself to form C8H2 and H2. The following reactions explain the major carbon hydrides observed at wavelengths 171 nm:
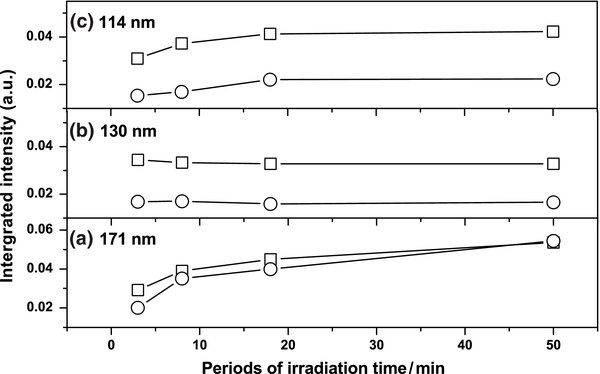
Figure 6. Temporal profiles of the formation of C2H (symbol "○") and C4H2 (symbol "□") after irradiation of C2H2/Ne = 1/1000 at wavelengths (a) 171 nm, (b) 130 nm, and (c) 114 nm.
Download figure:
Standard image High-resolution imageOther minor carbon-containing photoproducts C4, C6, and C8 were generated at wavelengths 171 nm. These photoproducts containing four or six carbon atoms formed on irradiation of C2H2 in Ne at 171 nm might result from photodissociation of a dimer or a trimer of ethyne within the same matrix cage, but the formation of the C8 species is less likely because of the scarcity of tetramer in a matrix sample with C2H2/Ne = 1/1000. These even number carbon clusters might be created through complicated photochemical processes from the major species produced as follows:

Figure 7(a) displays the temporal profiles of the formation of C4, C6, and C8 at 171 nm; these profiles increase as irradiation time increases. Although the signals of these minor photoproducts are small, we could still have the impression that the slopes of temporal formation of C4, C6, and C8 are almost similar. In addition, the fact that no odd numbers of carbon clusters are observed might suggest that the growth of carbon clusters is mostly through the addition of C2 step by step upon irradiation at 171 nm.
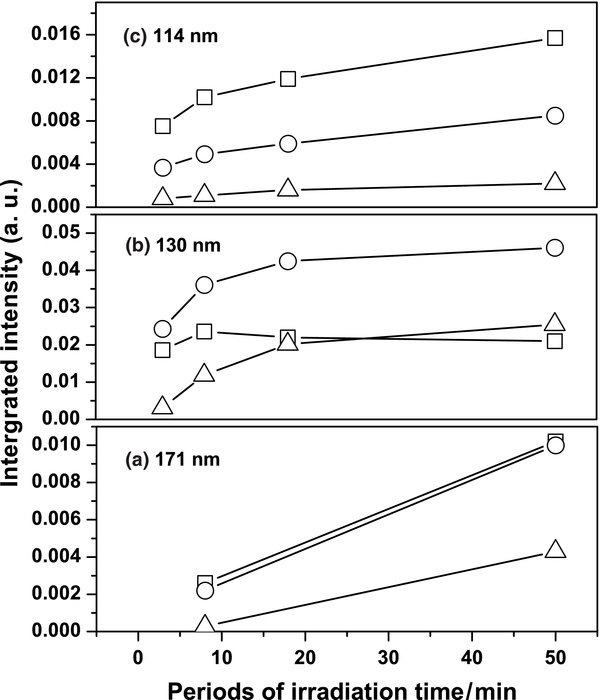
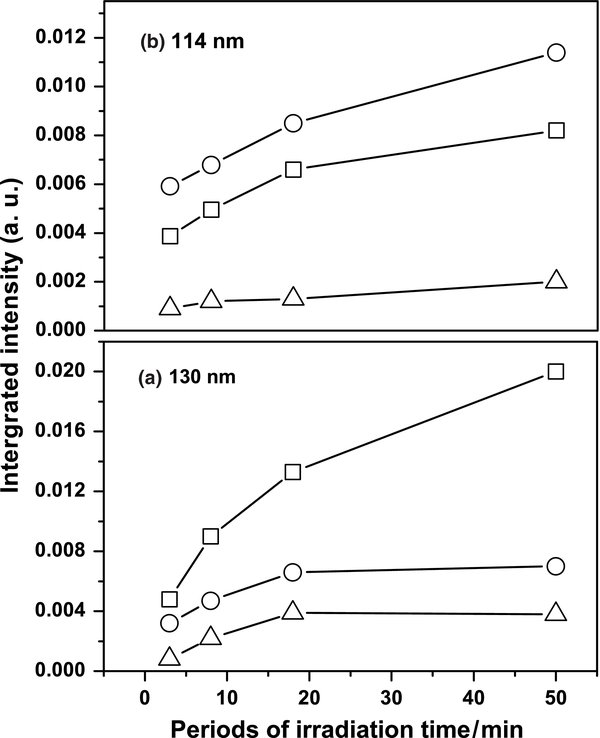
Figure 7. Temporal profiles of the formation of even carbon clusters C4 (symbol "□"), C6 (symbol "○"), and C8 (symbol "Δ") after irradiation of C2H2/Ne = 1/1000 at wavelengths (a) 171 nm, (b) 130 nm, and (c) 114 nm.
Download figure:
Standard image High-resolution imageUpon photodissociation at 130 and 114 nm, besides the species generated at 171 nm, odd carbon clusters C3, C5, C7, C9 and C11, and other clusters up to C12 and C8H− were generated. Temporal profiles of the formation of various even carbon clusters from C2H2/Ne = 1/1000 irradiated at 130 and 114 nm are depicted in Figures 7(b) and (c). Upon irradiation with 130 nm, only C6 and C8 show similar formation slopes. In contrast, the trends of the formation of C4, C6, and C8 upon irradiation with 114 nm are similar. The depletion ratios of C2H2 at these three wavelengths might be the cause of the difference. The large photodissociation efficiency and saturated depletion ratio of C2H2 upon irradiation with 130 nm reflects the large formation of C2H or C2 in the early periods of irradiation and quick formations for large carbon clusters, as well as the appearance of the turning point of the temporal profile of C4.
The odd carbon clusters were detected upon photodissociation at 130 and 114 nm; the temporal profiles of the formation of C3, C5, and C7 are shown in Figure 8. Upon irradiation with 130 nm, C3 was formed rapidly and fruitfully compared with formations of C5 and C7. In contrast, in the 114 nm experiments the trends of formations of C3, C5, and C7 are similar and C3 was formed less. There is no consistency in these temporal profiles of formation of odd carbon clusters. Further analysis of the temporal profiles of the formation of carbon clusters higher than C8 showed random behaviors. These results suggest that the mechanism of the formation of carbon clusters from ethyne in solid Ne upon VUV photolysis is complicated. The odd carbon clusters might be generated from the addition of carbon atoms with even carbon clusters or photodissociation to odd carbon atoms from large even carbon clusters. Photofragments acquiring excess energy after absorption of VUV photons possess enhanced mobility inside the solid environment that enables them to migrate to other atoms or molecules and to react there. Complicated photochemical reactive paths are thus more likely to consist of sequential construction of long-chain carbon clusters. Also, through an ionic photodissociation, C8H2 might become the ion C8H−. Besides the reactions discussed above, the following steps might also occur in this system:
Figure 8. Temporal profiles of the formation of odd carbon clusters C3 (symbol "□"), C5 (symbol "○"), and C7 (symbol "Δ") after irradiation of C2H2/Ne = 1/1000 at wavelengths (a) 130 nm and (b) 114 nm.
Download figure:
Standard image High-resolution image
The interactions between carbon atoms and molecules are far stronger than those between molecules and Ne. Molecules and atoms of carbon thus combine efficiently to form clusters. The formation of carbon clusters and hydrides with a linear structure indicates a synthesis involving an addition to a carbon chain of one or two carbon atoms in each step.
3.4. Implication for Photochemistry in Titan's Atmosphere
Titan, the largest moon of Saturn, has a dense atmosphere (160 kPa) composed of N2 ∼ 98.4%, CH4 ∼ 1.6%, and other trace gases (Hirtzig et al. 2009). Apart from N2 and CH4, identified species in Titan include C2H2, C2H4, C2H6, C4H2, C6H6, C6N2, C2N2, HCN, and HC3N (Hirtzig et al. 2009). These species are likely synthesized by photochemically induced reaction of highly abundant N2 and CH4. When the amounts of these trace molecules become large enough, they form aerosol hazes in Titan's atmosphere (Liang et al. 2007), but the composition and mechanism of the formation of these organic layers remain poorly understood. These aerosol hazes likely arise from photochemically initiated reactions involving C2H2 present in a significant fraction in Titan's atmosphere. The photochemistry of C2H2 thus plays an important role in Titan's atmosphere because it absorbs photons efficiently at wavelengths less than 200 nm.
The temperature in Titan's stratosphere is about 120 K, but less on Titan's surface. At such temperatures, ethyne becomes condensed to a solid; information about the VUV photochemistry of solid ethyne from laboratory is thus needed. In this work, we photodissociated ethyne in solid Ne at three VUV wavelengths through its excited states that generated the radical C2H as the major species; consecutive photochemical reactions ensue to form various products including large carbon clusters and hydrides. Among these products, we observed carbon hydrides with carbon atoms in even numbers in C2Hn (n = 1–3), C4Hn (n = 1–2), and C8Hn (n = 1–2). We postulate that C2Hn is the source of the formation of C4Hn, which is in turn the precursor of C8Hn. The absence of C6Hn in the VUV photochemical system of ethyne suggests that a combination of C2Hn and C4Hn to form C6Hn seems less likely in this system.
4. CONCLUSION
With VUV light from a synchrotron, we measured the absorption spectrum of ethyne dispersed in solid Ar and irradiated samples of C2H2 dispersed in solid Ne. We identified, via infrared absorption spectra, products containing carbon in chains up to C8 upon irradiation at 171 nm and up to C12 upon irradiation at 130 and 114 nm. The formation of these carbon clusters resulted from the combination of fragments from the photolysis of C2H2, but not from photolysis of clusters of C2H2 in the same cage. We observed carbon hydrides C2Hn (n = 1–3), C4Hn (n = 1–2), and C8Hn (n = 1–2), but no C6Hn. We postulate that C2Hn is the source of C4Hn, which is in turn a precursor of C8Hn. Our investigation of the photodissociation of C2H2 at three photon energies and the formation and identification of carbon clusters and their hydrides at low temperature will be useful in the construction of photochemical models to simulate the composition of the atmosphere of Titan and as a source of its aerosols.
National Science Council of Taiwan (grant NSC96-21123-M-213-006-MY3) provided support for this research.