


ABSTRACT
A near-infrared (NIR; 2.5–4.5 μm) spectroscopic survey of Sloan Digital Sky Survey (SDSS)-selected blue early-type galaxies (BEGs) has been conducted using the AKARI. The NIR spectra of 36 BEGs are secured, which are well balanced in their star formation (SF)/Seyfert/LINER-type composition. For high signal-to-noise ratio, we stack the BEG spectra in its entirety and in bins of several properties: color, specific star formation rate, and optically determined spectral type. We estimate the NIR continuum slope and the equivalent width of 3.29 μm polycyclic aromatic hydrocarbon (PAH) emission. In the comparison between the estimated NIR spectral features of the BEGs and those of model galaxies, the BEGs seem to be old-SSP(simple stellar population)-dominated metal-rich galaxies with moderate dust attenuation. The dust attenuation in the BEGs may originate from recent SF or active galactic nucleus (AGN) activity and the BEGs have a clear feature of PAH emission, evidence of current SF. BEGs show NIR features different from those of ULIRGs from which we do not find any clear relationship between BEGs and ULIRGs. We find that Seyfert BEGs have more active SF than LINER BEGs, in spite of the fact that Seyferts show stronger AGN activity than LINERs. One possible scenario satisfying both our results and the AGN feedback is that SF, Seyfert, and LINER BEGs form an evolutionary sequence: SF → Seyfert → LINER.
Export citation and abstract BibTeX RIS
1. INTRODUCTION
Early-type galaxies are often regarded as the objects at the final stage of galaxy evolution. Throughout many observations, it has been revealed that most nearby early-type galaxies have red colors and very poor contents of cold gas (e.g., Faber & Gallagher 1976; Trager et al. 2000; Treu et al. 2006). Such observational evidence indicates that early-type galaxies are composed of old stars and they probably will not have additional star formation (SF) in the future. That is, most early-type galaxies seem to evolve passively, unlike late-type galaxies with active SF.
However, since Abraham et al. (1999) and Menanteau et al. (1999) found a considerable fraction of early-type galaxies with blue colors and evidence of current SF in the Hubble Deep Field (Williams et al. 1996), the existence of blue early-type galaxies (BEGs) has become a new important factor to be considered in the formation scenario of early-type galaxies. BEGs are known to have positive color gradients (i.e., center bluer than outskirts) on average and consist of both old and young stars (Menanteau et al. 2001a; Elmegreen et al. 2005; Ferreras et al. 2005; Lee et al. 2006, 2008, 2010a). It has also been revealed that the internal color distributions of BEGs are neither homologous nor symmetric (Menanteau et al. 2004; Lee et al. 2006), and that some BEGs are suspected to host active galactic nuclei (AGNs; Menanteau et al. 2005; Lee et al. 2006, 2008). Unlike typical red early-type galaxies (REGs) preferring high-density environments, BEGs tend to reside in intermediate- or low-density environments (Kannappan et al. 2009; Lee et al. 2010b). The origin and future of BEGs are still controversial. Observational evidence indicates that some BEGs may originate from recent galaxy interactions or mergers (Lee et al. 2006), but the gas infall is also a possible mechanism for building BEGs (Menanteau et al. 2001b). After some time passes, BEGs may evolve into typical REGs (Lee et al. 2006, 2007, 2008), but it is also possible that they evolve into bulges of late-type galaxies (Hammer et al. 2005; Kannappan et al. 2009). In any case, BEGs are probably in the forming/growing phase of early-type galaxies or bulges.
To better understand the formation and evolution of BEGs, we need to inspect what happens in the inside of BEGs. Since more than half of BEGs have evidence of their merger/interaction origin (Lee et al. 2006), the interaction-induced SF is expected to make BEGs blue. On the other hand, galaxy merger/interaction sometimes also causes AGN activity (Kewley & Dopita 2003; Sánchez et al. 2005; Comerford et al. 2009), and the power-law continua of AGNs may affect the color of BEGs. Lee et al. (2008) reported that non-passive BEGs in the Sloan Digital Sky Survey (SDSS; York et al. 2000) include both SF galaxies and AGN host galaxies, the number ratio of which is about 3:5 for −22.9 < 0.1Mr5 <−20.7. However, optical spectra are easily obscured by dust, causing the missing of a significant fraction of AGNs in optical surveys (Best et al. 2005). Moreover, ground-based spectroscopy (e.g., the SDSS spectroscopy) of bright galaxies in the optical band often suffers the dilution of low-contrast emission lines due to strong emission lines (Ho et al. 1997), which also causes inaccuracy in estimating AGN activity.
One of the most powerful tools to probe the SF/AGN activity is the spectroscopy in the infrared (IR) band. Polycyclic aromatic hydrocarbons (PAHs; Sellgren 1984; Leger & Puget 1984) have been detected in various objects, such as H ii regions, protostellar clouds, planetary nebulae, and SF galaxies (Peeters et al. 2002; Hony 2002). It is known that UV photons excite the vibrational and stretching modes of PAH molecules, from the relaxation of which broad IR emission lines (such as 3.3, 6.2, 7.7, 8.6, and 11.2 μm lines) are produced (Cherchneff & Barker 1989; Shan et al. 1991). Such PAH emission features are good indicators of SF activity. On the other hand, Voit (1992) argued that PAHs in the central region of an AGN could be destructed by the strong X-ray emission from the AGN. Furthermore, AGN activity is known to suppress SF itself (AGN feedback; Antonuccio-Delogu & Silk 2008; Rafferty et al. 2008). Thus, those properties of PAH emission are believed to provide a reasonably clean diagnostic between SF and AGN. In addition, the shape of the IR continuum is another indicator of SF/AGN, because SF galaxies and AGNs have different spectral energy distributions (e.g., Imanishi et al. 2008; Risaliti et al. 2006, 2010). However, no systematic IR spectroscopic surveys of BEGs are seen in the literature.
In this paper, we report the result of the first BEG spectroscopic survey in the near-IR (NIR) band, using the AKARI (Murakami et al. 2007) Infrared Camera (IRC; Onaka et al. 2007). The outline of this paper is as follows. Section 2 describes the target selection and the AKARI spectroscopic observation. Section 3 explains the reduction and analysis of the AKARI data. The extracted NIR spectra of BEGs and their features are shown in Section 4. The results are discussed in Section 5, and the main results and their implication are summarized in Section 6. Throughout this paper, we adopt the cosmological parameters: h = 0.7, ΩΛ = 0.7, and ΩM = 0.3.
2. OBSERVATION
2.1. Target Selection
We selected 59 non-passive (i.e., currently star-forming or hosting an AGN) BEG targets based on the scheme of Lee et al. (2008) using the spectroscopic sample of galaxies in the SDSS Data Release 4 (DR4; Adelman-McCarthy et al. 2006). We adopted the physical parameters of the galaxies from several value-added galaxy catalogs (VAGCs) drawn from the SDSS: photometric parameters from the SDSS pipeline (Stoughton et al. 2002), structural parameters estimated by Park & Choi (2005) and Choi et al. (2007), and spectroscopic parameters from Max-Planck-Institute for Astrophysics (MPA)/Johns Hopkins University (JHU) VAGC (Kauffmann et al. 2003; Tremonti et al. 2004; Gallazzi et al. 2006). First, we selected the early-type galaxies from the SDSS galaxies using their distribution in the color, color gradient, and light-concentration parameter space (Park & Choi 2005). Next, we divided the selected early-type galaxies into REGs and BEGs, using the method of Lee et al. (2006), which is based on the color distribution of bright early-type galaxies as a function of redshift.6 The BEGs were classified using their flux ratios between several spectral lines (e.g., BPT diagram; Baldwin et al. 1981; Kewley et al. 2006) into passive, SF, Seyfert, and low ionization nuclear emission region (LINER) galaxies, among which passive BEGs were excluded. Finally, we dropped BEGs with conspicuous substructures or disk components in visual checks. Among the BEGs selected in this scheme, we chose the target objects as non-passive BEGs at 0.02 < z < 0.1 with Ks <14.4.7 The magnitude limit was applied to ensure the quality of the AKARI spectroscopy.
As a result, 59 BEGs were selected and proposed to be observed, but only 36 targets among them were successfully observed by the AKARI.8 Figure 1 shows the basic optical–NIR properties of the 36 BEGs in our sample: their magnitudes as a function of redshift, color–magnitude relation, and color–color relation, confirming that our sample BEGs are blue and relatively bright objects. Figure 2 displays the distribution of the BEGs in the line flux ratio diagrams, showing that the SF:Seyfert:LINER composition in our BEG sample is well balanced (11:15:10). In Figure 3, the atlas images of the BEGs retrieved from the SDSS are presented. The basic properties of the BEGs are summarized in Table 1.
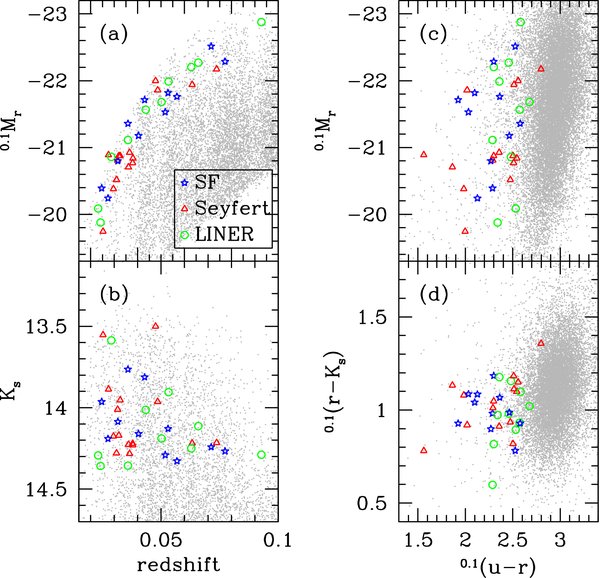
Figure 1. Basic optical–NIR properties of the observed 36 BEGs: (a) absolute magnitude in the r band as a function of redshift, (b) apparent magnitude in the Ks band as a function of redshift, (c) the color–magnitude relation, and (d) the color–color relation. The small dots are SDSS early-type galaxies and the large symbols are the BEGs: stars for star-forming (SF) BEGs, triangles for Seyfert BEGs, and circles for LINER BEGs (classified in Figure 2).
Download figure:
Standard image High-resolution image
Figure 2. Distribution of SDSS early-type galaxies (small dots) and the BEGs (filled circle) in the line flux ratio diagram. (a) The line is the boundary dividing SF galaxies (lower left) and AGNs (upper right) given by Kauffmann et al. (2003). (b) The line is the boundary dividing Seyferts (upper left) and LINERs (lower right) given by Kewley et al. (2006). The number of filled circles is smaller than our BEG sample size because the BEGs with each line S/N >3 are plotted here. SF BEGs are not plotted in panel (b).
Download figure:
Standard image High-resolution image
Figure 3. Atlas images of the observed 36 BEGs, retrieved from the SDSS. The bar in each image represents a scale of 2'' or 5''.
Download figure:
Standard image High-resolution imageTable 1. Basic Properties of the BEGs
| SDSS ID | Redshift | 0.1Mar | Kbs | Optical | 0.1(u − r) | SSFR[O ii]c |
|---|---|---|---|---|---|---|
| Spectral Type | ||||||
| 004803.10+160057.9 | 0.050 | −21.681 | 14.189 | LINER | 2.676 | 0.000 |
| 013244.86−102250.3 | 0.032 | −20.876 | 14.171 | Seyfert | 2.503 | ... |
| 024847.62−000633.0 | 0.025 | −20.392 | 13.964 | SF | 2.287 | ... |
| 031654.91−000231.1 | 0.023 | −20.087 | 14.293 | LINER | 2.532 | ... |
| 080328.06+250609.5 | 0.028 | −20.888 | 13.886 | Seyfert | 1.563 | ... |
| 082443.28+295923.5 | 0.025 | −19.743 | 13.553 | Seyfert | 1.998 | ... |
| 083021.32+354902.4 | 0.053 | −21.818 | 14.129 | SF | 2.099 | 11.989 |
| 084437.81+325423.2 | 0.032 | −20.808 | 14.011 | Seyfert | 2.290 | 25.838 |
| 090455.34+335722.1 | 0.044 | −21.566 | 14.013 | LINER | 2.572 | 0.306 |
| 094814.71+574444.4 | 0.030 | −20.382 | 14.175 | Seyfert | 1.984 | ... |
| 094835.61+390342.5 | 0.071 | −22.515 | 14.242 | SF | 2.526 | ... |
| 100152.34+110419.7 | 0.052 | −21.531 | 14.291 | SF | 2.033 | 14.902 |
| 110559.02+585645.7 | 0.048 | −21.997 | 13.501 | Seyfert | 2.557 | 1.804 |
| 113003.57+571829.4 | 0.036 | −20.708 | 14.227 | Seyfert | 1.863 | 37.973 |
| 113629.10+542102.9 | 0.063 | −21.939 | 14.218 | Seyfert | 2.513 | 9.908 |
| 114721.61+522658.4 | 0.049 | −21.858 | 13.964 | Seyfert | 2.019 | 55.042 |
| 115110.60+451322.3 | 0.036 | −21.113 | 14.356 | LINER | 2.287 | 2.687 |
| 123250.91+503041.0 | 0.063 | −22.204 | 14.250 | LINER | 2.299 | 6.698 |
| 130238.74+452637.3 | 0.024 | −19.878 | 14.358 | LINER | 2.340 | ... |
| 130457.90+534651.0 | 0.029 | −20.859 | 13.587 | LINER | 2.481 | 0.014 |
| 134456.31+024359.5 | 0.077 | −22.287 | 14.267 | SF | 2.299 | ... |
| 141229.34+642236.4 | 0.036 | −21.358 | 13.765 | SF | 2.578 | ... |
| 141239.32−020231.1 | 0.074 | −22.175 | 14.215 | Seyfert | 2.798 | ... |
| 141718.34+464153.5 | 0.038 | −20.839 | 14.229 | Seyfert | 2.542 | 1.952 |
| 143222.69+565108.3 | 0.043 | −21.713 | 13.813 | SF | 1.925 | 9.136 |
| 144918.44+523312.2 | 0.066 | −22.270 | 14.113 | LINER | 2.457 | 3.405 |
| 145323.38+390413.6 | 0.032 | −20.798 | 14.086 | SF | 2.270 | ... |
| 145455.44+453126.5 | 0.037 | −20.924 | 14.283 | Seyfert | 2.356 | 0.000 |
| 153344.45+391341.9 | 0.040 | −21.176 | 14.160 | SF | 2.463 | 0.365 |
| 153928.55+465859.7 | 0.038 | −20.770 | 14.220 | Seyfert | 2.509 | ... |
| 154744.14+412408.2 | 0.033 | −20.873 | 13.954 | Seyfert | 2.299 | 35.112 |
| 163112.14+402912.1 | 0.031 | −20.516 | 14.279 | Seyfert | 2.476 | ... |
| 164733.64+250707.8 | 0.057 | −21.762 | 14.328 | SF | 2.363 | 6.926 |
| 172611.22+591831.1 | 0.027 | −20.241 | 14.191 | SF | 2.128 | ... |
| 210258.87+103300.6 | 0.093 | −22.877 | 14.289 | LINER | 2.583 | 0.193 |
| 225506.79+005839.9 | 0.053 | −21.988 | 13.905 | LINER | 2.359 | 0.046 |
Notes. aThe r-band absolute magnitude with K-correction (Petrosian magnitude). bThe Ks-band apparent magnitude (20 mag arcsec−2 isophotal Ks fiducial ellipse aperture magnitude). cThe specific star formation rate in units of 10−12 yr−1 (that is, the newly forming stellar mass per unit stellar mass per year). For the objects with S/N[O ii]<3, their SSFRs were not estimated (...).
Download table as: ASCIITypeset image
2.2. AKARI Spectroscopy
The AKARI9 is a Japanese infrared astronomy satellite from the Institute of Space and Astronautical Science (ISAS) of the Japanese Aerospace Exploration Agency (JAXA). It was launched on 2006 February 21 and ran out of its onboard coolant (helium) supply on 2007 August 26 after its successful operation. The observation of our BEG targets was conducted during the AKARI open-time operation, the post-helium phase of the AKARI observation, in which NIR (1.8–5.5 μm) imaging and spectroscopic observations are available.
The observation was conducted from 2008 November to 2009 August. The target BEGs were observed using the IRCZ4 Astronomical Observing Template (AOT), which is the spectroscopic AOT of the IRC. Between the grism and prism, we selected the grism spectroscopy that has better spectroscopic resolution. The 1σ noise equivalent flux density of the IRCZ4 grism is about 0.2 mJy, and its spectroscopic resolution is R ∼120. As the target positioning option, we used the point-source aperture (Np), because the typical effective radius of target BEGs is only several arcseconds. Among the successfully observed 36 targets, 29 objects were observed twice, while 7 targets were observed only once. The net exposure time for a single pointing observation is about 6 minutes (Onaka et al. 2007; Imanishi et al. 2008).
3. DATA REDUCTION AND ANALYSIS
3.1. Basic Data Reduction and Median Stacking
Unlike our expectation, two pointings per object were not enough to secure a sufficient signal-to-noise ratio (S/N) for most targets (half of the spectra have 3.5–3.9 μm continua with S/N <6), although the spectra of a few objects are relatively good. Thus, we applied the median stacking analysis technique for high S/N. The steps of the stacking analysis are as follows.
- 1.We used the IRC Spectroscopy Toolkit for Phase 3 Data Version 20090211 provided by the AKARI team, for the basic processes such as dark subtraction, image flat fielding, spectral flat fielding, image combining, source detection and extraction, sky subtraction, wavelength calibration, and flux calibration.
- 2.Using the SDSS spectroscopic redshift, we converted the observer-frame wavelength into the rest-frame wavelength for each object. Since the rest-frame wavelength ranges are different between objects, we trimmed each spectrum with the rest-frame wavelength range of 2.5–4.5 μm.
- 3.All trimmed spectra were normalized for the median flux density at 3.5 μm < λ < 3.9 μm to be identical.
- 4.We stacked the normalized spectra by taking a median. We also produced several median-stacked spectra in bins of several properties such as optical spectral type, optical color, and [O ii]-based specific star formation rate (SSFR).
We selected the median stacking instead of mean stacking because it removes unreal data points (hot or bad pixels) more effectively, whereas it also improves data quality similarly to that which is done by the mean stacking. Not only the total stacking (i.e., stacking all spectra into a single spectrum) but also the subsample stacking was carried out to compare the NIR spectral features between subsamples with different optical properties. We simply estimated the uncertainty of the stacked spectra by supposing that the spectral noise follows the Poisson error and that the S/N is accumulated during the stacking process. That is,
where (S/N)s is the S/N of the stacked spectrum and (S/N)i is the S/N of the individual spectra.
3.2. Spectral Fitting
We used the power-law continuum +3.29 μm PAH emission (Gaussian) formula (Risaliti et al. 2006) to fit the stacked spectra:
where Fλ is the flux density, λ is the wavelength in units of μm, Γ is the continuum slope, σ is the Gaussian spread in units of μm, and A and B are amplitudes. The fitting was conducted in the wavelength range of 2.5–3.9 μm, because the Brα emission and CO absorption lines may affect the NIR spectra significantly at λ>4 μm (Imanishi et al. 2008; Risaliti et al. 2010).
4. RESULTS
Figure 4 displays the stacked spectrum of all BEGs in our sample. In this spectrum a clear PAH emission line is found, the central wavelength of which is 3.29 μm. The continuum is overall well fit to the function in the fitting range (2.5–3.9 μm). The ice-cored dust absorption (λ∼2.8–3.2 μm) feature is marginally found, but the bare carbonaceous dust absorption (λ ∼ 3.4 μm) feature is hardly seen in Figure 4. Around λ ∼ 3.4 μm, instead of absorption features, a marginal excess is seen, which we do not currently understand. It is noted that the long-ward of 3.9 μm of the stacked spectrum shows values totally lower than the fit. The known line features at λ>4 μm are Brα emission (λ = 4.05 μm) and CO2 absorption (λ = 4.26 μm), but those features are not clearly identified in Figure 4. The apparent "dip" at λ>4 μm may be simply because the spectral fitting was carried out in the wavelength range of 2.5–3.9 μm.

Figure 4. Stacked spectrum (noisy thick solid line) using all BEGs in our sample. The noisy thin solid lines show the S/N-accumulated noise and the smooth solid line is the continuum + PAH emission fit using Equation (2). The estimated PAH equivalent width (EW3.29) and the continuum slope (Γ) are denoted on the upper right corner. The dashed vertical line shows the PAH central wavelength (3.29 μm) and the dotted vertical line shows the upper limit of the wavelength range for fitting (3.9 μm).
Download figure:
Standard image High-resolution imageFigures 5–7 show the stacked spectra of the BEGs in bins of several properties: [O ii]-based specific star formation rate (SSFR![$_{[\rm {O\,{\mathsc ii}}]}$](https://content.cld.iop.org/journals/0004-637X/719/2/1946/revision1/apj349996ieqn1.gif) ), 0.1(u − r) color, and optical spectral type. In the estimation of SSFR, the star formation rate (SFR) was estimated using the [O ii] emission line that is known to be hardly contaminated by AGN emission (Ho 2005; Kim et al. 2006), and the stellar mass was derived using the Two Micron All Sky Survey (2MASS) Ks magnitude (see Lee et al. 2010a). When considering the objects with a sufficient [O ii] emission signal (S/N[O ii]⩾3; Figures 5(b) and (c)), PAH emission is hardly found for low SSFR[O ii] BEGs, whereas the stacked spectrum of the high SSFR[O ii] BEGs shows a clear PAH emission feature. This confirms the fact that PAH emission reflects current SF. It is noted that 14 BEGs have low S/N[O ii], which may be mainly due to the difficulty in measuring the [O ii](3727 Å) line using the SDSS spectroscopy (3800–9200 Å) at low redshift.
), 0.1(u − r) color, and optical spectral type. In the estimation of SSFR, the star formation rate (SFR) was estimated using the [O ii] emission line that is known to be hardly contaminated by AGN emission (Ho 2005; Kim et al. 2006), and the stellar mass was derived using the Two Micron All Sky Survey (2MASS) Ks magnitude (see Lee et al. 2010a). When considering the objects with a sufficient [O ii] emission signal (S/N[O ii]⩾3; Figures 5(b) and (c)), PAH emission is hardly found for low SSFR[O ii] BEGs, whereas the stacked spectrum of the high SSFR[O ii] BEGs shows a clear PAH emission feature. This confirms the fact that PAH emission reflects current SF. It is noted that 14 BEGs have low S/N[O ii], which may be mainly due to the difficulty in measuring the [O ii](3727 Å) line using the SDSS spectroscopy (3800–9200 Å) at low redshift.
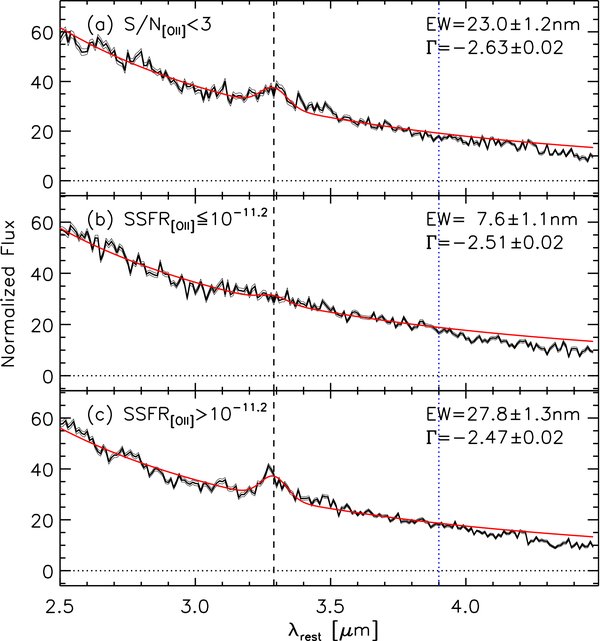
Figure 5. Stacked spectra of BEGs in three subsamples with different [O ii]-based SSFRs: (a) S/N[O ii]<3 (that is, SSFR[O ii] is not available), and among the BEGs with S/N[O ii]⩾3; (b) SSFR[O ii]⩽6.3; and (c) SSFR[O ii]>6.3, in units of 10−12 yr−1.
Download figure:
Standard image High-resolution image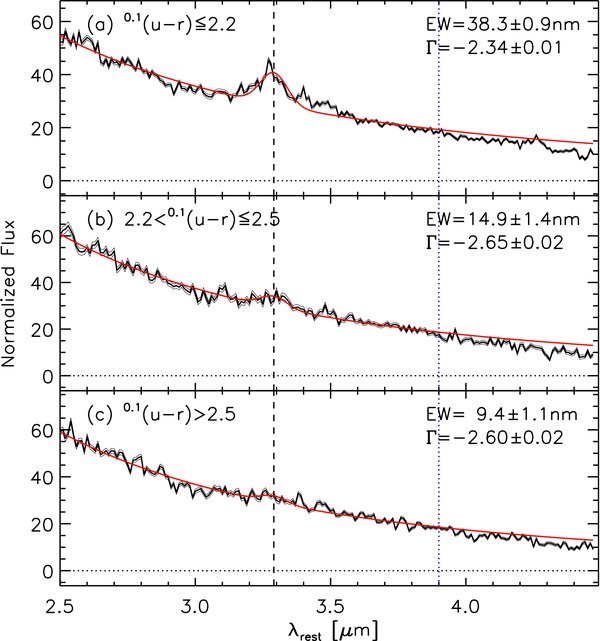
Figure 6. Stacked spectra of BEGs in three subsamples with different optical colors: (a) 0.1(u − r) ⩽ 2.2, (b) 2.2 < 0.1(u − r) ⩽ 2.5, and (c) 0.1(u − r)>2.5.
Download figure:
Standard image High-resolution image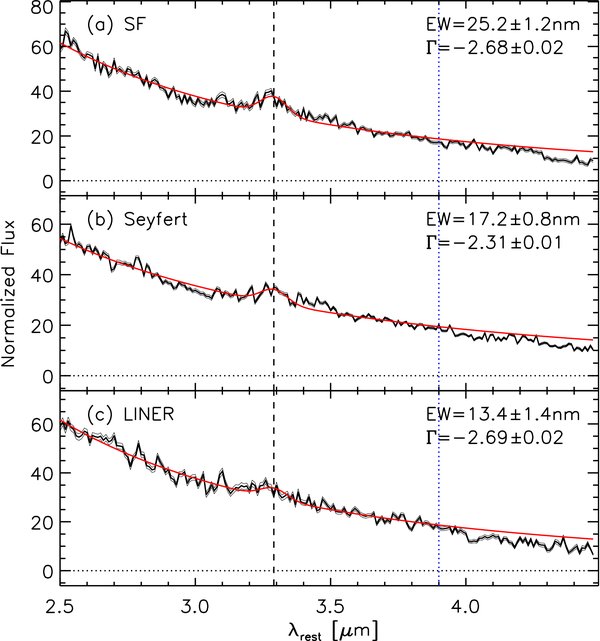
Figure 7. Stacked spectra of BEGs in three subsamples with different optical spectral types: (a) SF BEGs, (b) Seyfert BEGs, and (c) LINER BEGs.
Download figure:
Standard image High-resolution imageFigure 6 shows that the bluer BEGs have the stronger PAH emission feature, which indicates that the blue colors of BEGs reflect their SF activity. This trend is also confirmed in Figure 7: the PAH equivalent width (EW3.29) of SF BEGs (25.2 nm) is larger than those of Seyfert and LINER BEGs (17.2 nm and 13.4 nm, respectively). In Figure 7, it is noted that the EW3.29 of Seyfert BEGs (17.2 ± 0.8 nm) is larger than that of LINER BEGs (13.4 ± 1.4 nm) by more than 2σ. Seyferts show stronger AGN activity than LINERs (e.g., Groves et al. 2006) and the current consensus on the relationship between AGN activity and PAH/SF is that the AGN activity destroys PAH particles and suppresses SF (Voit 1992; Antonuccio-Delogu & Silk 2008; Rafferty et al. 2008). Apparently, however, our results seem to be contradictory to such previous understanding (i.e., Seyfert BEGs are more active than LINER BEGs in both AGN and SF activity).
5. DISCUSSION
5.1. The Identity of BEGs from the AKARI View
BEGs are known to have not only very young stars but also a considerable amount of old stars (Menanteau et al. 2001a; Ferreras et al. 2005; Lee et al. 2010a). In our results, however, it is not easy to check this previous knowledge independently, because the NIR continuum slope (Γ) depends on both stellar and dust contents (dust either in host galaxies or in AGN tori). Figure 8 shows the variation of Γ as a function of age, metallicity, star formation history, and dust attenuation, using the models of Bruzual & Charlot (2003): simple stellar population (SSP), exponentially decreasing, and constant SFR models. In Figure 8, it is found that Γ becomes less negative as SF ended earlier, as age increases, as metallicity increases, and as dust increases. Due to this degeneracy, it is difficult to tell the dominant factor in determining Γ of BEGs. Even if we suppose that the NIR continuum of the BEGs is old-SSP-dominated from previous knowledge (the age of most stars in BEGs is about 10 Gyr; e.g., Ferreras et al. 2005; Lee et al. 2010a), the Γ of the BEGs can be reproduced using either the metal-rich SSP model without dust or the significantly dust-attenuated SSP model with solar metallicity.

Figure 8. Comparison of the NIR continuum slope (Γ) between population synthesis models and the stacked spectra of BEGs: (a) the SSP models with solar metallicity (Z = 0.02) and various dust attenuation values (solid, long-dashed, short-dashed, and dotted lines for τV =0, 1, 5, and 10, respectively, where τV is the dust optical depth in the V band); (b) the SSP models with τV = 0 and various metallicity (short-dashed, solid, and long-dashed lines for Z = 0.008, 0.02, and 0.05, respectively; and (c) the exponentially decreasing SFR model with the exponential timescale of 1 Gyr (EXP; long-dashed and dotted lines for τV = 0 and 10, respectively), and the model with constant SFR of 1 M☉ yr−1 (CONST; solid and short-dashed lines for τV = 0 and 10, respectively), with Z = 0.02. The shaded area shows the Γ range of the BEG stacked spectra and the horizontal solid line shows the Γ value of the all-BEG-stacked spectrum. Dust attenuation was estimated using the simple model of Charlot & Fall (2000).
Download figure:
Standard image High-resolution imageThe effect of internal dust extinction is independently checked using the information extracted from the SDSS data; that is, using the Balmer decrement. Based on the formula of Calzetti et al. (1994), we derived the internal reddening E(B − V)i (median value for each subsample) and compared them with the Γ and EW3.29 of the stacked BEGs in Figure 9. It is found that the NIR spectral parameters have correlations with E(B − V)i, in the sense that the Γ and EW3.29 increase with increasing E(B − V)i. The E(B − V)i values of the BEGs are not small, but seem to be not large enough to explain the Γ of the BEGs in Figure 8 (the τV corresponding to E(B − V) = 0.4 is 1.14; De Ruyter et al. 2005). Thus, if we suppose moderate (not too strong) dust attenuation in the BEGs, Figure 8 indicates that the BEGs may have stellar populations with slightly high metallicity, although this estimation is strongly model-dependent.
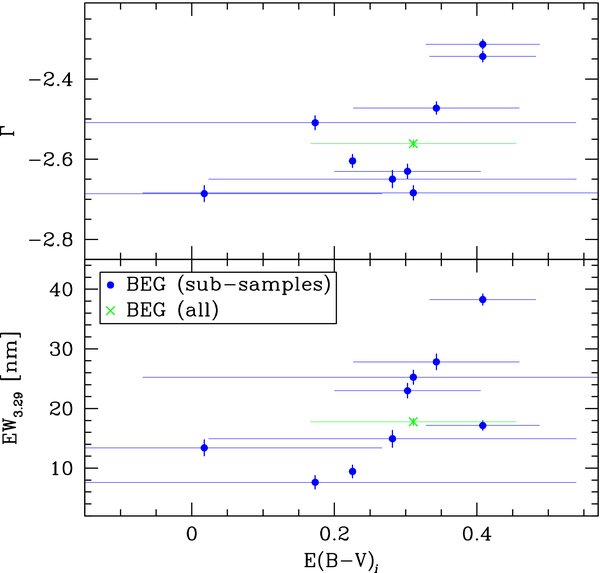
Figure 9. Internal extinction E(B − V)i vs. Γ and EW3.29 of the BEGs. Filled circles are the values from the subsample-stacked spectra and crosses are the values from the all-BEGs-stacked spectrum. The horizontal error bars indicate the sample inter-quartile range for the median E(B − V)i value in each subsample.
Download figure:
Standard image High-resolution imageMeanwhile, BEGs are often thought to be the intermediate objects transforming from interacting galaxies or mergers to red elliptical galaxies or bulges of late-type galaxies (Lee et al. 2006, 2008; Kannappan et al. 2009). Known to have similar origins are Ultra-Luminous Infrared Galaxies (ULIRGs). ULIRGs are very luminous in the IR band due to vigorous starburst and/or AGN activity (Veilleux et al. 1995, 1999a), and are thought to be formed by strong interaction or merger of two disk galaxies (Sanders et al. 1988). Risaliti et al. (2006, 2010) estimated the Γ and EW3.29 of some ULIRGs showing an interesting division between AGN-host ULIRGs and starburst ULIRGs.
Figure 10 shows the loci of our BEGs on the Γ–EW3.29 plane, compared with the objects presented in Risaliti et al. (2010). In this figure, it is found that our BEGs have Γ and EW3.29 values distinct from those of the ULIRGs, in the sense that the BEGs have largely negative Γ values (∼−2.5), while those of the ULIRGs are mostly larger than −2 (up to 6). The EW3.29 of the BEGs is smaller than that of the ULIRGs on average, showing that the SF in the BEGs is not as active as that in the ULIRGs. The Γ value is expected to be largely positive when the NIR continuum is dominated by dust emission. In our BEG sample, however, even the stacked spectra using optical AGN or optical SF BEGs have largely negative Γ. This indicates that the dust amount in those BEGs may not be as large as that in ULIRGs, as shown already using the internal dust reddening derived from the Balmer decrement (the mean E(B − V) value of ULIRGs is larger than 1.0; Veilleux et al. 1999a, 1999b).
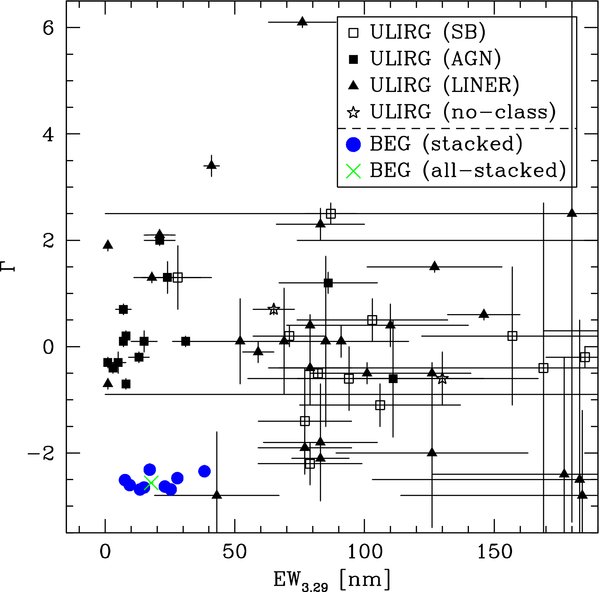
Figure 10. Comparison between BEGs and other objects in the Γ–EW3.29 plane. The data for starburst ULIRGs (SB ULIRGs; open rectangles), AGN ULIRGs (filled rectangles), LINER ULIRGs (filled triangles), and not-classified ULIRGs (open stars) are from Risaliti et al. (2010). The filled circles are BEGs stacked in bins of several properties and the cross shows the all-BEGs-stacked result.
Download figure:
Standard image High-resolution imageIn short, the Γ and EW3.29 features of the BEGs are not easy to interpret, because they are affected by the combined effects of age, metallicity, star formation history, and dust attenuation. However, based on some previous knowledge, Balmer line information, and a few assumptions, the BEGs are thought to be old-SSP-dominated metal-rich galaxies with moderate dust attenuation. The dust attenuation in the BEGs may originate from recent SF or AGN activity. This interpretation is consistent with the previous understanding of stellar populations in BEGs (that is, mostly old stars + partially young stars; Ferreras et al. 2005; Lee et al. 2010a). There is a possibility that ULIRGs are the progenitors of BEGs in the merging/interacting phase (Veilleux et al. 2002), but any clear evidence of the close relationship between BEGs and ULIRGs is not yet found in our results based on the NIR spectroscopy.
5.2. NIR Features and AGN Activity in BEGs
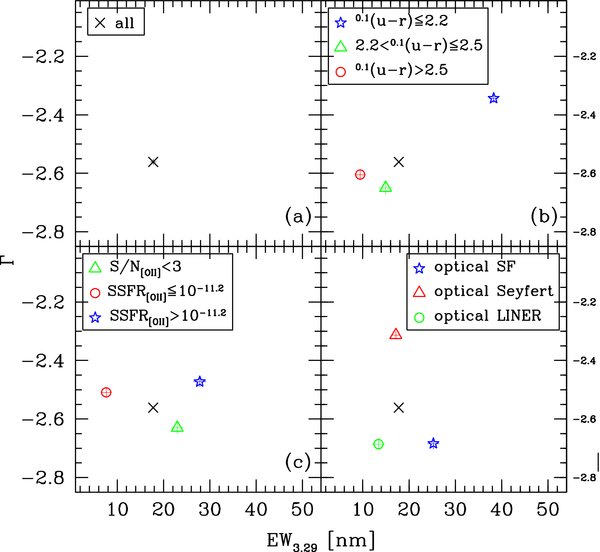
As introduced in Section 1, NIR spectroscopy provides interesting clues to the internal evolutionary process of the BEGs, related to their SF or AGN activity. Those clues become more useful when combined with the optical properties of the BEGs. Figure 11 compares the stacked spectra in bins of several properties on the Γ–EW3.29 plane, giving a summary of the key results in Figures 4–7. The EW3.29 reflects the current SF of the BEGs well (Figure 11(c)), but it is noted that the Seyfert BEGs have EW3.29 larger than that of the LINER BEGs. As mentioned at the end of Section 4, this result is not well explained simply by the current consensus that AGN activity destroys PAH particles.
Figure 11. Γ vs. EW3.29 of the BEGs stacked in bins of several properties: (a) all, (b) 0.1(u − r) color, (c) SSFR[O ii], and (d) optical spectral type. In each panel, the all-BEGs-stacked result is denoted as a cross.
Download figure:
Standard image High-resolution image
In addition to EW3.29, another key parameter is Γ. As shown in Figure 8, Γ is commonly affected by age, metallicity, and dust. However, the bluest BEGs with the largest (least negative) Γ in Figure 11(b) are not easily understood by the age or metallicity effects, because blue galaxies tend to be young or metal-poor, which will make Γ more negative, unlike the bluest BEGs. Thus, the Γ difference between the bluest BEGs and the other BEGs seems to be mainly due to the difference in their dust contents. It is also noted that the optical SF BEGs have small (largely negative) Γ in Figure 11(d), which shows good consistency with the SF history dependence of Γ, indicating that those SF BEGs are not very dusty. That is, several AGNs with dusty tori in the bluest BEG subsample seem to mainly contribute to the largest (least negative) Γ.
In Figure 11(c), the BEGs with large SSFR[O ii] have Γ intermediate between those of the bluest BEGs and optical SF BEGs. These are because the optical color, SSFR, and optical spectral type of the BEGs do not tightly correlate: some non-SF BEGs have large SSFR[O ii] or blue 0.1(u − r) color. These results lead us again to the conclusion that the SF and the AGN activity in BEGs are not necessarily contradictory to each other. The coexistence of SF and AGN is not an entirely new discovery (e.g., Tzanavaris & Georgantopoulos 2007; Treister et al. 2009), but currently it is widely believed that the AGN activity tends to destroy PAH particles and truncate SF (Voit 1992; Weinmann et al. 2006; Schawinski et al. 2007; Tortora et al. 2009). In our result, however, Seyfert BEGs have larger EW3.29 than LINER BEGs, in spite of the fact that Seyferts show stronger AGN activity than LINERs.
This result may be explained by various ways. Smith et al. (2007) and Imanishi et al. (2008) showed that PAHs can survive even if they are close to AGNs when the AGNs are not dust-free, which gives an answer to how the AGN activity and PAH emission coexist. However, it does not sufficiently explain why stronger AGNs have stronger PAH emission features. One possibility is that Seyfert BEGs and LINER BEGs may not be the separate branches in BEG evolution. Satisfying our results, one possible scenario of BEG evolution is as follows (see also Lee et al. 2010a).
- Ph.1SF BEG phase. Triggered by some mechanisms (possibly interaction or merger; Lee et al. 2006), active (but not very dusty) SF occurs in the progenitor of a BEG, originally consisting of old stars in the main. The NIR continuum is very similar to that of old passive galaxies, but the PAH emission is clearly detected.
- Ph.2Seyfert BEG phase. After the central black hole in a BEG increases its mass by gas accretion, the AGN activity starts. The SF in the BEG starts to be suppressed by the AGN feedback, but at this time, both AGN and SF activities coexist. The NIR continuum is contaminated by the AGN (Γ increases), and the PAH emission becomes weaker than that of SF BEGs.
- Ph.3LINER BEG phase. The AGN feedback has truncated most SF by removing ambient gas in the BEG. Since this makes the gas accretion into the central black hole stop also, the AGN activity becomes weak as a natural result. The NIR continuum is intermediate between SF BEGs and Seyfert BEGs, and the PAH emission feature is the weakest among the three phases.
After these three phases, the BEGs may evolve into REGs or bulges of late-type galaxies via the phase of passive BEGs (Lee et al. 2006, 2008; Kannappan et al. 2009). The proposed scenario is consistent with the findings about the relationship between Seyferts and LINERs in several recent studies (Schawinski et al. 2007, 2009; Hickox et al. 2009; Lee et al. 2010a).
6. SUMMARY
We conducted an AKARI NIR spectroscopic survey of SDSS-selected BEGs. We secured the NIR spectra of 36 BEGs that are well balanced in their SF/Seyfert/LINER composition. We stacked the BEG spectra in its entirety and in bins of several properties, such as color, SSFR, and optical spectral type. This is the first presentation of the BEG NIR (2.5–4.5 μm) spectra, from which we estimated the NIR continuum slope (Γ) and the equivalent width of 3.29 μm PAH emission (EW3.29).
In the comparison between the estimated NIR spectral features of the BEGs and those of the model galaxies, the BEGs seem to be old-SSP-dominated metal-rich galaxies with moderate dust attenuation. The dust attenuation in the BEGs may originate from recent SF or AGN activity and the BEGs have a clear feature of PAH emission, the evidence of current SF. BEGs show NIR features different from those of ULIRGs, from which we cannot find any clear relationship between BEGs and ULIRGs.
We compared the stacked spectra of the BEGs in bins of several properties, confirming that the PAH emission is a good indicator of current SF. We found that Seyfert BEGs have more active SF than LINER BEGs, in spite of the fact that the AGN activity in Seyfert BEGs is stronger than that in LINER BEGs. One possible scenario satisfying both this result and the AGN feedback is that SF, Seyfert, and LINER BEGs form an evolutionary sequence: SF → Seyfert → LINER.
J.H.L. is a member of the Dedicated Researchers for Extragalactic AstronoMy (DREAM) in Korea Astronomy and Space Science Institute (KASI). This paper is based on the data produced in the AKARI open-time phase-3 project, Infrared Spectroscopy of Blue Early-type Galaxies (ISBEG; PI: J.H.L.). The AKARI is a JAXA project with the participation of ESA. The authors appreciate the help and support of the all AKARI project members. The authors are grateful to an anonymous referee for useful comments. This work was supported by the National Research Foundation of Korea (NRF) grant funded by the Korea Government (MEST; No. R01-2007-000-20336-0). Funding for the SDSS and SDSS-II has been provided by the Alfred P. Sloan Foundation, the Participating Institutions, the National Science Foundation, the US Department of Energy, the National Aeronautics and Space Administration, the Japanese Monbukagakusho, the Max Planck Society, and the Higher Education Funding Council for England. The SDSS Web site is http://www.sdss.org/. The SDSS is managed by the Astrophysical Research Consortium for the participating institutions. The participating institutions are the American Museum of Natural History, Astrophysical Institute Potsdam, the University of Basel, the University of Cambridge, Case Western Reserve University, the University of Chicago, Drexel University, Fermilab, the Institute for Advanced Study, the Japan Participation Group, Johns Hopkins University, the Joint Institute for Nuclear Astrophysics, the Kavli Institute for Particle Astrophysics and Cosmology, the Korean Scientist Group, the Chinese Acadeour of Sciences (LAMOST), Los Alamos National Laboratory, the Max-Planck-Institute for Astronomy (MPIA), the Max Planck Institute for Astrophysics (MPA), New Mexico State University, Ohio State University, the University of Pittsburgh, the University of Portsmouth, Princeton University, the US Naval Observatory, and the University of Washington. This publication makes use of data products from the 2MASS, which is a joint project of the University of Massachusetts and the Infrared Processing and Analysis Center/California Institute of Technology, funded by the National Aeronautics and Space Administration and the National Science Foundation.
Footnotes
- 5
Absolute Petrosian magnitude in the r band with K-correction as if the object were at z = 0.1 (Lee et al. 2008). All magnitudes in this paper are in the AB system.
- 6
Here, BEGs are bluer than the Gaussian peak in the (g − r) color distribution of the bright (0.1Mr < −20) early-type galaxies, by more than 3σ, where σ is the Gaussian spread.
- 7
The "20 mag arcsec−2 isophotal Ks fiducial ellipse aperture magnitude" from the 2MASS (Jarrett et al. 2000) Extended Source Catalog (XSC): http://www.ipac.caltech.edu/2mass/.
- 8
There is various unpredictability in the space telescope operation, which makes it difficult to carry out the observations exactly as planned. Because of such unpredictability, the perfect success of proposed observations is not guaranteed.
- 9