

Abstract
Traditionally, direct imaging of atom diffusion is only available by scanning tunneling microscopy and field ion microscopy on geometry-constrained samples: flat surfaces for STM and needle tips for FIM. Here we show time-resolved atomic-scale HRTEM investigations of CeO2-supported Au nanoparticle surfaces to characterize the surface dynamics of atom columns on gold nanoparticles. The observed surface dynamics have been categorized into four types: layer jumping, layer gliding, re-orientation and surface reconstruction. We successfully captured atoms moving in a concerted manner with a time resolution of 0.1 s. A quantitative approach for measuring the dynamics in various gaseous surroundings at elevated temperatures is presented. An approach for measuring quantitative electron beam effects on the surface dynamics is presented by counting atom column occupation as a function of time under a range of dose rates in high vacuum.
Export citation and abstract BibTeX RIS

Original content from this work may be used under the terms of the Creative Commons Attribution 4.0 license. Any further distribution of this work must maintain attribution to the author(s) and the title of the work, journal citation and DOI.
Functional materials' response to stimuli from the surroundings plays a significant role in their performance [1]. State-of-the-art nanomaterials are tailored with a specific purpose in mind. The functionality of such materials relies on the dynamic atomic structure governed not only by the material itself, but also its working environment [2–4]. For example, a detailed understanding of the mechanisms and energetics involved when atoms or small clusters diffuse over surfaces is of crucial fundamental and technological interest, for the development of microscopic models for catalytic reactions and thin-film growth.
Traditionally, two techniques have been used to characterize surface dynamics and diffusion at the atomic level: field ion microscopy (FIM) [5] and scanning tunneling microscopy (STM) [6]. However, these techniques are limited to samples with a certain geometry: sharp metal tips for FIM [5] and flat surfaces for STM [6]. Recently, transmission electron microscopy studies showed that High-Resolution (Scanning) Transmission Electron Microscopy (HR(S)TEM) is capable of visualizing (concerted) atom diffusion on nanoparticles [7–10], graphene [11] and small clusters [12].
Surface dynamics, or diffusion, is a vital concept in heterogeneous catalysis. Not only do the reactant species (usually gas molecules) adsorb, desorb, vibrate and dissociate on the catalysts surface, the solid surface itself is also active due to the molecular adsorption-desorption process. For example, the configuration of the atomic arrangement of Pt single crystalline surfaces change from 1 × 2 superlattice to 1 × 1 superlattice due to CO adsorption and desorption [13]. The reversible behavior of catalytic reactions under fixed conditions has attracted wide attention during the last decades [10]. This reversible behavior is commonly perceived as a reversible transformation between bistable states. The first successful synchronous in situ TEM characterization of periodic reaction changes and periodic morphology refacetting was conducted on Pt nanoparticles by Vendelbo et al [1]. To fully understand catalytic processes, fundamental investigations of dynamic morphology responses of the catalysts should be considered.
It is natural to consider the variety of morphologies of nanoparticles and small clusters as local minima in the potential energy landscape of configurational space. For example, real-time observations and theoretical simulations [14] have proven that SiO2 supported Au nanoparticles are prone to morphological transformations as a function of time under electron beam illumination. The nanoparticles vary between different configurations, such as decahedral, icosahedral, single crystals etc, with an equilibrium phase diagram calculated by Barnard et al [15]. The equilibrium shape of the nanoparticles upon exposure to different gases has to some extent been studied experimentally [16, 17] and theoretically [18]. However, catalytic nanoparticles are not rigid but vigorously dynamic under reaction or reactive conditions [1, 3].
Thermally activated site-to-site diffusion of atoms on surfaces can occur either via a simple hop mechanism or via an exchange mechanism [19, 20]. For small clusters with more than one atom, these atoms could also move in a concerted way [21], which has been identified by STM observations, e.g. the diffusion of a Ge dimer along the surface troughs is accompanied by a concerted motion of substrate atoms in the proximity of the diffusing dimer [22].
Au/CeO2 model systems have been studied extensively in the past decades, mainly focusing on the static structure at the atomic level. However, the surface dynamics on individual nanoparticles at the atomic level is rarely reported [23]. Only a few works show descriptive results as a function of time under the influence of the surroundings [2, 24–26]. By establishing a morphology diagram under various gas conditions, with due consideration to electron beam irradiation effects, the conclusion reached was that morphology changes correlate well with the catalytic activity of supported gold nanoparticles (GNPs) on CeO2. During CO oxidation in CO/air mixtures, it is possible to state that [4]: (1) CO molecules are adsorbed on the surface of GNPs and stabilize GNPs exhibiting the polyhedral shape enclosed by the major {100} and {111} facets; (2) O2 molecules are dissociated into oxygen atoms or active oxygen-related species by the catalyst, partly with the aid of electron irradiation, thus inducing the formation of rounded or fluctuating multifaceted surfaces of GNPs. The surface structure of gold indeed affects the nature of oxygen adsorbed on the surface. Step sites bond oxygen adatoms more tightly than terrace sites [27, 28]. In the presence of oxygen at low coverage, atomic oxygen interacts with adatoms repulsively and attractively interacts with vacancies, which could release gold atoms from the surfaces [29]. Various adsorbates on bulk gold surfaces and their desorption temperature are summarized elsewhere [28].
An additional stimulus for the surface dynamics during TEM observation is the high-energy electron beam used for imaging the nanostructures. The dynamic responses of the sample to the electron beam can be classified into reversible or irreversible responses [30]. The reversible response is by nature less prone to the accumulated dose but more to the dose rate, in contrast to the irreversible response, where accumulated dose plays a significant role.
Here, we report on different types of (concerted) surface dynamics of Au nanoparticles with respect to the thermal and gaseous environment as well as (accumulated) dose of the electron beam irradiation on the sample.
1. Results and discussion
The static morphology of Au nanoparticles has been studied for decades under various conditions, e.g. different temperature [31], gas species [4] and pressures, especially after the commercial MEMS chips launched, at pressures up to ambient pressure [32] and temperatures approaching the melting point of the nanoparticles [31]. However, these works mainly focus on the equilibrium shape of the nanoparticles, isolated or supported on oxide. Here, we report on the atomically resolved surface dynamics of the Au nanoparticles under gas exposure at elevated temperature, revealing different types of surface dynamics categorized and discussed below. A summary of the observations is presented in table S1. The present observations of atomic rearrangement of Au nanoparticles are based on HRTEM images and movies. The time resolution of the acquired movies is dictated by the acquisition time and thereby consist of a series of snapshots. Although there is no deadtime between the snapshots, the prolonged acquisition time can result in diffusion processes being averaged in the resulting snapshots. Furthermore, the diffusion processes described here are dominantly processes in the viewing plane as HRTEM images have limited information on the atomic positions along the viewing direction.
In general, the CeO2 supported gold nanoparticles used in this study have a typical truncated octahedral shape enclosed by {111} and {100} facets [4]. The interface between CeO2 (111) and the Au nanoparticle is Au (111)//CeO2 (111) with two preferred orientations, Type I CeO2 [− 110]//Au [− 110] and Type II CeO2 [− 110]//Au [1 − 10] [33].
2. Layer jumping
TEM images are projected along the direction of the electron beam, hence the facets which are not perpendicular to the projection plane, are not directly detectable from TEM images. We divide the layer jumping into two sub-groups: layer jumping out of the projection plane and layer jumping within the projection plane.
2.1. Layer jumping out of the projection plane
The atomic layers jump reversibly on the surface facets of supported Au nanoparticles upon exposure to different gases; H2 (supporting information, Movie1 and Movie2), CO (Movie3), and O2 (Movie4) respectively. The influence of temperature on the kinetics of layer jump in 4.5 Pa H2 is also discussed in this section.
Figure 1 shows individual frames of Movie1 illustrating the Au layer jumping process of a supported Au nanoparticle under exposure to 4.5 Pa H2. At time t = 0.1 s of the movie sequence (figure 1(a)), the Au nanoparticle has an atomic configuration of 6 × 5 × 11 × 10, where the numbers refer to the number of visible atomic columns on each projected surface facet as indicated on the figure. At t = 1.8 s (figure 1(b)), the configuration changed to 5 × 6 × 10 × 10 due to the surface facet with five columns disappearing from the projection view, indicated by a red arrow (figure 1(a)). The corresponding intensity change during the formation of the (100) atomic layer observed by HRTEM at different times is shown in figure 2. The intensity profile of the 5-column layer is extracted from the images for t = 2.1 s and t = 4 s (figure 2(b)), an additional intensity profile in the vacuum area adjacent is also extracted for comparison. At t = 5.1 s (figure 1(c)), the configuration changed back to 6 × 5 × 11 × 10 with the 5-column layer reappearing. Such surface dynamics is defined as layer jumping; the 5-column layer is jumping back and forth to a visible facet and an invisible facet as time elapses, so the configuration of the Au nanoparticle switches back and forth between two states (6 × 5 × 11 × 10 and 5 × 6 × 10 × 10), where the numbers are the columns on each enclosed facet on the 2D image. Figure 1(d) shows the configuration evolution at 350 °C and figure 1(e) shows 300 °C. The general lifetime of configuration 6 × 5 × 11 × 10 (with the 5-column layer visible) at 350 °C is shorter than at 300 °C, demonstrating the stability of each configuration is dependent on the temperature. Details are listed in table S1.
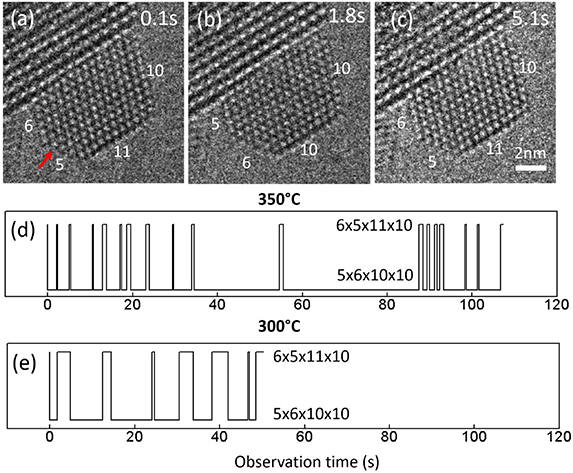
Figure 1. Stills from Movie 1 showing a supported Au nanoparticle truncated by {111} facets and {100} facets. The number of columns in each surface facet has been counted and labeled accordingly. The atomic arrangements of the particle vary between two configurations 6 × 5 × 11 × 10 and 5 × 6 × 10 × 10. The variation of the atomic configuration as a function of time at 300 °C (e) and 350 °C (f) respectively. The exposure time of each frame was 0.1 s and the movies were taken under 4.5 Pa H2. The dose rate was 733 e−Å−2 s−1.
Download figure:
Standard image High-resolution image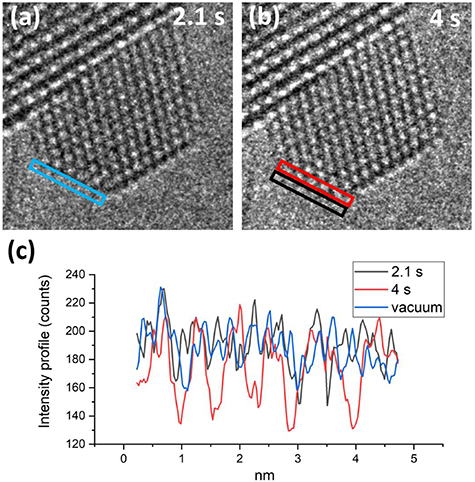
Figure 2. Two snapshots of CeO2 supported Au nanoparticle at 2.1 s (a) and 4 s (b). (c) Intensity profiles produced by the layers bounded by the colored boxes. The black and blue intensity profiles have similar contrast; the red intensity profile has significantly higher contrast which is the same location as blue box. Experimental conditions: 0.1 exposure time per frame, 4.5 Pa H2 at 350 °C.
Download figure:
Standard image High-resolution imageSimilar surface layer jumping is observed under 4.5 Pa CO and O2 respectively. Reversible (100) layer jumping on Au nanoparticles (figure S1 (stacks.iop.org/JPhysMaterials/3/024009/mmedia)) and Movie3) under 4.5 Pa CO at 200 °C as well as (111) layer jumping (figure S2 and Movie4) under O2 at 700 °C are observed.
Atomic layer jumping on the nanoparticles was only observed in the presence of gas at elevated temperatures, such as 250 °C in CO, 200 °C–350 °C in H2 and 200 °C–300 °C in O2 (100) and 450 °C–700 °C in O2 on (111) facets. In general, all the cases in CO and H2 occurred on the {100} facets, and most cases in O2 occurred on the {111} facets (detailed information found in table S2 in the supplementary information). It is essentially a thermodynamically driven process, but the surrounding gas environments interact in different ways on the {111} and {100} facets. In general, the observed lifetime of a specific spatial configuration is shorter at higher temperatures. The increased frequency of the jumping of atomic layers at higher temperature is in line with an increased diffusivity at higher temperatures.
2.2. Layer jumping in the projection plane
Figure 3 shows a nanoparticle consisting of two twins: top twin (black) with six atomic layers and bottom twin (red) with three layers (figures 3(c) and (f)), where green disks represent the twin boundary. The nanoparticle repeatedly transforms between two atomic arrangement configurations. In configuration 1 the nanoparticle is truncated by five surface facets labeled A, B, C, D, and E while in configuration 2 the nanoparticle is enclosed by six surface facets A, B, C, D, E, and F. The dynamical process is shown in Movie5. During the configurational transformation, the twin boundary always remains in the same position relative to the particle-substrate interface.
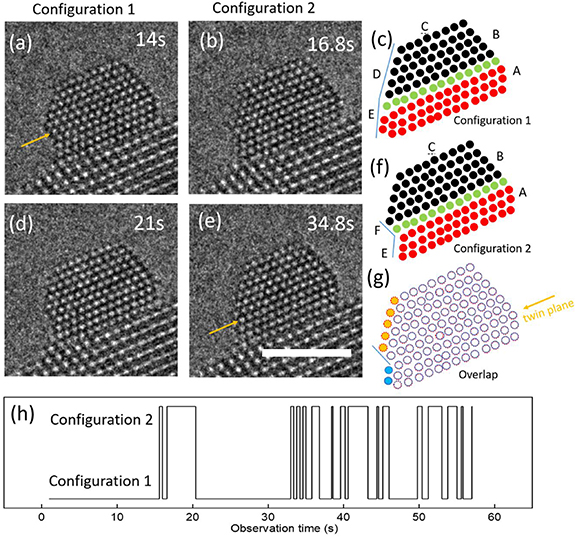
Figure 3. Stills from Movie 5 showing high-resolution images of the atomic structure of an Au nanoparticle with two crystallographic twins. (c) and (f) are schematic representations of the area indicated by the blue box, where black circles represent atomic columns in the top twin and red circles represent atomic columns in the bottom twin. The green layer is the twin plane. In configuration 1, the twin boundary associated angle between facet D and E is a convex configuration. In configuration 2, a new facet F is formed and the twin boundary associated corner angle between F and E is now in a concave configuration. (g) Overlapped schematic of the two configurations. Dashed red circles represent configuration 1, and the solid blue circles represent configuration 2. A comparison between these two configurations shows that configuration 1 has five more columns indicated by a filled red circle on facet D and configuration 2 has two more blue filled columns on facet E. (h) is the configuration transformation as the prolonged movie. Experimental conditions: 350 °C, 5.5 Pa O2. The dose rate was 713 e−Å−2 s−1. Scalebar is 2 nm.
Download figure:
Standard image High-resolution imageIn order to understand the difference in atom arrangement between these two specific scenarios, the schematics are overlapped in figure 3(f). Open circles represent columns that remain in the same locations. The solid circles are the differences between these two configurations: configuration 1 has five more columns indicated by filled orange circles on facet D; configuration 2 has two more blue filled columns on facet E. The dynamical transformation from configuration 1 to configuration 2 occurs by the disappearance of the five red columns and the appearance of two blue columns while the transformation from configuration 2 to configuration 1 is the reverse process. Such scenarios suggest that facet D and facet E are two sites to which diffusing adatoms prefer to attach if these facets are in close proximity. Atoms detached from either facet D or facet E can fill facet E or facet D, respectively, for short periods as Movie5 shown.
The average lifetime for configuration 1 and configuration 2 are 2.56 s ± 4.57 and 0.97 s ± 1.02, respectively. Configuration 2 has a relatively short lifetime consistent with the atom columns, not exactly fitting the equilibrium crystalline phase due to internal twins and thereby being less stable.
3. Layer gliding
3.1. Single layer gliding
In addition to the layer jumping described above, the atom columns on the surface facet layer are observed to glide in a concerted way under some conditions. In figure 4, the columns on the topmost layer shift to the left at t = 20.6 s (the red box) and shift back to the original location at t = 21.2 s (the blue box), the gliding distance is 0.06 nm, which is seven pixels (pixel size is 0.0089 nm). The intensity profile in figure 4(b) illustrates the concerted movement of the atom layer. For a single profile, the distance between the peaks stays the same as the whole layer is gliding. The profiles are aligned to a reference point on the substrate (yellow circle indicated). After this reversible process, there is one column missing from the projection view indicated by yellow arrows at t = 20 s and t = 21.2 s. At time t = 20.6 s, the green arrow indicates a column deviating from its original location toward the vacuum, forming a typical surface facet. The dynamical processes are shown in full length in Movie6.
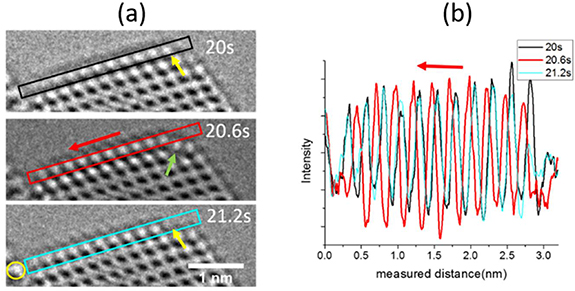
Figure 4. (a) Stills from Movie6 showing the concerted atom movement at the Au (111) surface. (b) Line profiles corresponding to the colored boxes in (a) aligned using a reference area on the substrate. All the columns in this layer behave in a concerted manner. Experimental conditions: high vacuum. The dose rate is 49 × 103 e−Å−2 s−1.
Download figure:
Standard image High-resolution image3.2. Twinning-detwinning by layer gliding
We found three types of twinning-detwinning processes, two of these formed parallel twins, where the twin boundary is parallel to the interface between Au nanoparticles and CeO2 support (figures 5 and 6). The parallel twinning processes are similar to layer gliding. In layer gliding, only the topmost single layer shifts and introduces a mismatch between the shifted layer and the rest of the layers. However, for a twinning-detwinning process, there are at least two layers gliding. Movie7 shows the first type of the twinning-detwinning process, the two outermost layers of the Au nanoparticle glide between the original state and the twinned state. Some snapshots are shown in figure 5, revealing two distinct atomic configurations, corresponding to the twinned state and the original state. In figures 5(a) and (c), the atoms in the outermost three surface layers parallel to the interface arrange in a different direction from the atoms in the other layers.

Figure 5. Surface atom diffusion induced surface twinning-detwinning. Red circles guide the reader to the atom columns near the twin plane. Exposure time is 0.2 s for each frame. The dose rate was 3.9 × 10³ e−Å−2 s−1. The electron beam was blanked during the periods indicated by blue boxes in (d) and (e).
Download figure:
Standard image High-resolution image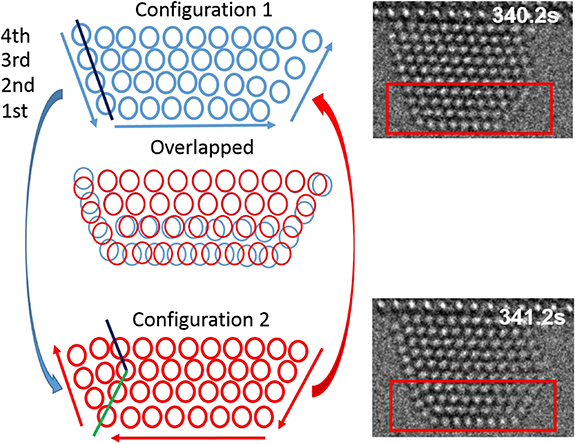
Figure 6. Surface twinning-detwinning via surface atom column concerted diffusion. The atom schematics are extracted from the red box areas showing the transition process between configuration 1 and configuration 2.
Download figure:
Standard image High-resolution imageThe detailed positions of the atoms in figure 5 of configuration 1 and configuration 2 have been sketched in figure 6. For the analysis of the twinning nucleation and kinetics, these two configurations are overlapped to show the differences in the atomic position. The blue surface column atoms in configuration 1 diffuse in the anticlockwise direction to new positions as indicated by red circles for configuration 2. The distance of movement of each atom column, especially the top surface and subsurface columns, is different, as sketched, while the other atom columns stay at the same positions.
In order to understand the effect of strain on such reversible dynamics, atomic strain mapping of configuration 1 and configuration 2 are shown in figure 7. We use a template matching based approach [34] to calculate the local strain at each column position. We compare an ideal reference lattice to the measured local lattice. The local lattice is comprised of the nearest and second-nearest neighbours of each lattice point. A least-squares fit determines the optimal transformation between the two local lattices, from this transformation, the strain can be extracted and decomposed in any direction, for example, parallel and perpendicular to the interface. The planar strain is the average of parallel and perpendicular strain.
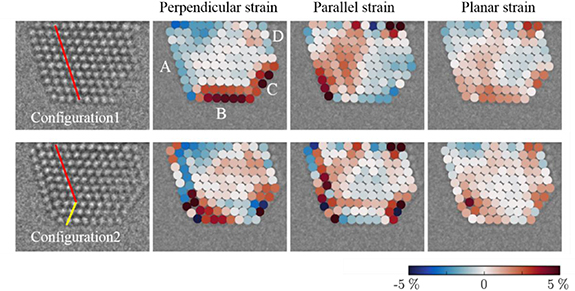
Figure 7. Strain mapping of configuration 1 and configuration 2. The nanoparticle-substrate interface is used as a reference; the perpendicular strain refers to the strain perpendicular to the interface. The strain mapping of configuration 2 is under the assumption that the third layer (from the surface) is a twin plane. A, B and D are {111} facets and C is (100) facet.
Download figure:
Standard image High-resolution imageConfiguration 1 has strong perpendicular expansion strain in the top 2 layers on the (111) facet B and (100) facet C. In the parallel direction, the left part of the nanoparticle shows expansive strain, and the right part shows compressive strain. Configuration 2 has a large expansive strain at corner sites in both perpendicular and parallel directions. Here, the strain calculation only considers the six surrounding columns for a specific column without a periodic template, which means twin-boundary-induced crystallographic distortion is not included in the strain map. The details of the strain mapping from high-resolution TEM images are described by Madsen et al [34].
It can be speculated that the potential energies of these two configurations may be similar since configuration 1 has larger surface strain than configuration 2, while configuration 2 has a twin boundary inside, which will give an additional contribution to the potential energy.
A possible means of overcoming the energy barrier between these two configurations could be by external stimuli e.g. thermally by way of increasing temperature, or adsorbate-driven i.e. adsorption of molecules from the surrounding atmosphere on the surfaces of the nanoparticles.
Movie8 shows the second type twinning-detwinning process, it is a similar twinning process as previously described, but the gliding happened among three inter layers one by one resulting in a new twin, the right major part of the nanoparticle moves as a rigid body with respect to the three gliding layers. As shown in figure S3, at t = 18.4 s, the red line indicates that part of the particle shifts upward by 0.2 nm (one (111) lattice spacing) while the topmost three layers slide with a displacement of approximately 0.67 nm (one-third of the lattice spacing). As a result, a three-layer new twin forms beside the interface. The total time for the twin formation process was ≤ 1.8 s, from t = 16.6 s to t = 18.4 s. However, the twin close to the interface was not stable. For example, at t = 20.2 s, as the top part of the particle rigidly slides back, one layer of the new twin shifts to the original lattice location, and only two layers are left of this twin. As the process continues, the twin disappears at t = 21.4 s.
The dynamics depend on the temperature, for the same nanoparticle. At 200 °C (figure S1), the nanoparticle layers are jumping, while at 300 °C (figure 5), the nanoparticle governs the twinning-detwinning process.
4. Twinning-detwinning by re-orientation
The formation of twins terminating at the Au/CeO2 interface resulting in part of the Au particle changing the particle/support epitaxial relationship is also observed. Figure 8 and Movie9 show such a twinning-detwinning process.
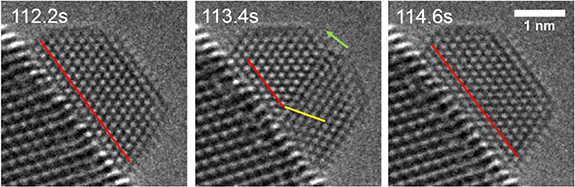
Figure 8. Intersection twinning evolution with the twinning plane intersecting the particle-substrate interface. Red lines indicate the original atom arrangement direction, and the yellow line indicates the atom arrangement in the new twin. The green arrow is normal to the twin plane. Experimental conditions: 600 °C, 5.5 Pa O2. Dose rate is 621 e−Å−2 s−1.
Download figure:
Standard image High-resolution imageThe red lines in figure 8 indicate the original atom arrangement direction, while the yellow line indicates the atom arrangement direction in the new twin. In this case, the bottom part of the nanoparticle transforms to a different orientation at t= 113.4 s and changes back to the original orientation at t = 114.6 s. Twins are easily formed in gold due to its low stacking fault energy, there are several structures with multiple twins for gold nanoparticles, such as decahedral and icosahedral [14]. Isolated gold nanoparticles can transform among these structures under electron beam irradiation [14] or at increased temperature. However, for supported nanoparticles, geometric constraints enforced by the metal/support interface could limit the free rotation around the axis perpendicular to the twin. The phenomena reported here demonstrate the possibility of such a twinning mechanism for supported nanoparticles.
5. Surface reconstruction
Figure 9 shows a (100) surface layer reconstructing under electron beam irradiation. At t = 90 s, the intensity of the depicted surface atoms is elongated parallel to the surface. The elliptical spot (t = 90 s) splits into two peaks (t = 91 s) with one staying in the same crystallographic site, and the other displaced by 0.08 nm from the nearest crystallographic site as shown in figure 9(c). After further fluctuations at t = 92 s, the elliptical contrast feature can be seen. The elliptical contrast is possibly induced by a 2 × 1 surface reconstruction of the (100) facet. The reconstruction was observed with a lifetime between t = 2 s and t = 6.2 s at the given experimental conditions. There is another reversible dynamical process happening at the lower right facet of the same Au nanoparticle. The contrast of a single column splits into two peaks, as shown in figure 9(c), again, the atoms move in a concerted way, as the surface reconstruction is synchronized over the entire facet.

Figure 9. Magnified images of the (100) surface reconstruction at selected times. The red box indicates the surface atomic layer reconstructing under electron beam irradiation. Exposure time is 0.2 s for each frame.
Download figure:
Standard image High-resolution image6. Beam effect on surface dynamics
The most common phenomenon observed at the surface of gold nanoparticles is the disappearance and reappearance of atomic columns, indicating that under the applied conditions, atoms migrate on the surfaces of the gold nanoparticles. In an attempt to quantify the effect of the electron beam on the mobility of surface atoms on gold nanoparticles, the column occupancy is registered as a function of time and dose rate.
For conventional surface diffusion studies, the surface atom diffusivity is investigated by surface sensitive techniques. Due to the intrinsic properties of HRTEM images, the quantification method for surface diffusion is not trivial for the following reasons: first, HRTEM images are 2D projections of 3D structures, impeding observation of atom diffusion along the viewing direction. Second, the low signal-to-noise ratio of the contrast, especially at low dose rate, hampers determination of the occupational state rendering some evaluations erroneous due to the strong statistical fluctuation of the noise in such images.
In order to determine how the dose rate affects column hopping (change in atom column occupancy), the hopping rate of the six columns closest to an edge connecting two {111} facets (labeled in figure 10) is determined as a function of dose rate. This is done by counting 'column hopping events' for a single nanoparticle, at dose rates increasing from 6.6 × 10³ e−Å−2 s−1 up to 44 × 103 e−Å−2 s−1, and then decreasing again to 13 × 103 e−Å−2 s−1, to enable us to distinguish between the effects of dose rate and accumulated dose. For each dose rate, at least 350 frames of 0.2 s were recorded, and the occupancy of the individual column was noted. Each time an atomic column disappeared or appeared, an event was logged for that specific column.

Figure 10. A single frame extracted from an image sequence showing the corner of a 4 nm gold nanoparticle. The presence and absence of atomic columns at the corner are clearly identified. The image without annotation is showed to the right for clarity.
Download figure:
Standard image High-resolution imageFigure 11 shows the accumulated count of events for the six atomic columns indicated in figure 10, as a function of dose rate. It should be noted that events in the columns are not independent, as only the outermost columns in the nanoparticle perform column hopping. With column (11) present, diffusion of the underlying columns is not observed. When column (11) is absent, hopping of columns (21) and (12) may occur. In a similar way, column (21) or (12) must be absent for any activity to be seen in columns (31) and (13), respectively, and both must be absent for column (22) to show activity. This is caused by the lower binding energy of the under-coordinated corner atoms. In most cases, hopping events are only observed in a single column between consecutive frames. In rare cases, several columns can hop simultaneously during the exposure time of a single frame.

Figure 11. Accumulated 'significant' contrast changes as a function of time (frame No.) are shown under different dose rates. The colors of the curves correspond to the location of the column (see Figure 6). The dose rate used for temporal image sequences is from 6.6 × 10³ e−Å−2 s−1 up to 44 × 103 e−Å−2 s−1 then reduced to 13 × 103 e−Å−2 s−1. Exposure time is 0.2 s for a single frame. A missing point in the line means no column appears in the image for more than two frames, for example, the black dot-line in dose rate 6.6 × 10³ e−Å−2 s−1, from frame 200 (blue circle marked) column11 disappears in the image.
Download figure:
Standard image High-resolution image
Initially, at a dose rate of 6.6 × 10³ e−Å−2 s−1, column (11) is empty and events are seen in columns (12) and (21), interrupted briefly by events in column (11) where it occasionally fills. Similar behavior is seen in the next two plots, as the dose rate is increased, until late in the plot, at 29 × 103 e−Å−2 s−1, where columns (13), (22) and (31) are activated. Under irradiation at a high dose rate, activity is seen in most atomic columns, corresponding to significant dynamic roughening of the observed corner of the nanoparticle. As the dose rate is decreased, the activity decreases and the sharp corner is reformed, although the outermost column (11) continues to exhibit significant column hopping.
In figure S4 the corner configuration is shown as a function of time and dose rate, first increasing and then decreasing the dose rate. Initially, one or two missing rows are most frequently observed. As the dose rate is increased, the presence of configurations with more missing columns increases. As the dose rate is decreased again, the corner heals and only shows a few missing columns. It is interesting to note that while the corner initially fluctuates between one and two missing rows, it ends up fluctuating between a perfect corner and one with a single missing row. Judging from this corner alone, it appears that the nanoparticle has been annealed into a lower overall energy configuration by the electron beam.
The experimental results reported above suggest that the sample surface response to high energy electron beam exposure can be quantitatively examined by analyzing the column hopping and by the atomic configuration evolution. Assuming that the nanoparticle has a constant cross-section, the number of electrons passing through the sample is proportional to the dose rate. van Dyck et al [35] estimated the energy transferred to the sample by a single electron to be in the range from a few meV to tens of eV, with an average around 40 meV, depending on the material and the imaging conditions. The highest energy transfers would, if the energy is transferred to one or a few atoms, lead to ejection of atoms from the sample. However, no evidence of such phenomena in terms of shrinking particles is observed in the present study.
More moderate energy transfer to the nanoparticle can occur through different processes including electron-hole pair creation and direct momentum transfer to the atoms. Regardless of the details of the mechanism, the energy ends as thermal vibrations, i.e. phonons. The heat mainly leaves the particle through thermal conductivity, and it must be assumed that higher beam intensities lead to higher temperatures of the nanoparticle [36].
In the present work, not only an increased diffusivity at increased beam intensities was observed (figure 11), but also an increased surface roughness at the corners of the nanoparticle (figure S5). This is consistent with an increase in diffusivity, whether from a locally elevated temperature or from non-thermal motion of the atoms under electron irradiation.
7. Conclusions
In our work, atomic surface dynamics are directly investigated by time-resolved HRTEM images, and four types of surface dynamics are revealed: layer jumping, layer gliding, twinning-detwing, and surface reconstruction. Our results demonstrate that reversible surface dynamics, in general, exist on supported Au nanoparticle surfaces, and all these dynamics govern a reversible feature with atoms observed to diffuse in a concerted manner at the given time resolution. Furthermore, the influences of the surrounding gaseous environment, e.g. CO, H2 and O2 as well as temperature on the kinetics of these dynamics are also quantitatively measured showing that Au (100) surfaces are most mobile in CO and H2 gas, in contrast to the high (111) surface mobility observed in O2 environment. The observations in the present work provide valuable experimental data for further studies of surface dynamics both experimentally and theoretically and extend the TEM ability to atom diffusion and surface dynamics characterization.
Electron beam effects on the surface dynamics are evaluated by observing atom column diffusion under a range of dose rates. Higher potential energy configurations present under higher dose rate conditions or after prolonged exposure to the electron beam under moderate dose rates indicate the excitation-relaxation process of the supported Au nanoparticles. The time scale of the excitation-relaxation process is on the order of seconds. For a given dose rate, the column hopping rate increases with increasing exposure time (total dose). Columns of higher coordination only hop under relatively high dose rate conditions. Dose rate, as well as the accumulated dose, influence surface dynamics of the supported Au nanoparticles.
To fully understand the dose-effect, more experiments need to be conducted at a lower temperature and lower acceleration voltage in combination with theoretical work on the energy transfer from the beam to nanoparticles. The results reported here provide a valuable experimental reference for beam-sample interaction and in situ morphology reconstruction and surface dynamics of nanoparticles under reactive and reaction conditions.
8. Methods
To prepare CeO2 supported gold nanoparticles, commercial CeO2 powder (Sigma–Aldrich) was dispersed in ethanol and drop-cast on a DENSsolutions through-hole chip with a SiNx membrane. The chip was then dried under a lamp for 10 min and inserted in a sputter coater (Quorum Q150 T). Au was deposited from a gold target using 80 mA current for 10 s in ionized Argon. After that, the chip was mounted in a DENSsolutions Wildfire holder and inserted into the TEM. The sample was heated to 500 °C in vacuum for 1 h resulting in a non-contaminated sample of Au nanoparticles, e.g. the model system.
The in situ experiments were performed in an FEI Titan 80–300 environmental transmission electron microscope (ETEM) equipped with a spherical aberration corrector (CEOS) on the objective lens. The microscope was operated at 300 kV. The CS corrector was tuned to a spherical aberration coefficient better than ∼5 µm. Images were recorded on a Gatan OneView camera at an exposure time of 0.2 s or 0.1 s. The gas pressure of O2, CO and H2 ranges from 4.5 to 130 Pa.