

Abstract
Previous studies have shown that climate warming is causing shrub cover to increase at high latitudes. Increased shrub cover generally lowers surface albedo, which results in higher energy absorption and further warming. In parts of Fennoscandia, herbivory is known to control vegetation height and abundance, and thus preventing this positive feedback. Here, we combine field measurements of albedo, herbivory and vegetation characteristics in four topographically-defined vegetation types of varying shrub height and abundance with land surface modeling (JULES) to investigate if reindeer grazing can influence the energy balance of an arctic tundra. We find that when reindeer reduces shrub height and abundance, summer albedo increases in both Betula nana-dominated heath vegetation and Salix glauca-dominated willow depressions. Model results reveal associated lower net radiation, and latent and sensible heat fluxes in heavily-grazed sites in all shrub-dominated vegetation types. Our results also suggest that the structural shift from graminoid to shrub tundra drives the difference in summer albedo, rather than shifts from dwarf-shrub to tall-shrub tundra. Reindeer has thus a potential cooling effect on climate by increasing summer albedo and decreasing net radiation, which highlights the importance of mammalian herbivores for the earth system beyond their local grazing impacts. However, the strong effects of reindeer on albedo are probably restricted to areas with high reindeer densities, since a dramatic vegetation change is essential. The importance of these processes across the whole range of reindeer densities found in the arctic tundra needs to be further evaluated.
Export citation and abstract BibTeX RIS

Original content from this work may be used under the terms of the Creative Commons Attribution 3.0 licence. Any further distribution of this work must maintain attribution to the author(s) and the title of the work, journal citation and DOI.
Introduction
Recent global warming has led to changes in the distribution and composition of Arctic vegetation during the last decades (Sturm et al 2001, Tape et al 2006, Elmendorf et al 2012). These widespread changes in turn play an important role in determining the magnitude and timing of further regional and global climate warming (Chapin et al 2005, Myers-Smith et al 2011) via altered albedo (Chapin et al 2005, Swann et al 2010, Pearson et al 2013), evapotranspiration (Swann et al 2010, Bonfils et al 2012), carbon dioxide emissions (Dorrepaal et al 2009, Cahoon et al 2012, Sweet et al 2015), and permafrost thawing (Eugster et al 2000, Blok et al 2010).
One important land-atmosphere feedback is mediated by changes in surface albedo during the snow season, that in turn influence the proportion of incoming shortwave radiation reflected by the surface (Chapin et al 2005, Pearson et al 2013). Shrub expansion into tundra ecosystems may reduce surface albedo by increasing exposure of dark branches (Sturm et al 2005, Ménard et al 2012). This results in a positive feedback where more shortwave radiation is absorbed by the canopy (Juszak et al 2014), producing an increase in sensible heat (Thompson et al 2004, Beringer et al 2005, Chapin et al 2005), which ultimately amplifies regional warming and facilitates further shrub growth (Thompson et al 2004, Loranty et al 2011, Pearson et al 2013). Because shrubs absorb approximately the same percentage of solar radiation as snow reflects (i.e. 80 to 90%), changes in albedo due to shrub expansion are most pronounced during the snow season and most research has focused on this period of the year (Sturm et al 2005, Pomeroy et al 2006, Loranty et al 2011, 2014, Ménard et al 2012, Bonfils et al 2012, Pearson et al 2013), but see Chapin et al (2005), Beringer et al (2005), Thompson et al (2004), and McFadden et al (1998).
The abundance of shrubs can also influence the summer albedo, but this has received far less attention. Even though the magnitude of effect is up to 6 times smaller than for springtime albedo changes, changes in summer albedo persist across the whole snow-free period (Williamson et al 2016), which could often be at least 6 times longer. Studies that have focused on summer albedo in northern systems generally show a negative relationship between albedo and shrub or tree cover, i.e. a decrease in albedo with an increase in shrub/tree cover (Eugster et al 2000, Blok et al 2011a, de Wit et al 2014); as well as a temporal increase in albedo over the course of the growing season, which has been attributed to either decreasing soil moisture levels or leaf expansion making the shrub canopy increasingly more reflective (Williamson et al 2016). Studies along tundra-forest transitions also show a decrease in albedo from tundra to forest (Thompson et al 2004, Beringer et al 2005). However, the effect is not that straightforward as Juszak et al (2014) show that albedo is not related to shrub biomass but instead mainly affected by leaf area and leaf-to-branch ratios. They suggest that albedo initially decreases with increasing leaf area index (LAI) and then levels off or even shows positive trends (Juszak et al 2014). Furthermore, although shrub cover in general decreases summer albedo in the Siberian tundra, the effect is likely to depend on the original vegetation types being replaced; e.g., when shrubs replace wetlands or barren tundra, summer albedo will likely increase instead as shrub tundra has higher albedo than wetlands and barren tundra (Blok et al 2011a). The effects of increasing shrub abundance on albedo will contribute to changes in the whole surface energy balance. Net radiation, the balance between total incoming and outgoing radiation, which, in essence, is the total amount of energy available to influence the (local) climate, is expected to increase with a decrease in albedo. This increased amount of energy is then available for increasing sensible (temperature), latent (evapotranspiration) and ground heat fluxes (Beringer et al 2005, Bonfils et al 2012). Since taller shrubs transpire more efficiently than shorter shrubs, the latent heat flux is expected to be larger for taller shrubs (Bonfils et al 2012).
An additional factor that has not often been taken into account in studies on land-atmosphere feedbacks is the role of biotic interactions. Herbivores play an important role in shaping tundra ecosystems (Olofsson et al 2004, 2013, Bernes et al 2015). Exclosure studies show that lemmings and reindeer reduce vegetation height and inhibit shrub increase by consuming and trampling woody plants (Post and Pedersen 2008, Olofsson et al 2009). Via their effect on vegetation and soils, herbivores can affect both carbon cycling (Cahoon et al 2012, Väisanen et al 2014, Ylänne et al 2015, Metcalfe and Olofsson 2015) and land-atmosphere energy exchanges (Cohen et al 2013, Shao et al 2016), although the strength of their effect on the vegetation varies in time (Olofsson et al 2012) and space (Bernes et al 2015). A remote-sensing study comparing winter and year-round reindeer grazing regimes along the Norwegian-Finnish border shows that grazing-induced vegetation changes resulted in differences in albedo dynamics (Cohen et al 2013). Finnish year-round pastures had shorter and sparser vegetation resulting in delayed snowmelt, increased surface albedo and decreased ground heating during the snowmelt season (May–June) compared to Norwegian pastures without grazing.
Although reindeer are known to have the potential to reduce the abundance of shrubs (Olofsson et al 2009), the effect on albedo is not given since they also transform other components of the ecosystem, such as lichen and moss cover (Olofsson et al 2009, Stoy et al 2012, Bernes et al 2015). Here we investigate if intense reindeer grazing influences the energy balance of an arctic tundra via altered albedo during the summer season, and directly link these changes in albedo to corresponding changes in the plant community composition. We combine field measurements of albedo and vegetation characteristics with land surface modeling (JULES, see Best et al 2011) to investigate the effect of reindeer grazing on the land surface energy budget. Field measurements were conducted in four topographically-defined vegetation types that varied in shrub height and abundance in Fennoscandia using a unique experimental set-up where a more than 50 years old fence separated areas experiencing either light (LG) or heavy grazing (HG) by reindeer. We hypothesize that heavy grazing by reindeer increases summer albedo via decreased shrub height, abundance and LAI and thereby affects the surface energy balance of an arctic tundra.
Methods
Study area
The study was performed in Reisadalen (Sámi: Raisduoddar) in Troms, Norway (69°30'N, 27°30'E, figure 1). The area experiences a sub-oceanic climate and lies between 500 and 700 m a.s.l, which is about 100 m above the tree line (Oksanen and Virtanen 1995). The mean annual temperature is −0.6 °C, mean July temperature is 10.0 °C and the mean annual precipitation is 935 mm (Norwegian Water Resources and Energy Directorate, www.senorge.no). The predominating vegetation is heath land of the Arctic Empetrum–Dicranum–Lichen type (Oksanen and Virtanen 1995). The area belongs to one of the floristically richest mountain areas in Fennoscandia (Olofsson and Oksanen 2005). We conducted our study along a reindeer fence that was built in the 1960's to help the Sámi people keep the reindeer within their legal summer ranges (figure 1). The fence is built of 1–1.5 m wooden poles to which wires are attached at several heights, and runs for several kilometers across the tundra. It dissects several—mainly topographically determined—vegetation types. Reindeer are mainly present at the site in the beginning of the autumn (second half of August), when the reindeer forage on leaves of deciduous shrubs, graminoids and forbs. There is no difference in timing of grazing between the two grazing intensities. For more details about how reindeer use the area, see Olofsson et al (2001, 2004) and Väisanen et al (2014). The contrast between both sides of the fence is especially strong in relatively nutrient-poor habitats (exposed ridges and tundra heath), where the lightly-grazed side is dominated by unpalatable dwarf shrubs, while palatable grasses and forbs prevail on the heavily-grazed summer range, enforcing a higher productivity, warmer soils, and faster nutrient turnover (Olofsson et al 2001, 2004, Väisanen et al 2014).

Figure 1. Long-term reindeer fence in Reisadalen established in the 1960s to assist Sámi herders to move reindeer from summer to winter pastures (photo credit: J Sitters). The inset shows a map of Reisadalen within Norway.
Download figure:
Standard image High-resolution imageSelection of study sites
To be able to study a wide array of vegetation height, density and composition, we selected four topographically-defined vegetation types (Giblin et al 1991, Oksanen and Virtanen 1995, Elvebakk 1999):
- Hillslope heath occurring on higher zonal sites (hereafter heath), consisting of heath vegetation (15–25 cm in height) of the Arctic Empetrum-Dicranum-Lichen type (Oksanen and Virtanen 1995). Dominant species are the (dwarf) shrubs Betula nana L., Empetrum hermaphroditum Lange ex Hagerup and Vaccinium vitis-idaea L., as well as the mosses Pleurozium sp. and Dicranum sp.
- Moist meadows (snowbeds) occurring on lower zonal sites (hereafter meadow), dominated by graminoids (Carex bigelowii Torr. ex Schwein., Agrostis mertensii Trin., Deschampsia flexuosa (L.) Trin., Festuca ovina L. and Poa alpina L.) and low forbs (Bistorta vivipara (L.) Delarbre, Ranunculus acris L. and Viola biflora L.), with low abundance of shrubs, notably B. nana and Salix herbacea L. Vegetation height rarely exceeds 10–15 cm.
- Dry heath occurring on exposed ridges (hereafter ridge), comprising of low stature vegetation (5–10 cm) dominated by evergreen herbs and dwarf shrubs. Most abundant in our plots were the species E. hermaphroditum and V. vitis-idaea, followed by B. nana L. and the moss Dicranum sp.
- Willow shrub in depressions (hereafter willow), dominated by the tall shrub Salix glauca L. with forbs (B. vivipara, Cornus suecica L., Equisetum sylvaticum L., V. biflora, Solidago virgaurea L.), graminoids (Carex nigra (L.) Reichard, D. flexuosa), and dwarf shrubs (Vaccinium myrtillus L., E. hermaphroditum, B. nana) in the understory. Vegetation height varied between 50 cm to 1 m.
We described these different vegetation types based on the lightly-grazed side of the fence. Vegetation on the heavily-grazed side is dominated by graminoids and forbs (e.g., B. vivipara, V. biflora), albeit with clear differences in graminoid communities at each topographic position (Olofsson et al 2001). Festuca ovina dominates in heaths and exposed ridges, whereas P. alpina, A. mertensii and Calamagrostis lapponica (Wahlenb.) Hartm. dominate in the wetter vegetation types. We randomly selected four replicates for the heath, meadow and ridge vegetation and six replicates for the willow communities in order to incorporate more plots with high (>40 cm) vegetation. We paired 1 × 1 m plots on both sides of the fence (36 plots in total) as topographically and edaphically uniform as we could. The distance between paired plots was approximately 10 m, so that differences in soil and vegetation within a set of paired plots could be assumed to result from reindeer grazing, not environmental variation. Sets of paired plots were spaced minimally 100 m apart along the fence to ensure independence among them, resulting in a total distance between first and last plots of approximately 2 km.
Albedo measurements
We measured albedo in the 36 plots during the growing season of 2013 (n = 6). Measuring dates were 10 June (DOY 161), 27 June (DOY 178), 14 July (DOY 195), 27 July (DOY 208), 19 August (DOY 229) and 13 September (DOY 256). Albedo is a measure of the reflectivity of a surface and was measured manually using a CMA11 shortwave albedometer (Kipp and Zonen B.V., Delft, The Netherlands) attached to a Spectrosense 2 datalogger (Skye Instruments Ltd.). The albedometer consists of an upward and downward looking pyranometer (285–2800 nm spectral range) in a single housing. The upper sensor measures incoming shortwave radiation and the lower sensor measures shortwave radiation reflected from the surface below. The signal output is in W m−2 (irradiance), which allows for a simple calculation of albedo as upper sensor divided by lower sensor. Measurements were taken at approximately 150 cm height and 150 cm distance from the observer.
Reindeer activity
We estimated reindeer activity in 4 plots of each vegetation type and grazing treatment (32 plots in total) by collection of reindeer dung and the use of trampling indicators. In the vicinity (ca. 1–2 m away) of each plot an additional plot of 1 × 2 m was selected which we cleared of all reindeer dung mid-June 2013. We subsequently collected reindeer dung in each plot early August and mid-September. Dung was dried (60 °C, 48 h) and then weighed to calculate reindeer dung inputs for each vegetation type and grazing treatment. In addition, 25 long nails were inserted into the soil in a 25 × 25 cm square in the corner of each dung plot. They slightly protruded from the soil or vegetation surface to register trampling activity. When the nails were trampled on, they were firmly pushed down into the soil. We placed these trampling indicators in mid-June 2013 and the number of nails trampled on was recorded early August, after which they were re-placed, and trampling was recorded again mid-September.
Vegetation measurements
We estimated plant abundance and species composition in all 36 plots at the peak of the growing season (31 July/1 August 2013) with a modified point intercept method. This index correlates well with plant biomass for a single species (Jonasson 1988). For each 1 × 1 m plot we used ten frames of ten pins resulting in a total of 100 pins per plot. The pins were lowered through the vegetation whereby we recorded the number of hits per plant species. From the species composition data we calculated total hits per plot (N hits/100 pins) per plant functional group: graminoids, forbs, deciduous shrubs, evergreen shrubs, lichens and mosses. Additionally, we measured the height of the shrub canopy, leaf area index (LAI) and normalized difference vegetation index (NDVI) during the whole growing season on the same dates as the albedo measurements (n = 6). We used a folding ruler to measure the maximum height of the shrub canopy in each plot. We measured LAI using an AccuPAR LP-80 PAR ceptometer (Decagon Devices, Inc.) that allows for rapid and non-destructive sampling. It measures photosynthetically active radiation (PAR) in plant canopies and calculates LAI based on above- and below-canopy measurements. We measured NDVI, which is a standardized index used as an indicator of relative biomass and greenness (Chen and Brutsaert 1998), using a pair of downward and upward facing 4-channel light sensors (SKR 1850/SS2) attached to a Spectrosense 2 datalogger mounted on a handheld pole (Skye Instruments Ltd.). Wavelengths were specified as 450–480 nm (Channel 1), 540–565 nm (Channel 2), 625–680 nm (Channel 3) and 835–890 nm (Channel 4). The upward facing sensor was fitted with a cosine correction diffuser for incident light measurements. The downward facing sensor had a narrow light acceptance angle suitable for measuring reflected light. To calculate the NDVI we only used channels 3 and 4 that correspond with bands 1 and 2 of MODIS and that measure red and near infrared (NIR) light respectively. We calculated NDVI as (NIR − RED)/(NIR + RED).
Soil moisture and temperature measurements
We measured soil moisture throughout the growing season on the same dates as the albedo measurements (n = 6) in all plots using a ML3 - ThetaProbe soil moisture sensor connected to a HH2 moisture meter. We used the average of four replicate readings per plot. The ThetaProbe sensor measures volumetric soil moisture content in the topsoil (Delta-T devices Ltd.). We continuously measured soil temperature throughout the growing season using Thermochron iButtons loggers (model DS1921G, Maxim Integrated). For soil temperature measurements, we wrapped single iButtons in parafilm to prevent moisture damage and buried one iButton per 1 × 1 m plot at 5 cm depth. We programmed the iButtons to take a temperature reading every hour. The accuracy of the loggers is 0.5 °C.
Model description
The energy budget at each plot was calculated using the JULES land surface model version 4.2. JULES requires meteorological data as input (shortwave and longwave radiation, precipitation, relative humidity, air temperature, wind speed) to calculate energy, water, carbon and momentum exchanges at the Earth's surface. In this study, JULES was used in its stand-alone mode (i.e. not as part of an Earth System Model) and its single point mode (i.e. the model was run thirty-six different times to represent thirty-six plots rather than once with all the plots being represented in a distributed setting). The data and configurations specific to this study are described below, but we refer to Best et al (2011) and Clark et al (2011) for a full description of the model.
The surface energy balance in JULES is defined as:
where the term on the left side of the equation is the change in surface temperature T* over time t considering the heat capacity Cs of the surface, Sw is the net shortwave radiation, Lw is the net longwave radiation, H is the sensible heat flux, LE is the latent heat flux and G is the ground heat flux. Sw is defined as (1-α)SW↓ where α is albedo and SW↓ is the incoming shortwave radiation.
The surface temperature is defined as the skin temperature of a minuscule layer; when vegetation is present this layer is at top of the canopy. The vegetation is coupled to the soil using both radiative exchanges and within canopy turbulent (H and LE) exchanges. Descriptions of the energy balance equations, within-canopy process and soil thermodynamics can be found in Best et al (2011) and Essery et al (2001, 2003).
Meteorological data are assumed identical at all sites because they are all located within a single gridbox of the reanalysis dataset used to provide the meteorological conditions, the National Centers for Environmental Prediction Climate Forecast System Version 2 (Saha et al 2014) (NCEP hereafter). It was not deemed necessary to downscale and distribute the data given a) the proximity of the plots to each other, and b) the similar aspect between plots. Measured albedo, vegetation height and LAI were prescribed to JULES to describe each plot. These data were measured manually and at different time intervals (2–3 weeks, see supplementary data, table S1 stacks.iop.org/ERL/11/125013/mmedia) in the field, but their values were updated fortnightly in the model for consistency between sites. The field measurements of soil moisture and temperature, described above, were used to provide the initial modelled soil conditions at each site. These automatic soil temperature measurements were used for model evaluation. The model was run from 1 June to 21 September 2013 and evaluated against measurements starting on 12 June 2013 such that the first eleven days of the run were used to spin-up the model; statistical analysis were performed on model results from 12 June to 21 September. Surface temperatures were initialised as equal to soil temperatures; by the end of the spin-up period the soil and surface temperatures were successfully decoupled such that differences of up to 10° between the two were seen at most sites.
Statistical analysis
We analyzed the effects of vegetation type and grazing regime on albedo, shrub height, NDVI, LAI, and soil moisture across the season using a linear mixed-effects model, whereby we used vegetation type, grazing and time-period as fixed effects and the paired plot number as random factor to account for the spatial autocorrelation of the paired study design. Due to inaccessibility of 14 plots (one LG-HG pair each in ridge, heath and willow, plus all meadows plots) caused by heavy rainfall preceding our measurements of 14 July, all measurements from that date were excluded prior to statistical analyses. The soil moisture data was log-transformed to meet assumptions of normality and homogeneity of variance.
We tested for the effect of vegetation type and grazing regime on soil temperature, reindeer trampling, reindeer dung and plant functional group abundance using linear mixed-effect models with vegetation type and grazing regime as fixed effects and paired plot number as random effect. We excluded the effect of time by averaging measurements per plot across the growing season for reindeer trampling, reindeer dung and soil temperature. Dung and trampling data were log-transformed to meet with the assumption of normality and homogeneity of variance. We used total hits per plot (N hits / 100 pins) for each plant functional type (graminoids, forbs, deciduous shrubs, evergreen shrubs, lichens and mosses) as response variables in the linear mixed-effect model. All pinpoint data were log-transformed before analysis. We tested for linear and asymptotic relationships between albedo, LAI and shrub abundance, and the best models were selected based on their r2 values.
Model performance of the JULES land surface model was evaluated using performance metrics which summarise different aspects of model performance: bias evaluates the accuracy, the correlation coefficient (R) evaluates the agreement in temporal patterns, and the root mean square error (RMSE) evaluates the amplitude in the variation from the observations. The model calculated net radiation, latent (LE), sensible (H) and ground (G) heat flux for each plot. We tested for differences between plots using the same linear mixed-effect model as described above with vegetation type and grazing regime as fixed effects and paired plot number as random effect. For comparisons between vegetation types we used Tukey-Kramer HSD tests. We used the package 'nlme' within the statistical environment R version 3.0.1 (R Development Core Team 2013) for our data analyses.
Results
Summer albedo
Albedo values varied between 0.13 and 0.21 throughout the growing season and showed significant differences across vegetation type and grazing treatment (table 1, figure 2(a), 3). Average summer albedo was highest in the meadow vegetation, intermediate in heaths and exposed ridges and lowest in the willow depressions (see Supplementary data, table S1, for all data). Heavily-grazed (HG) plots had on average higher summer albedo than lightly-grazed (LG) plots, but only for the taller shrubby vegetation types (heath and willow). In the ridge, with extremely low shrubs, the effect was in the same direction but not statistically significant (p = 0.22, figure 2(a), 3). The effect of grazing differed among vegetation types (significant vegetation type × grazing interaction, see table 1), since there were no differences in summer albedo between HG and LG plots in the wet meadows. Albedo was measured six times over the growing season and was highest during peak growing season in late July (DOY 208). There were no significant interactions between time and vegetation type or grazing, indicating that the observed patterns in summer albedo for vegetation type and grazing treatment were consistent in time.
Table 1. Results of linear mixed-effects model testing the effects of vegetation type and grazing on summer albedo, shrub height, NDVI, LAI, and soil moisture. Statistically significant effects (p < 0.05) are marked in bold.
| Albedo | Shrub height | NDVI | LAI | Soil moisture | |||||||
|---|---|---|---|---|---|---|---|---|---|---|---|
| df | F | p | F | p | F | p | F | p | F | p | |
| Error: Plot | |||||||||||
| Vegetation type | 3 | 8.0 | <0.001 | 22.3 | <0.001 | 5.4 | 0.005 | 14.7 | <0.001 | 5.1 | 0.006 |
| Grazing | 1 | 7.6 | 0.010 | 54.9 | <0.001 | 10.2 | 0.004 | 30.3 | <0.001 | 4.7 | 0.04 |
| Vegetation type*Grazing | 3 | 4.1 | 0.015 | 15.9 | <0.001 | 2.0 | 0.13 | 8.8 | <0.001 | 0.1 | 0.95 |
| Residuals | 28 | ||||||||||
| Error: Within | |||||||||||
| Time | 4 | 22.7 | <0.001 | 3.4 | 0.011 | 43.7 | <0.001 | 46.6 | <0.001 | 26.3 | <0.001 |
| Vegetation type*Time | 12 | 0.9 | 0.51 | 0.9 | 0.53 | 4.4 | <0.001 | 5.0 | <0.001 | 1.9 | 0.04 |
| Grazing*Time | 4 | 1.6 | 0.18 | 3.5 | 0.010 | 2.0 | 0.11 | 3.4 | 0.012 | 1.7 | 0.15 |
| Vegetation type* Grazing*Time | 12 | 0.7 | 0.71 | 0.5 | 0.90 | 0.8 | 0.63 | 2.5 | 0.006 | 0.7 | 0.72 |
| Residuals | 112 | ||||||||||
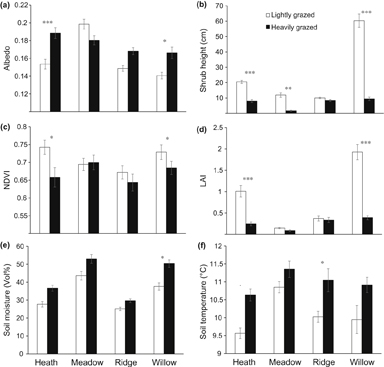
Figure 2. Barcharts showing (a) albedo, (b) shrub height, (c) normalized difference vegetation index (NDVI), (d) leaf area index (LAI), (e) soil moisture, and (f) soil temperature at 5 cm depth, for LG (lightly grazed, light bars) and HG (heavily grazed, dark bars) for each vegetation type: heath, meadow, ridge and willow. Data is averaged over the season. Error bars show +/−SE. Asterisks denote significant differences (. < 0.1, * < 0.05, ** < 0.01, *** < 0.001) between LG and HG plots after Tukey HSD tests.
Download figure:
Standard image High-resolution image
Figure 3. Average difference in summer albedo between HG (heavily grazed) and LG (lightly grazed) plots (Albedo diff = Albedo HG – Albedo LG) for each vegetation type: heath, meadow, ridge and willow. Dotted lines represent +/−SE. Albedo in the HG plots is higher for all vegetation types except for meadow communities.
Download figure:
Standard image High-resolution imageAlbedo decreases with increasing LAI, shrub height and shrub abundance (figure 4). An asymptotic model had a statistically significant better fit than a linear one for LAI (p = 0.003) and shrub height (p = 0.046), indicating that albedo decreases with increasing LAI and shrub height up to LAI values of about 1 or a height of 20 cm, but thereafter reaches an asymptote and no longer decreases with an increasing LAI or shrub height. An asymptotic model was only close to significantly better than a linear one for the relation between albedo and shrub abundance (p = 0.065). We still plotted the asymptotic relationship in figure 4(b), since the relationship looks very similar to the relationship with shrub height and LAI, and the residuals of the linear model were clearly asymmetric.

Figure 4. Graphs showing summer albedo plotted against (a) leaf area index (LAI), (b) shrub abundance and (c) shrub height; and LAI plotted against (d) shrub abundance and (e) shrub height. Dotted lines indicate non-linear (a), (b), (c), and linear (d), (e) regression lines with corresponding coefficient of determination (R2) values. Data is averaged across the season for each of the 36 plots. Open symbols indicate lightly grazed (LG) plots, closed symbols indicate heavily grazed (HG) plots in heath (circles, n = 4), meadow (triangles, n = 4), ridge (squares, n = 4) and willow vegetation (diamonds, n = 6).
Download figure:
Standard image High-resolution imageReindeer activity
Reindeer activity was lower in the LG plots, both in terms of trampling (F1,12 = 118, p < 0.001, supplementary data, figure S1 stacks.iop.org/ERL/125013/125013/mmedia) as well as dung deposition (F1,12 = 120, p < 0.001, Supplementary data, figure S1). Dung deposition and trampling were highly correlated (r2 = 0.77, p < 0.001) indicating that reindeer activity consisted of both defecating and trampling in the same area. We did not detect differences in reindeer activity among vegetation types (trampling: F3,24 = 0.5, p = 0.7, dung: F3,24 = 0.5, p = 0.6).
Vegetation response to grazing
In the heath, ridge and willow communities both the vegetation structure and composition differed between the grazing regimes. The shrub-dominated vegetation in LG sites has been replaced by graminoid-dominated vegetation in HG sites (table 2, figure 5). In contrast, the meadow communities differed in composition only, since both grazing regimes were dominated by deciduous graminoids and forbs, but in different proportions and species composition (data not shown). Lichens and mosses showed a strong decline from LG to HG plots for nearly all communities.
Table 2. Results of linear mixed-effects model testing the effects of vegetation type and grazing on total hits of graminoids, forbs, deciduous shrubs, evergreen shrubs, mosses and lichens. Statistically significant effects (p < 0.05) are marked in bold.
| Graminoids | Forbs | Deciduous shrubs | Evergreen shrubs | Mosses | Lichens | ||||||||
|---|---|---|---|---|---|---|---|---|---|---|---|---|---|
| df | F | p | F | p | F | p | F | p | F | p | F | p | |
| Error: Pair | |||||||||||||
| Vegetation type | 3 | 3.2 | 0.056 | 5.6 | 0.01 | 7.6 | 0.003 | 14.1 | <0.001 | 1.5 | 0.26 | 4.6 | 0.02 |
| Residuals | 14 | ||||||||||||
| Error: Within | |||||||||||||
| Grazing | 1 | 75.7 | <0.001 | 6.9 | 0.02 | 91.8 | <0.001 | 35.2 | <0.001 | 4.8 | 0.05 | 39.8 | <0.001 |
| Vegetation type*Grazing | 3 | 7.8 | 0.003 | 1.7 | 0.21 | 5.9 | 0.008 | 2.3 | 0.12 | 1.6 | 0.23 | 4.7 | 0.02 |
| Residuals | 14 | ||||||||||||

Figure 5. Average abundances of plant functional groups based on point-intercept data (Hits/100 pins) for each of the four vegetation types: heath, meadow, ridge and willow vegetation. Species have been categorized according to six functional groups: lichens, mosses, forbs, evergreen shrubs, deciduous shrubs and graminoids. Error bars show +/−SE. Asterisks denote significant differences (. < 0.1, * < 0.05, ** < 0.01, *** < 0.001) between lightly grazed (light bars) and heavily grazed (dark bars) plots after Tukey HSD tests.
Download figure:
Standard image High-resolution imageShrub height differed among vegetation types and was lower in the heavily grazed sites (table 1, figure 2(b)). The largest difference between both grazing treatments was recorded in the willow shrubs (67 cm vs 7 cm). In meadow communities shrub height was lower in the HG plots too (figure 2(b)), but shrub abundance was low independent of the grazing regime (figure 5). Shrub height increased over the season in LG plots, but decreased in HG plots (significant grazing × time interaction, see table 1).
Both vegetation type and grazing treatment significantly affected NDVI (table 1, figure 2(c)). Total green vegetation was highest in the LG shrub canopies and lowest in the HG ridge vegetation (table 1). Meadow communities were intermediate in NDVI with little difference between LG and HG plots. NDVI peaked during the measurements in late June (DOY 178) and decreased over the season. An exception was the meadow vegetation that peaked in early June (DOY 161) and showed a gentle decline over the season.
LAI was highest in the shrub canopies and lower in the ridge and meadow communities (table 1, figure 2(d)). There was a high correlation between LAI and shrub abundance (r2 = 0.68, p < 0.001, figure 4(b)) and between LAI and shrub height (r2 = 0.87, p < 0.001, data not shown). Heavy grazing by reindeer significantly reduced LAI. This effect was particularly strong for heath and willow communities, but less so for ridge and meadow communities. LAI differed over the season and was highest during peak growing season (DOY 208) when most leaf biomass is present. LAI showed more variation over the season in the plots with highest LAI values, i.e. in the heath and willow communities, and in the LG plots, specifically, in the LG heath and willow communities (significant vegetation type × grazing × time interaction, see table 1).
Soil moisture and temperature
Volumetric soil moisture content was higher in the HG (43%) than in the LG sites (34%) (table 1, figure 2(e)). Vegetation type also affected soil moisture, with meadows (48%) and willows (44%) being wetter than heaths (32%) and ridges (27%). Soil moisture fluctuated strongly across the season and fluctuations were stronger in the meadows than in other vegetation types (significant time × vegetation type interactions, see table 1).
Soil temperatures (T) across the season were on average 0.9 °C higher in the HG plots than in the LG plots (F1,14 = 62.1, p < 0.001, figure 2(f)). Soil temperatures in the meadow communities were higher (11.1°C) than in heath (10.1°C), willow (10.4°C), and ridge communities (10.5°C; F3,14 = 2.6, p = 0.09).
Model performance and energy budget
The summary statistics show that the JULES land-surface model performs well against measured soil temperature and that the performance is consistent among vegetation types (table 3). All sites have a high correlation coefficient (0.70 < R < 0.79), showing that the model is able to reproduce the diurnal cycle of soil temperature which, at such shallow depth, closely follows air temperature; high R in this instance is therefore a reflection of how well the reanalysis data capture the diurnal cycle at the sites. Bias for all HG plots is negative whereas the opposite is true at three of the four LG plots, but the scale of the bias is small: five of the eight vegetation types have a bias smaller than the temperature accuracy (i.e. 0.5 °C) of the instrument against which the model is measured. The difference between the smallest (2.03 °C) and highest (2.51 °C) RMSE is also smaller than the temperature accuracy of the instrument, corroborating that model performance is consistent for all plots.
Table 3. Average of summary statistics (n = 4 at all vegetation types but 'willow shrub' where n = 6) of model performance against measured soil temperatures. Bias and root mean square error (RMSE) are in degree centigrade and evaluates the accuracy and the amplitude in the variation from the observations, respectively, the correlation coefficient (R) is dimensionless and evaluates the agreement in temporal patterns.
| Heavily grazed | Heath | Meadow | Ridge | Willow |
|---|---|---|---|---|
| Bias | −0.35 | −0.34 | −0.27 | −0.64 |
| R | 0.71 | 0.74 | 0.76 | 0.79 |
| RMSE | 2.46 | 2.41 | 2.37 | 2.28 |
| Lightly grazed | Heath | Meadow | Ridge | Willow |
| Bias | 0.84 | −0.01 | 0.70 | 0.26 |
| R | 0.70 | 0.70 | 0.77 | 0.77 |
| RMSE | 2.48 | 2.51 | 2.44 | 2.03 |
The model predicts a consistently lower net radiation (F1,14 = 52.6, p < 0.001), latent heat flux (F1,14 = 124, p < 0.001), sensible heat flux (F1,14 = 9.3, p = 0.009) and ground heat flux (F1,14 = 7.9, p = 0.01) for the HG plots (figure 6). However, note that the ground flux is negative, indicating a heat flux from the soil surface to the atmosphere. The actual strength of the heat flux (the absolute value) is higher in HG plots. Net radiation was lower in heavily-grazed heath, ridge and willow vegetation (LG minus HG = 6.3, 4.4 and 5.0 Wm−2, respectively), but not in meadows (vegetation type × grazing interaction: F3,14 = 8.8, p = 0.002). The same patterns was found for the latent heat flux (vegetation type × grazing interaction: F3,14 = 17.7, p< 0.001). The lower sensible heat flux in HG plots was most pronounced in heath and ridge vegetation (vegetation type × grazing interaction: F3,14 = 9.5, p = 0.001) and the lower negative ground heat flux was strongest for willow vegetation (vegetation type × grazing interaction: F3,14 = 3.8, p = 0.04, figure 6). The meadows did not show any differences between LG and HG sites.

Figure 6. Modelled net radiation, sensible heat flux (H), latent heat flux (LE) and ground heat flux (G) in W m−2 for each vegetation type; heath, meadow, ridge and willow (n = 4 at all vegetation types but 'willow shrub' where n = 6). Note that values for G are negative. Open boxes represent lightly grazed (LG) plots, grey boxes represent heavily grazed (HG) plots. Asterisks denote significant differences (* < 0.05, ** < 0.01, *** < 0.001) between LG and HG plots after Tukey HSD tests.
Download figure:
Standard image High-resolution image
Discussion
High densities of reindeer changed arctic tundra vegetation by decreasing shrub abundance, resulting in corresponding shifts in LAI, canopy height and NDVI. As hypothesized, these pronounced changes in vegetation resulted in a substantial increase in albedo across the growing season. According to our model results, this substantial increase in albedo would result in a corresponding decrease in net radiation and latent and sensible heat fluxes, indicating that heavily grazed sites absorbed less radiation. In this study we therefore show that reindeer have a potential cooling effect on climate by changing the summer albedo.
The estimated differences might appear small, but are large enough to have consequences for the regional energy balance (see Cohen et al 2013, Chapin et al 2005, Stoy et al 2012, Naudts et al 2016). For example, the differences in net radiation (latent plus sensible heat fluxes) between HG and LG plots (see results section), are equal to or higher, per unit of area, than the global atmospheric heating of 4.4 Wm−2 associated with a doubling of atmospheric CO2 (Chapin et al 2005). In line with previous research, where the largest effects on albedo in tundra systems were detected from high willow shrubs (Williamson et al 2016). However, the most important finding from our study might be that fairly small differences in shrub abundance, corresponding to changes that might occur from a decade of warming (Kaarlejärvi et al 2012, 2015) or grazing exclusion (Olofsson et al 2009, Kaarlejärvi et al 2015), also resulted in detectable differences in albedo, as well as net radiation and heat fluxes. This corroborates previous studies that showed that a warming climate in the arctic can be enhanced by a positive feedback of shrub expansion on the albedo (Cohen et al 2013, Chapin et al 2005, Pearson et al 2013, Ménard et al 2014), but also pinpoints to the potential of herbivores to mitigate this effect.
The negative relationship between summer albedo and shrub abundance that we found in our study is similar to other studies (Eugster et al 2000, Thompson et al 2004, Beringer et al 2005, Blok et al 2011a, de Wit et al 2014, Loranty et al 2014). However, whereas other studies found a linear decrease in albedo with increasing LAI (Thompson et al 2004, Beringer et al 2005, Blok et al 2011a), we found that the negative relationship is strong for low values of LAI, i.e. the transition of no shrubs to shrubs, but levels off for higher values of LAI, which is in line with predictions made by Juszak et al (2014). We found the same asymptotic relationship for shrub height, where the negative relationship levels off for shrubs higher than 20 cm. These patterns are mostly driven by the transition from bright graminoid vegetation to darker shrubs, with higher LAI, height and canopy complexity, rather than by changes in shrub abundance or height per se.
In the light of climate warming and associated vegetation changes, our results suggest that for summer albedo the structural shift from graminoid to shrub tundra is more important than shifts from dwarf-shrub to tall-shrub tundra. This is in line with Blok et al (2011a) who showed that the effect of increasing shrub cover on summer albedo depended on the original vegetation types being replaced. However, the dwarf-shrub to tall-shrub transition is without doubt important for spring-time albedo, due to its effect on the timing of snow melt (Sturm et al 2005, Pomeroy et al 2006, Ménard et al 2014). Nevertheless, scenarios predicting the consequences of Arctic greening on land-atmosphere energy exchanges should distinguish between both types of transitions to picture the complete story (see for example Pearson et al 2013). Not differentiating these two types of vegetation transitions (graminoid- shrub versus dwarf-tall shrub) could explain why several studies found effects of increasing shrub cover on spring-time albedo, but not on summer albedo (Loranty et al 2011, 2014, Cohen et al 2013).
Large-scale modelling studies show that if large expanses of arctic tundra are converted to shrubland, the regional surface energy budget will change (Loranty et al 2011, 2014) and that the expected Arctic greening (shrubification) will result in an overall positive feedback to climate warming (Pearson et al 2013). Net radiation, driven solely by changes in albedo, was predicted to increase substantially during both snowmelt and growing season (Pearson et al 2013). However, an important factor that complicates upscaling such model results is the high spatial heterogeneity in the landscape pertaining to vegetation, topography, soil moisture availability and snow distribution (Juszak et al 2014, Ménard et al 2014). Therefore, there is an urgent need for empirical studies with local measurements to gain insight in smaller-scale dynamics. Indeed, a recent paper providing field measurements of albedo using similar methods to our study shows consistent differences in summer albedo between dominant shrub species; sites with Betula glandulosa had higher albedo than sites with Salix pulchra (Williamson et al 2016).
We found that soil temperatures are consistently higher in heavily-grazed sites. This corresponds well with previous findings in other arctic ecosystems (Zimov et al 1995, Van der Wal et al 2004, Olofsson et al 2004, Väisanen et al 2014) where the increase in soil temperatures is attributed to reductions in the thickness of the moss or litter layers, which efficiently isolates the soil from the air (Gornall et al 2007, Blok et al 2011b), and to reductions in the shrub cover, which otherwise provides shading to the underlying soil (Blok et al 2010). Although this result may seem to contradict the results shown in figure 6, latent and sensible heat fluxes describe energy exchanges at the surface i.e. between the canopy and the air above it (conventionally 2 m above the surface). Therefore, while higher albedo and lower net radiation in the HG sites signifies that the surface interacting with the atmosphere is cooler, it does not necessarily mean that the layer below the surface—here, the soil layer—is also cooler. This is confirmed by the ground heat flux data. A negative ground heat flux means that the soil layer is warmer than the air above it. The largest ground heat fluxes (in our case, the most negative) are found in HG sites, which corresponds to higher soil temperatures. Moreover, the model does take the soil temperature into consideration when calculating the energy budget and soil temperatures are directly used to calculate the ground heat flux. Nevertheless, the higher soil temperatures in the HG sites will have consequences for microbial activity and depth of active layer, which ties in with the carbon cycle. Indeed a study performed in the same area shows that HG sites are weaker C sinks than LG sites (Väisänen et al 2014). Therefore, although grazing might be beneficial in terms of decreasing the net radiation, it might not be in term of releasing carbon into the atmosphere. We also found the soil moisture to be higher in the heavily grazed sites. This is in agreement with previous findings that woody vegetation has higher rates of evapotranspiration that reduces soil moisture beneath their canopies compared to open sites (Bonfils et al 2012) and corresponds to the higher latent heat flux we found for willows in LG sites.
In recent years there has been an increasing effort to include herbivores in our understanding of local, regional and global studies of land-atmosphere feedbacks (Schmitz et al 2014). In the arctic, this has been manifested through a number of studies demonstrating that reindeer can have substantial effects on carbon fluxes in arctic ecosystems (Cahoon et al 2012, Väisänen et al 2014, Metcalfe and Olofsson 2015). However, despite a couple of pioneering remote sensing studies (Stoy et al 2012, de Wit et al 2014, Cohen et al 2013) the link between the specific vegetation changes caused by grazing and albedo has not been studied before in arctic tundra (but see Shao et al 2016). Our results indicate that the effect of reindeer on albedo and energy balances potentially can be large enough to be of regional importance and that herbivore management could be a potential tool to mitigate future warming. This is important since most of the arctic tundra is grazed by domesticated or wild reindeer (Bernes et al 2015). However, the strength of this effect will depend on the strength of the effect of reindeer on vegetation, and most parts of the arctic tundra will experience much lower reindeer densities and smaller effects on the vegetation than at the study sites used here (Bernes et al 2015). Nevertheless, future model developments and studies should account for reindeer-induced changes to the land surface, e.g. reduction in shrub and moss cover, if they are to represent accurately the local energy budget and air temperatures. Although the short term effects of excluding reindeer are sometimes minor, rapid expansion of low shrubs after excluding herbivores are common in the arctic (Olofsson et al 2009, Post and Pedersen 2008, Zamin and Grogan 2013), and there is evidence for reindeer inducing vegetation shifts even at regional scales (Stoy et al 2012, Cohen et al 2013, Newton et al 2014). The present effect of reindeer on the albedo of arctic tundra might thus be considerable, and there is a great need to include future scenarios for arctic herbivores in future scenarios of land-atmosphere feedbacks in terms of changes in albedo and energy balances. We are aware of potential contrasting effects of reindeer on vegetation types not included in this study. One example of this could be that the negative effect of reindeer on light-colored lichens (Bernes et al 2015) could result in decreased surface albedo (Stoy et al 2012, Cohen et al 2013). Further studies, including more vegetation types and a larger variation in grazing pressures will further improve our understanding of how reindeer influences surface albedo.
Acknowledgments
We thank Jonas Gustafsson and Maria Noro-Larsson for their assistance in the field. This study was part of the Nordic Centre of Excellence TUNDRA project, funded by the Norden Top-Level Research Initiative 'Effect studies and adaptation to climate change', as well as financed by Kempestiftelserna, Formas 2012-1039, 2012-230 and 2015-109, and the Gunnar och Ruth Björkman fund.