

Abstract
The 2012 drought in Northeast Brazil was the harshest in decades, with potentially significant impacts on the vegetation of the unique semi-arid caatinga biome and on local livelihoods. Here, we use a coupled climate–vegetation model (CCM3-IBIS) to: (1) investigate the role of the Pacific and Atlantic oceans in the 2012 drought, and; (2) evaluate the response of the caatinga vegetation to the 2012 climate extreme. Our results indicate that anomalous sea surface temperatures (SSTs) in the Atlantic Ocean were the primary factor forcing the 2012 drought, with Pacific Ocean SST having a larger role in sustaining typical climatic conditions in the region. The drought strongly influenced net primary production in the caatinga, causing a reduction in annual net ecosystem exchange indicating a reduction in amount of CO2 released to the atmosphere.
Export citation and abstract BibTeX RIS

Content from this work may be used under the terms of the Creative Commons Attribution 3.0 licence. Any further distribution of this work must maintain attribution to the author(s) and the title of the work, journal citation and DOI.
1. Introduction
Drought events can strongly affect population dynamics and biodiversity (e.g. Reichstein et al 2013), even in arid areas where the fauna and flora are adapted to low precipitation regimes. One such area, the semi-arid region of Northeast Brazil (NEB), has been observed to undergo periodic droughts of varying intensity and duration (Mares et al 1985). Until recently, the 1877 drought was considered the most devastating. This drought lasted 3 yr and affected all of Brazil's Northeastern states. It is estimated that 500 000 people died during this drought, equivalent to half of the population of the semi-arid region at that time. At the present time, NEB is the most populated semi-arid region on Earth.
NEB is dominated by two biomes with distinct characteristics: the Atlantic forest and the caatinga. The Atlantic forest is primarily confined to the continental margins, while the caatinga extends inland. The Atlantic forest contains various vegetation types including coastal/dune forests, tropical moist forest, and montane moist forest. The caatinga, in contrast, is characterized by xeric shrubland and sparse forests of deciduous thorny trees. Despite its harsh climate, the caatinga contains a great variety of landscapes, a high number of endemic species (Moura et al 2013) and relatively high biodiversity (Pennington et al 2004). Moreover, to date there have been very few studies that focus on the link between the climate and the ecosystem resilience of the caatinga.
The 2012 drought appears to have been mainly caused by anomalous patterns of sea surface temperature (SST) in the Pacific and Atlantic Oceans (Marengo et al 2013). Specifically, lower SST concentrated in the central Pacific may have been sufficient to significantly alter precipitation regimes in the NEB in 2012 (Rodrigues and McPhaden 2014). It is well known that climate in NEB is strongly dependent on SST in the Pacific and Atlantic (Nobre and Shukla 1996, Kayano and Capistrano 2013) with several studies indicating that droughts in this region are associated with El Nino events and a warmer (cooler) than normal North (South) tropical Atlantic Ocean (Covey and Hastenrath 1978, Moura and Shukla 1981, Chiang et al 2002).
SST patterns control the latitudinal position of the inter-tropical convergence zone (ITCZ) and thus influence NEB rainfall between the 10S–2S latitudinal belt (Hastenrath 2006). The negative (positive) SST anomalies in the equatorial Atlantic reinforce the El Niño (La Niña) in the tropical Pacific through an anomalous Atlantic Walker circulation. As a consequence, the ENSO-related precipitation anomalies over South America are more intense and homogeneous when the coupling between the tropical Atlantic and Pacific Oceans is stronger (Kayano and Capistrano 2013).
Events such as the 2012 drought have the potential to affect the integrity of the natural vegetation of the caatinga and to significantly reduce the productivity/viability of agriculture. Previous studies indicate that an extended seasonal cycle with longer dry spells can increase soil moisture stress and decrease primary productivity in arid areas (Thomey et al 2011, Rohr et al 2013). The majority of people living in the caatinga rely on subsistence agriculture, and extreme climatic events are therefore very likely to cause widespread food insecurity.
Here, we investigate the role of distinct forcing in the extreme 2012 drought in NEB. Specifically, we use coupled climate–vegetation models to: (1) evaluate the role of the Pacific and Atlantic oceans in the 2012 drought, and; (2) quantify the response of the caatinga vegetation.
2. Model description and experiment design
Modeling experiments were performed using the National Center for Atmospheric Research Community Climate Model Version 3 (CCM3, Kiehl et al 1998), with spatial resolution T42 (2.81° × 2.81°), 18 vertical levels in the atmosphere, and a hybrid sigma-pressure coordinate system. A time step interval of 15 min was applied. CCM3 was coupled with an updated version of the land surface model integrated biosphere simulator (IBIS) (Foley et al 1996). IBIS is a dynamic global vegetation model that simulates changes in the composition and structure of vegetation in response to environmental conditions (detailed specification in Delire et al 2002). Most significantly, IBIS provides a representation of vegetation dynamics appropriate for global ecosystem modeling. Net primary productivity (NPP) is calculated by integrating primary production through the year discounting maintenance respiration and the carbon loss due to growth respiration. The model parameters in the IBIS phenology module were modified from calibrated results for the caatinga (Cunha et al 2013).
2.1. Experimental modeling design
Initially two simulations were conducted with observed global SST (www.cdc.noaa.gov/data/gridded/data.noaa.oisst.v2.html) for two time periods: 1982–2011 and 2012 (namely, experiments C10 and C12). The first is run with the 12 months of climatology computed over the period (1982–2011), and C12 applies observed SSTs for the 12 months in the year 2012 (figures 1(a)–(b)). These experiments therefore simulate the mean climate in Northeastern Brazil and the extreme climate of the year 2012.
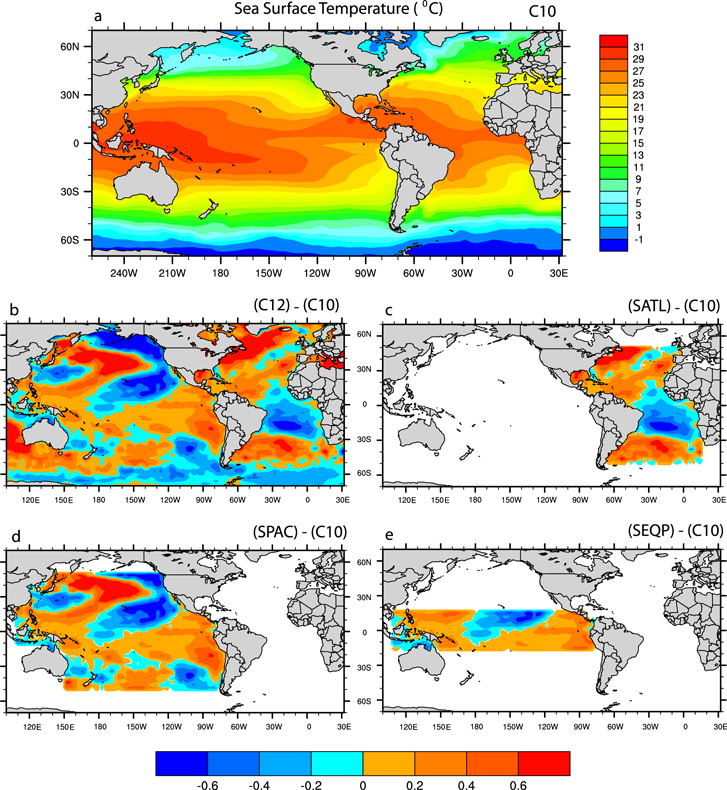
Figure 1. Global distribution of SST (°C) applied in C10 (a), C12 (b), SATL (c), SPAC (d), SEQP (e) experiments. White regions represent SSTs as represented by the C10 experiment.
Download figure:
Standard image High-resolution imageStrictly speaking, two groups of climate simulations are evaluated. Experiments forced by observed SST maintaining the global distribution (C10 and C12 experiments), and simulations forced by modifying SST for different ocean basins (SATL, SPAC and SEQP). Blended SST patterns are used in each simulation (figure 1). A brief description of the SST forcing is provided in table 1.
Table 1. SST modeling experimental forcing design.
| Experiments | Forcing conditions |
|---|---|
| C10 | 12 months climatological SST based on 1982–2011 interval |
| C12 | Monthly observed SST in the year 2012 |
| C82 | Monthly SST time series throughout 1982–2012 interval |
| SATL | 2012 SST in the Atlantic Ocean and C10 SST elsewhere |
| SPAC | 2012 SST in the Pacific Ocean and C10 SST elsewhere |
| SEQP | 2012 SST in the equatorial Pacific and C10 SST elsewhere |
The SATL, SPAC and SEQP are based on a combination of 1982–2011 climatological SSTs (C10) and the observed SSTs pattern for 2012 (C12). To avoid discontinuity, a relaxation factor was applied to the interface between the SSTs according to a sine function. These simulations were run for 50 yr. The influence of three different regions that strongly affect the NEB climate can be evaluated: (1) the Atlantic Ocean experiment (SATL) is defined as SST changes between 50°N–50°S and 15°E–92°W (figure 1(c)); (2) Pacific Ocean experiment (SPAC) in the region from 50°N to 50°S and from 74°W to 110°E (figure 1(d)). (3) The equatorial Pacific (SEQP) from 18°N to 18°S and from 77°W to 110°E (figure 1(e)).
To obtain a more realistic representation of the vegetation and climate, modeling output were analyzed for the last 40 yr of each simulation—the first 10 yr of each simulation are required for the model to approach an equilibrium state, specifically with respect to soil moisture. In all simulations, atmospheric CO2 concentrations were set to 390 ppmv.
However, it interesting to evaluate the model capability to reproduce the inter-annual variability of the precipitation field in the NEB. In this sense, a simulation forced with monthly observed globally SST for the period between 1982 and 2012 has also been conducted (C82 experiment). The performance of CCM3-IBIS in simulating the regional precipitation of the caatinga (in box, 6–17S and 38–47W) is, therefore, compared to the Global Precipitation Climatology Project (GPCP, www.esrl.noaa.gov/psd/, Adler et al 2003). The comparison between the sensitivity experiments and the climatological simulations (C10 and C12) allows the identification of the SST pattern that most strongly induced the extreme drought of 2012.
3. Results and discussion
Precipitation in NEB exhibits high spatial and temporal variability. Monthly precipitation patterns across this region indicate that the rainy season typically begins inland in late December, reaching a peak between March and April along the coastal region. Precipitation is very low (<2 mm d−1) between June and October, representing the dry season for the caatinga biome.
We forced CCM3-IBIS with 1982–2012 SST time series data to assess the model's reliability to simulate droughts episodes in NEB. A comparison between the annually averaged evolution of precipitation and the GPCP dataset (figure 2(a)) indicates very good agreement between the datasets. However, CCM3-IBIS shows smaller amplitude variations. The longest droughts throughout the 31 yr sample period occurred in the years 1982, 1993, 1998, 2001 and 2012 (figure 2(a)). The ability of SST-forced models to reproduce NEB precipitation variability has previously been demonstrated by Giannini et al (2004).
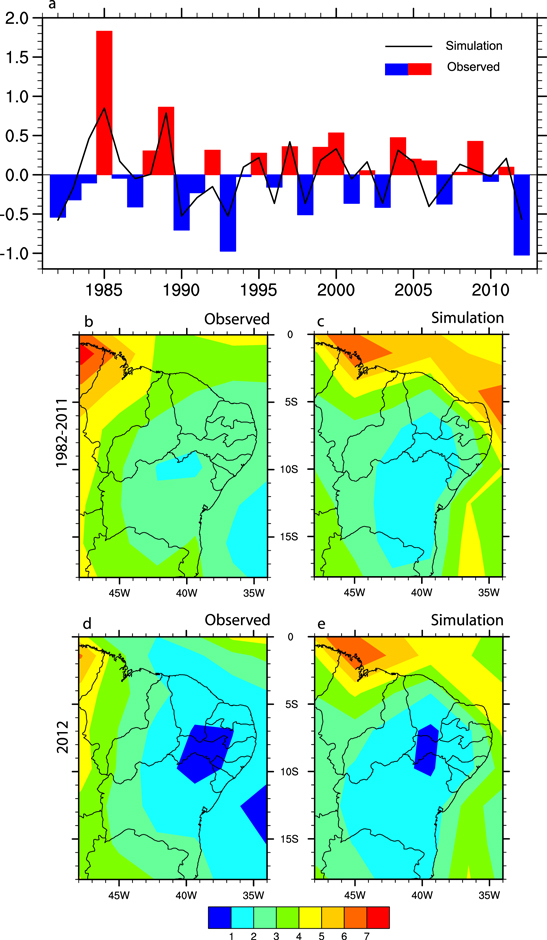
Figure 2. Annually averaged precipitation (mm d−1) in the NEB semi-arid region from (a) 1982 to 2012 for observations and the mean of three ensemble members. Maps represent observed and ensemble mean simulated precipitation for the 1982–2011 climatological average (b) and (c) and the 2012 drought (d) and (e). See text for details.
Download figure:
Standard image High-resolution imageDry events typically have higher amplitude than rainy events, a feature that is also well simulated by CCM3-IBIS. The 2012 precipitation anomaly is much more pronounced than previous droughts during the study period (figure 2(a)), although it should be stressed that evaluation of other droughts is beyond the scope of the present study.
The GPCP data and C10 simulation indicated values as high as 4 mm d−1 for annually averaged precipitation in the Northern portion of NEB (figures 2(b) and (c)). In contrast, in the central part of NEB (the semi-arid region) precipitation is less than 2–3 mm d−1. Most precipitation in the coastal areas of NEB (the Atlantic forest region) comes from organized weather systems that move from East to West embedded in the lower tropospheric wind flow. Inland precipitation is more related to large-scale process, primarily the southward migration of the ITCZ in response to changes in the Pacific and Atlantic SSTs. Under standard climatological conditions the C10 experiment (figure 2(c)) simulates slightly lower precipitation over the caatinga region than the GPCP data (figure 2(b)).
Figures 2(d) and (e) show the observed and simulated conditions in 2012. Despite the dryer conditions indicated by the GPCP data in the Northern part of NEB, the 2012 precipitation pattern in observations and models shows marked similarities, especially below 5S latitude (figures 2(d) and (e)). It is clear that 2012 was characterized by a substantial reduction of precipitation concentrated in the semi-arid region.
Seasonal changes of precipitation are highly correlated to NPP in the caatinga. Previous studies focusing on vegetation response to precipitation have shown that an altered seasonal cycle with longer drier spells can potentially increase soil moisture stress and decrease primary productivity in arid land (Thomey et al 2011). However, the response may not be linear, typically exhibiting a lag in climatic regions with higher precipitation (Bustamante-Becerra et al 2014).
It has recently been argued that total annual rainfall is a critical driver leading to distinct optima in both plant production and soil carbon storage (Rohr et al 2013). However, in many tropical dry ecosystems this may not be the case. Gerten et al (2008) argued that despite the importance of precipitation in leading changes in ecosystems, biophysical responses are tightly linked to the nature and seasonal timing of precipitation changes.
Modeled climatic conditions in 2012 caused significant modifications in modeled land-cover (figures 3(a) and (b)). Specifically, more than half the open shrubland (the main plant functional type in caatinga—figure 3(a)) was converted to desert vegetation (figure 3(b)). The traditional agricultural practices of vegetation burning in the region (Novaes et al 2013) may further increase vulnerability to aridity. Reduction in precipitation over the NEB in the C12 simulation is very likely the main cause of land cover change. Although, increased near surface air temperature (see figure 4(b)) and higher evapotranspiration may also play a role.
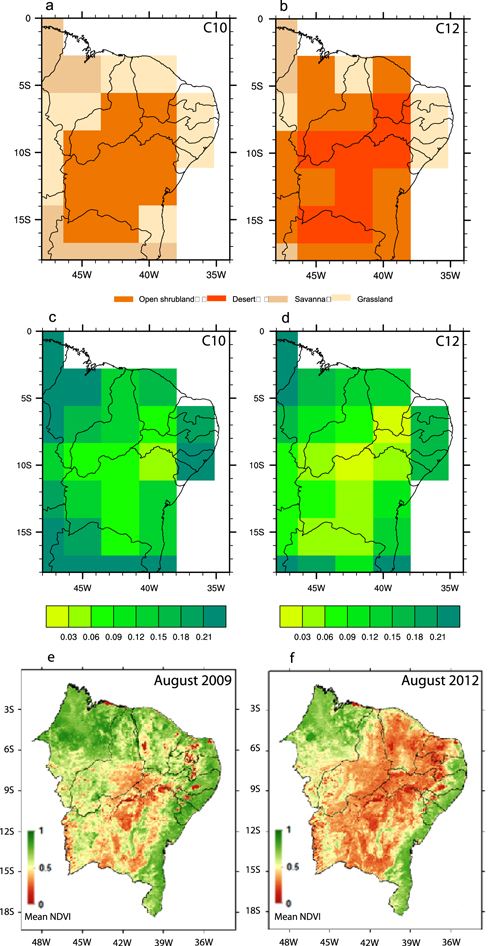
Figure 3. Simulated vegetation distribution and NPP (kg C m−2 yr−1) for the C10 experiment (a), (c) and C12 experiment (b), (d), and NDVI for August 2009 (e) and August 2012 (f). Lower values indicate the effect of drought on vegetation health.
Download figure:
Standard image High-resolution image
Figure 4. Areal averaged precipitation (a), near surface air temperature (b) and NPP (c) in the caatinga region for the SST anomaly sensitivity experiments. See text for details.
Download figure:
Standard image High-resolution image
Differences in annual modeled NPP rate between experiments C10 and C12 were also observed (figures 3(c) and (d)). The estimate of NPP based on the C10 modeling experiment is broadly in line with other neo-tropical dry forests. Rohr et al (2013) found NPP based on litter fall values between 0.26 and 0.39 kg C m−2 yr−1.
The annual NPP in the C12 simulation is lower than in the C10 simulation (typical climatological conditions). These differences are more pronounced where the caatinga is replaced by desert-like vegetation and precipitation anomalies are less than −1 mm d−1 (figures 2(d) and (e)). The NPP response to small changes in precipitation is more difficult to assess.
The 2012 climate extreme caused widespread changes in plant physiology, in particular in the annual net ecosystem exchange (NEE) of the caatinga. The NEE is the balance between NPP (above and below ground) and heterotrophic respiration. Negative values of NEE indicate that relatively more carbon is being captured by primary productivity than is being released into the atmosphere through respiration. NEE in the C12 (drought) experiment is 10% higher than the climatological values as delivered by the C10 experiment, which indicates that in 2012 relatively less CO2 is released to the atmosphere by nocturnal respiration. This feature occurs due to the dominance of C4 plants in the semi-arid (Powell and Still 2009) causing lower respiration rate as compared to NPP rate.
To compare the model simulations with observations, the normalized difference vegetation index (NDVI), calculated using the methodology of Barbosa et al (2012), was used to evaluate the effects of aridity on the NEB vegetation (figures 3(e) and (f)). Our results were verified though comparison with MODIS NDVI accessed on http://neo.sci.gsfc.nasa.gov/view.php?datasetId=MOD13A2_M_NDVI. NDVI can also be thought of as an indicator of vegetation health in relation to precipitation variability (Barbosa et al 2006).
Maps of mean NDVI were constructed for 2012 and 2009 (a very wet year). The effects of variations of aridity are clear (figures 3(e) and (f)) with the severe drought of 2012 characterized by considerably reduced areas of green biomass. More generally, the NDVI maps of 2009 and 2012 are in broad agreement with our model results with respect to vegetation changes (figure 3).
When averaged over the caatinga region, precipitation, temperature and NPP clearly respond to SSTs patterns (figure 4). The annual average precipitation in 2012 is lower than for any other period in the past 30 yr—a reduction of 25% (−0.48 mm d−1) as compared to typical climatological conditions (see precipitation values in figure 4(a), for C12 and C10 experiments).
Changes in precipitation, temperature and NPP in the semi-arid region in 2012 can be traced back to changes in SST in a specific oceanic region. The 2012 decrease in precipitation is linked to changes in Atlantic SST patterns (SATL), with difference between the C12 and SATL experiments of 4% or less (+0.05 mm d−1). In contrast, the experiments forced by the 2012 SST changes in the Pacific regions (SPAC, SEQP, figure 4(a)), delivered precipitation very close to typical climatological conditions (∼2.04 mm d−1).
Regionally averaged surface temperature over the caatinga in 2012 (C12 experiment) shows a warming of 1.3 °C in relation to the 30 yr climatological mean (C10 experiment) (figure 4(b)). The various SST anomaly experiments indicate that this warming occurs when the model is forced with the observed Atlantic SST anomaly.
Interestingly, the SST pattern in the Atlantic Ocean in the C12 simulation has lower SST in the Southern Hemisphere tropical region in comparison to the C10 experiment (figure 1(c)). These results are consistent with warming over the caatinga arising from changes in the surface heat flux balance with more of the solar radiation balanced by sensible and long wave radiation transfer and less by evapotranspiration, leading to higher near surface air temperature. A similar change in energy partition (Bowen ratio) has been observed in the Amazon region when forest is replaced to pastures or agricultural crops (e.g. Botta et al 2002). This is related to the fact that the larger biomass is less sensitive to seasonal precipitation changes.
Sensitivity of the terrestrial carbon cycle to 2012 climate extreme is shown by the reduction in annual NPP of 0.05 kg C m−2 yr−1, as compared to the period 1982–2011 (figure 4(c)). The response of the ocean–atmosphere–biosphere interactions in the caatinga indicates that the Atlantic SST pattern plays a significant role in determining the net photosynthetic rate. The difference between the simulations with global and Atlantic only SST anomalies is only 0.01 kg C m−2 yr−1, significantly smaller than the other experiments: SPAC (0.03 kg C m−2 yr−1) and SEQP (0.04 kg C m−2 yr−1).
4. Conclusions
Our investigation aimed to identify the drivers of the 2012 NEB drought and the associated biophysical responses of the caatinga biome. We demonstrate that precipitation and vegetation productivity in the caatinga is highly sensitive to alterations in SST. The 2012 drought resulted in lower annual NPP and intensified NEE values (net uptake of CO2 by plants). This is associated with the fact the plant respiration is extremely reduced as compared to the loss of NPP. Moreover, we demonstrate that variations in tropical Atlantic SST were primarily responsible for the extreme drought of 2012.
The results presented here strongly indicate the need for efforts to protect native vegetation and people to from mitigate the impacts of natural climate variability or human induced climate changes. For example, the effects of increased aridity can be gradually reduced through native species restoration. However, such programs will only be successful if they are implemented in parallel with social programs that improve the economic conditions of rural households who rely on land resources. Future research should focus on untangling the complex ocean–atmosphere–biosphere interactions, and more precisely forecasting the impacts of future droughts on vegetation cover and associated climatic feedbacks (Ladle et al 2011).
Acknowledgments
We thank the Brazilian agencies CAPES and CNPq for financial support.