
Abstract
This paper summarizes the status of the COMPASS tokamak, its comprehensive diagnostic equipment and plasma scenarios as a baseline for the future studies. The former COMPASS-D tokamak was in operation at UKAEA Culham, UK in 1992–2002. Later, the device was transferred to the Institute of Plasma Physics of the Academy of Sciences of the Czech Republic (IPP AS CR), where it was installed during 2006–2011. Since 2012 the device has been in a full operation with Type-I and Type-III ELMy H-modes as a base scenario. This enables together with the ITER-like plasma shape and flexible NBI heating system (two injectors enabling co- or balanced injection) to perform ITER relevant studies in different parameter range to the other tokamaks (ASDEX-Upgrade, DIII-D, JET) and to contribute to the ITER scallings. In addition to the description of the device, current status and the main diagnostic equipment, the paper focuses on the characterization of the Ohmic as well as NBI-assisted H-modes. Moreover, Edge Localized Modes (ELMs) are categorized based on their frequency dependence on power density flowing across separatrix. The filamentary structure of ELMs is studied and the parallel heat flux in individual filaments is measured by probes on the outer mid-plane and in the divertor. The measurements are supported by observation of ELM and inter-ELM filaments by an ultra-fast camera.
Export citation and abstract BibTeX RIS

Content from this work may be used under the terms of the Creative Commons Attribution 3.0 licence. Any further distribution of this work must maintain attribution to the author(s) and the title of the work, journal citation and DOI.
Corrections were made to this article on 13 May 2016. The publication year was corrected.
1. Introduction
The COMPASS tokamak has undergone an extensive development since its relocation from UKAEA Culham, UK (where it was operated as COMPASS-D) to the Institute of Plasma Physics of the Academy of Sciences of the Czech Republic (IPP AS CR) in 2006 [1]. COMPASS has been equipped by a new power supply system [2], comprehensive diagnostic system [3] and also with a new control and data acquisition system [4]. Recently, H-mode has been successfully achieved accompanied by both Type-III and Type-I Edge Localized Modes (ELMs). The H-mode can be generated either in Ohmic discharges or as an NBI assisted H-mode. The new heating system consisting of two Neutral Beam Injectors (NBIs) represents a flexible tool enabling either co- or balanced injection.
The main focus of COMPASS is on detailed studies of plasma edge and scrape-off-layer (SOL) physics in ITER-relevant regimes (H-mode) and ITER-relevant plasma shape (1 : 10 in linear dimension). Therefore, a comprehensive diagnostic set focused on these regions has been developed at COMPASS [3]. In addition, the ITER-like plasma shape will also allow to provide data in a different parameter range (major and minor radii, collisionality, etc) in addition to ASDEX-Upgrade and JET tokamaks in order to improve the scallings towards ITER. Therefore, the aim of this paper is to describe the operational scenarios and the main edge and SOL diagnostics for the studies mentioned above in order to provide a baseline for future studies.
The paper is organized as follows: section 2 contains general description of the device, auxiliary heating methods etc. Section 3 gives an overview of available diagnostics, especially those used for H-mode and ELM characterization described further in sections 4 and 5, respectively. Section 6 summarizes the results and describes the future plans.
2. The COMPASS tokamak
The COMPASS tokamak is a compact experimental device (R = 0.56 m, a = 0.2 m) operated in a divertor plasma configuration with ITER-like plasma cross-section [1, 5]. COMPASS operates with plasma current up to 400 kA, toroidal magnetic field in the range 0.8–2.1 T, elongation up to 1.8 and uses different working gases: H, D or He [1]. COMPASS can generate various plasma configurations: circular, elongated or single null X-point (SND) for both toroidal directions of  and
and  . The vacuum vessel of COMPASS is equipped with an open divertor covered by carbon tiles. All experimental results presented here were performed with D-shaped plasma (SND configuration) with the ion grad-B drift direction towards the X-point.
Two Neutral Beam Injectors operating with deuterium/hydrogen beams (energy  keV, and port-through power
  MW each, beam diameter 5 cm, pulse length <0.3 s) are used for additional plasma heating. The beams are injected tangentially (on-axis, co-Injection at present). The NBI system of the COMPASS tokamak is described in more detail in [6] and [7].
Extensive wall conditioning methods are used to minimize the deuterium inventory and impurity influx. Several-day baking of the vacuum vessel and plasma-facing components (PFCs) at temperature 150 °C is followed by boronization of the hot vacuum vessel by carborane vapors [8] in helium glow discharge (GDC) to optimize the wall conditioning and decrease the radiating power losses by impurities. In between shots a 10 min Helium GDC is usually performed.
3. Diagnostics setup
The COMPASS tokamak is equipped with an extensive set of diagnostics with high temporal and spatial resolution focused mainly on edge and SOL plasma studies. High Resolution Thomson Scattering (HRTS) [5, 9] is based on two Nd:YAG lasers (1.5 J each, 30 Hz) in conjunction with two detection systems, one for the core plasma and the other for the plasma edge, with 24 and 30 spatial channels, respectively. The laser path is oriented vertically with the optics covering the upper half of the plasma cross-section. The spatial resolution of the edge TS is approximately 3–4 mm in a vertical direction, which corresponds to 2–3 mm (∼a/100) when mapped to the outer mid-plane (OMP) depending on the magnetic configuration. Such a spatial resolution, similar or higher than in MAST [10], ASDEX Upgrade [11] or JET [12], is sufficient to resolve radial profiles of the pedestal. HRTS provides ne and Te profiles during the discharge with the temporal resolution of 60 Hz, given by the repetition rate of the lasers. The line-integrated electron density ne is measured by a single-channel interferometer ( mm) across the central vertical chord. Edge density profiles are also measured at outer midplane using Beam Emission Spectroscopy on the Lithium beam operating at 60 keV with 4 μs chopping and spatial resolution ∼1 cm [13] similar to ASDEX Upgrade [14] and fast reflectometer in K and Ka bands with
  μ s.
μ s.
COMPASS is equipped with a set of 400 magnetic diagnostic coils providing a full poloidal coverage at several toroidal locations. Local poloidal magnetic fields and their fluctuations are measured by a set of 16 internal partial Rogowski (IPR) coils located at one toroidal position and three poloidal arrays of 24 Mirnov coils (MC) located at three different toroidal positions (figure 1). These coils enable poloidally localized measurement of toroidal mode number n in the range of 1–4. Moreover, the tokamak chamber is fully covered by 104 saddle loops that also enable poloidally localized measurements of n in the range of 0–2 (on the low-field side in the range of 0–4). Magnetic data are also provided as an input for the EFIT equilibrium reconstruction [15].

Figure 1. Left: top view of the tokamak showing toroidal positions of magnetic diagnostics sensors. Right: cross-section of chamber showing poloidal positions of magnetic diagnostics sensors. Red—Mirnov coils (MC), blue—internal partial Rogowski (IPR) coils.
Download figure:
Standard image High-resolution imageThe total stored plasma energy is measured by diamagnetic loop as well as derived from EFIT reconstruction.
The energy spectrum of charge exchange neutrals is measured by the neutral particle analyzer equipped with 12 channels for deuterium and 12 channels for hydrogen atoms. The ion temperature and energy spectra of fast atoms during the NBI are determined with temporal resolution >100 μs.
Hydrogen emission line  at 656.1 nm is monitored by photo-multipliers (PMTs) [16] in two chords—the first chord integrates horizontally at the midplane and the second chord is vertical at the high field side (HFS) parallel to the HFS belt limiter. Six arrays of AXUV-based fast bolometers (the energy range of
  keV) and two arrays of SXR detectors (
 keV) provide the tomographic reconstruction of the plasma emissivity with temporal resolution ∼1 μs [18].
Visible light emitted by the plasma is monitored by two fast EDICAM cameras [17] with 450 fps in full-frame ( ) up to 116 000 fps in reduced (
 ) resolutions. The first camera provides a general view of the plasma configuration (position, shape, wall interaction, etc.) via a tangential view. The second camera is used for monitoring of the divertor region. Additionally, two ultra-fast Photron cameras of APX-RS and SA5 with 3000/7000 fps in full (
 ) up to 250 kfps (
 ) / 1 Mfps (
 ) in reduced resolutions are used for observation of fast MHD events (ELM filamentary structure, Beta-induced Alfven Eingenmodes, Geodesic-Acoustic Modes, etc.).
SOL and edge plasma are studied using two reciprocating manipulators (one at the outer midplane and one probing the edge plasma from the top of the vessel toroidally shifted by 22.5°). The horizontal reciprocating manipulator is equipped by an interface compatible with the manipulator at ASDEX-Upgrade and allows installation of wide variety of probe heads, such as Retarding Field Analyzer [19],  analyzer [20] or sandwich probe [21]. For the H-mode and ELM studies in the next sections the manipulator was, however, equipped with the probe head composed of two Langmuir probes (LP) and three ball-pen probes (BPP), spaced poloidally (see figure 2 left). The Langmuir tips measure the floating potential
  and ion saturation current
  . BPPs operate in floating mode and provide fast measurements of plasma potential
  [22–26]. It was shown [22] that the difference between the signal of the BPP and the signal of an adjacent floating Langmuir tip is proportional to electron temperature
  . The coefficient
  was found by benchmarking the probe data by TS measurements [23, 26]. An example is shown in figure 2 right.

Figure 2. Left: photo of the probe head fixed on the horizontal manipulator. Right: comparison of radial profiles of Te measured by edge TS and by the probe (circular plasma). Good agreement of both methods was observed also on ASDEX-U and MAST tokamaks [27, 26].
Download figure:
Standard image High-resolution imageThe principal advantage of Te measurement by combination of the BPP and floating LP is that the temporal resolution is limited mainly by the sampling frequency of the data acquisition system (5 MHz on COMPASS).
The plasma in the divertor region is analyzed by an array of 39 LPs [28, 29] with a spatial resolution of approximately 5 mm and by an array of 10 BPPs and 4 LPs toroidally separated by 180° from the LP array.
4. H-mode characterization
The experiments described in this section were performed at  T with plasma current in the range of
  –340 kA, plasma elongation 1.8, and edge safety factor
  at the highest plasma current. The plasma discharges were performed in a lower single-null divertor configuration with the ion grad-B drift direction towards the X-point and triangularity equal to 0.4 (figure 3). The NBI heating delivered up to 300 kW of power into the plasma. Plasma was fuelled by a gas puff system located below the outer midplane (OMP). The plasma shape was controlled by preprogrammed waveforms in the poloidal shaping circuits, while the plasma position centre was controlled in a real-time feedback loop [4].

Figure 3. Plasma cross-section in COMPASS (EFIT reconstruction).
Download figure:
Standard image High-resolution imageDuring the COMPASS-D operation in UKAEA Culham, ohmic and ECRH assisted H-modes were achieved [30]. Upon its re-installation in IPP Prague, ohmic as well as NBI assisted H-modes have been successfully generated after application of the corresponding vacuum vessel conditioning (see section 2). H-mode is achieved either in ohmic regime, as soon as the plasma current exceeds approximately 200 kA (at  T), or by heating the plasma by the NBI systems. The L–H power threshold
  has a minimum at line-average density in the range of (3.5–4) × 1019m−3. At these densities the beams of neutral atoms generated by NBIs are already fully absorbed with a negligible shine-through, however, NBI allows to heat plasma also at high densities in contrast to the original ECRH system. The L–H transition is usually followed either by small Type-III ELMs with frequencies in the range of 400–1500 Hz or ELM-free period. At high plasma currents or in case of NBI-heated plasma, large Type-I ELMs with typical frequency in the approximate range of 80–400 Hz are generated. Typical temporal evolution of ohmic as well as NBI-assisted H-mode discharges are shown in figure 4.

Figure 4. Left: typical temporal evolution of ohmic ELMy H-mode, triggered at t = 1063 ms,  9327. Right: typical temporal evolution of NBI-assisted H-mode
  9339 (
 kW).
kW).
Download figure:
Standard image High-resolution imageThe L–H transition is mainly identified by a sudden drop of  intensity as seen in figure 4 and by abrupt reduction of fluctuations of ion saturation current on a dedicated divertor probe located at HFS part of the divertor. The plotted stored energy is measured by the diamagnetic coils. After the transition, line-average density and plasma kinetic energy increase due to improved particle/energy confinement. The energy confinement time
  in L-mode is approximately 10 ms, while in H-mode it increases up to 20 ms. If the ELM-free H-mode is generated, the radiation power increases significantly due to impurity accumulation, and therefore, ELM-free H-mode discharges often terminate by disruptions.
The L–H transition generally appears in COMPASS when the normalized power across the separatrix reaches value of 15 kW m−2 for  T. This value, however, depends also on the status of the vacuum vessel walls (boronization), when the first observations show an increase of
  by approximately 30% in 3 weeks after the boronization. A clear effect of the X-point height above the divertor on the L–H power threshold has been observed showing an increase of the
  with increasing X-point height in COMPASS. In many discharges, the L–H transition is triggered by sawtooth crash. In a representative set of 52 shots, the L–H transition mostly appears within the first 10% of the sawtooth period (as shown figure 5(left)) and is followed by an ELMy H-mode.

Figure 5. Left: delay of the L–H transition after a sawtooth crash (in 52 shots). Right—Evolution of the core emission of SXR and the electron temperature measured by combined BPP+LP ∼10 mm inside the separatrix.
Download figure:
Standard image High-resolution imageA high correlation between the sawtooth crash and the L–H transition is probably due to fast transport of the core energy to the edge, which supplies free energy to contribute to the formation of the edge transport barrier. The strong link between the core and edge plasmas during sawteeth is demonstrated in the figure 5(right), which shows modulation of the edge electron temperature by sawteeth even in the vicinity of the separatrix.
Typical profiles of electron temperature and density during the H-mode are shown in figure 6 as measured by the HRTS diagnostic providing a spatial resolution of 3 mm in the edge plasma, which is high enough for good resolution of the density and temperature pedestal. While the central electron temperature on COMPASS can presently reach 1.2 keV, the maximum pedestal temperature corresponds to 400 eV and pedestal density can reach values up to 1020 m−3. The pedestal width is approximately 20 mm for both the electron temperature and density. Density profiles are noticeably more flat than temperature profiles as is evident from figure 6. The position, width and height of pedestal are obtained by fitting the edge plasma profiles with a modified hyperbolic tangent function (mtanh) descibed in [31].

Figure 6. Radial profiles of the electron temperature, density and pressure as measured in ohmic H-mode ( kA,
kA,  m−3).
m−3).
Download figure:
Standard image High-resolution imageThe characterization of ELM types is given by the ELM frequency dependence on the power across the separatrix  [32], which is given in COMPASS by,
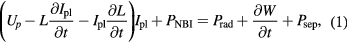
where Up is the loop voltage, L is the plasma inductance (from EFIT reconstruction),  and
and  are the additional heating power and radiation losses, respectively, and
  is the time derivative of the total kinetic energy stored in the plasma.
Such an ELM frequency scaling with  for COMPASS is shown in the figure 7. This scaling is based on data from 7 different ELMy H-modes. The L–H transition occurs typically at
  kW m−2 on COMPASS, followed by a phase with Type-III ELMs, which frequency decreases with increasing
  . With a further increase of
  , the ELM-free region is crossed at
  kW m−2, i.e. approximately two times higher than the L–H power threshold. With a further increase of
  , the ELM frequency increases, which is a signature of Type-I ELMs and H-mode with the characteristicly large ELMs generated. The scaling is qualitatively consistent with results from COMPASS-D [34], although the ELM frequencies achieved at COMPASS are significantly lower. This might be caused by different auxiliary heating methods.

Figure 7. Scaling of ELM frequency with the power density across the separatrix for seven shots.
Download figure:
Standard image High-resolution image5. Edge localized mode structure
The filamentary structure of individual ELMs (e.g. [35]) was studied by the fast Photron SA5 camera installed at the outer midplane observing the plasma tangentially. ELM filaments at low-field side (LFS) were intensified by a puff of deuterium gas. A snapshot taken during an ELM is shown in figure 8 (left), revealing filaments with a high poloidal mode number. In figure 8 (right), we show a temporal dependence of a signal from the pixels taken along the red line in the left figure, crossing the gas puff region. The picture clearly shows small regular filaments during the inter ELM period with a characteristic frequency 20–40 kHz. In addition, we see three clear large filamentary structures during the ELM event followed again by small filaments.

Figure 8. Left: snapshot of an ELM taken by the Photron SA5 camera (shot  9284, t = 1133.487 ms). The frame rate is 150 kHz, the exposure time is 6.42 μs, and image resolution
  pixels. The bright spot at LFS corresponds to the position of deuterium gas puff. Right: temporal evolution of the signal from a column of the camera pixels, marked by the red line in the snapshot, after substracting the background light.
Download figure:
Standard image High-resolution imageThe fine filamentary structure of a single ELM at OMP is measured by the horizontal reciprocating probe head by combined BPP+LP [33]. Figure 9 shows a clear four filamentary structure of ELM in SOL, each of them consisting of even smaller structures, visible in the signal of temporal evolution of the electron temperature and the ion saturation current obtained with a very high temporal resolution, typically 0.2 μs. Moreover, we observe a precursor on electron temperature as well as magnetic oscillations with a characteristic frequency 150–200 kHz during last 20 μs before the ELM crash.

Figure 9. Temporal evolution ion saturation current and the parallel heat flux measured by the combined BBP+LP during a single ELM at OMP with sub-microsecond temporal resolution.  6062, probe at separatrix position, R = 0.744 m.
Download figure:
Standard image High-resolution imageA single probe plunge lasts approximately 100 ms. During this time, the probe typically encounters several tens of ELMs, each at different radial position. This allows us to evaluate radial decay length of peak ELM heat flux at OMP  as well as the decay length of the heat flux in the inter-ELM periods. This is demonstrated in figure 10 on the case of an Ohmic H-mode with stable ELM frequency
  1 kHz, where the measured values of
  are plotted against the corresponding radial position of the probe. Fit of the peak values of
  during ELMs by exponential function
  gives
gives  mm. This value is significantly larger than the value obtained by similar fit made during inter-ELM periods
  mm, indicating significant broadening of the heat flux width due to ELM radial movement (
 km s−1 [33]). Comparison of the inter-ELM power width λ with empirical multi-machine scaling [36] then shows that the measured values are within the range of predicted values
  –2.7 mm. Here, the lower value is evaluated using scaling based on
  , q95 and
  (regression #9 in [36]), and the higher one originates from a scaling based on
  , R0, Bp, a/R0 (regression #15 in [36]).
  is the power crossing the separatrix and Bp is poloidal magnetic field at OMP.

Figure 10. Parallel heat flux  measured by the horizontal reciprocating probe at OMP during a single plunge in shot
  6639. Magenta line represents a fit of radial decay length of the peak ELM values, green line shows a fit of the power width in the inter-ELM periods.
Download figure:
Standard image High-resolution imageDue to installation of BPPs and LPs into the divertor, a sub-microsecond measurement of  during ELMs can be performed also at the divertor target. Example of such a measurement is shown in figure 11, where a clear filamentary structure of ELM is visible again. A high temporal resolution allows to resolve the parallel energy flux within the individual filaments, which is not possible using standard methods (swept Langmuir probes, IR thermography, etc). In addition, the temporal evolution of the fast parallel heat flux signal is different from the measurement at OMP. At present, only a single-point measurement is available. However, a new radial divertor array of 60 divertor BPPs and LPs that will allow for systematic measurement of parallel energy flux distribution at the divertor target and its comparison with the OMP values is under construction.

Figure 11. Temporal evolution the parallel heat flux measured by the combined BBP + LP in a divertor (LFS part) during a single ELM with sub-microsecond temporal resolution in the discharge  7891.
7891.
Download figure:
Standard image High-resolution image
6. Summary
The paper summarizes the status of the COMPASS tokamak including the NBI heating system and describes the edge-focused diagnostic equipment, which provides, together with characterization of the operational scenarios, a basis for future studies.
Particularly, the new wall-conditioning method using carborane vapors to minimize radiation losses has been introduced and, together with a single null divertor plasma configuration with an ITER-like plasma poloidal cross-section, enabled generation of the first H-mode discharges. H-mode is generated in either ohmic or NBI-assisted regime as soon as the power across separatrix reaches approximately 15 kW m−2. The minimum L–H power threshold is observed at (3.5– m−3 similar to other tokamaks. In many plasma discharges, the L–H transition was triggered by large sawtooth crashes.
H-mode is accompanied by small high-frequency Type-III ELMs close to the L–H transition or large Type-I ELMs with frequency in the range of 80–400 Hz. ELM free discharges are characterized by a strong increase of radiation due to impurity accumulation resulting in disruptions.
The filamentary structure of ELMs was studied by the ultra-fast camera in visible range showing large filamentary structure of a typical ELM in COMPASS as well as small filaments with frequency in the range of 20–40 kHz during inter-ELM period. The new ball-pen probes located on the reciprocation manipulator at OMP as well as in the divertor were able to measure clear filaments during an ELM and provided a fast measurement of electron temperature and, consequently, parallel heat flux in the individual ELM filaments, which is significantly higher than the one calculated by standard methods. The radial power decay-length of the peak parallel heat flux during ELMs at OMP has been measured by the reciprocating probe equipped by BPPs and LPs and showed its significantly higher value in comparison to the inter-ELM period. The parametric dependence of the ELM power-decay length will be a subject of further studies as it can have a significant consequence for plasma-wall interaction.
Acknowledgments
This work was funded by the projects MSMT LM2011021, GACR P205/12/2327 and GACR 15-10723S.