
Abstract
We present an atlas of 173 synthetic spectra of stars, with mass from 9 to 120 M⊙, covering the region of the OB main sequence stars in the H–R diagram. The spectra were calculated with the stellar atmosphere code CMFGEN, assuming solar metallicity in the ZAMS. In order to study the effect of rotation on the chemical composition of the stellar atmosphere, we calculated two sets of models: with metallicity changed by rotation when the star evolves and maintaining solar metallicity throughout the same evolutionary track. For each model, we calculated its synthetic spectra in the UV (900–2000 Å), optical (3500–7000 Å), and near IR (10,000–30,000 Å). We show the utility of this atlas, obtaining preliminary models for three stars in the field of the VVVCL086 cluster, comparing their IR observed spectra with the ones of the atlas. This process was done in a few hours, while the standard procedure to obtain such models could take several weeks.
Export citation and abstract BibTeX RIS
1. Introduction
Stellar atmosphere models are a useful tool to understand the physical parameters and the chemical composition of the stars. Nowadays, there are several stellar atmosphere codes, some of which are able to compute the atomic populations assuming nonlocal thermodynamic equilibrium (NLTE) and incorporating the effects of the line-blanketing, e.g., TLUSTY (Hubeny & Lanz 1995), FASTWIND (Santolaya-Rey et al. 1997; Puls et al. 2005), and CMFGEN (Hillier & Miller 1998).
There are several methods to find a model that successfully reproduces the observed spectrum of a star. It is possible to calculate a grid of models, covering a range of values for the main stellar parameters, e.g., an effective temperature–log gravity (Teff– log g) grid. The codes able to calculate a model in a short time are the best suited for working under this philosophy; the main disadvantage is the simplification of the physical processes involved, e.g., plane-parallel atmosphere in TLUSTY.
The codes which incorporate the largest number of physical processes consume more computational resources but they produce more realistic models, e.g., CMFGEN. In this case, the standard procedure is to fix some parameters while fitting the others, then changing the fixed parameters while fitting new ones, and so on, iterating until the solution for all parameters is stable. Under this philosophy the computational time consumed to get a model for a particular object may become a severe limitation. When analyzing a large sample of objects this becomes a serious disadvantage.
With the aim of obtaining realistic models and reducing the computation time, we have developed an atlas of synthetic spectra calculated with the CMFGEN code, covering the region of the OB main sequence stars with mass from 9 to 120 M⊙ in the H–R diagram. These synthetic spectra can be used as the starting point in the calculation of the models for several objects. In § 2, we describe the atmosphere models included in this atlas, the assumptions made to calculate them, and the parameters derived from these. In § 3, we describe the atlas, the parameter space, and the covered region within the diagram H–R. In order to show the utility of the atlas, we present an application example in § 4, comparing the IR observed spectra of three stars in the field of the VVVCL086 cluster with the models in the atlas we obtained the stellar parameters, the age, and the metallicity of the cluster. Finally, in § 5, we present our conclusions.
2. Atmosphere Models
The stellar atmosphere models were calculated with the CMFGEN code (Hillier & Miller 1998). This code computes the continuum and line formation in non-LTE, solving the radiative transfer and statistical equilibrium equations in spherical geometry. A hydrostatic structure can be computed below the sonic point. This allows the simultaneous treatment of spectral lines formed in the atmosphere, the stellar wind, and in the transition region between both. Such features make it particularly well suited to the study of massive OB stars with winds.
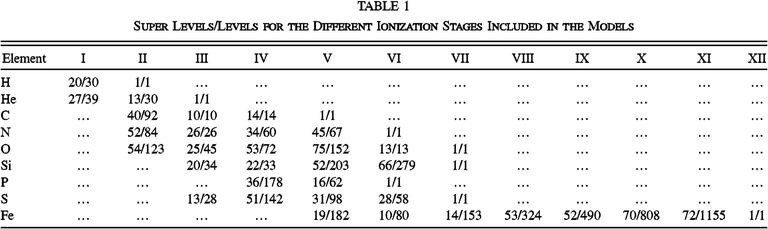
The elements included in the calculation of the models were H, He, C, N, O, Si, P, S, and Fe. For the model ions, CMFGEN utilizes the concept of "super levels," by which levels of similar energies are grouped together and treated as a single level in the statistical equilibrium equations (Hillier & Miller 1998). The stellar models include 27–29 explicit ions of the different elements as function of their Teff. Table 1 summarizes the levels and super levels included in the models. The atomic data references are given in Herald & Bianchi (2004).
|
3. The Atlas
The Atlas includes synthetic spectra in the UV, optical, and near IR, generated from the 176 atmosphere models calculated with CMFGEN, covering the region of the OB main sequence stars with mass from 9 to 120 M⊙.
In order to constrain appropriately the parameters of the models, we use the evolutionary tracks of Ekström et al. (2012) corresponding to solar metallicity (Z = 0.014) at the zero age of the main sequence (ZAMS). For any trace, each point corresponds to a star with specific values of Teff, luminosity (L), and stellar mass (M). We calculated several models along each track with steps of 2500 K in Teff, while the stellar radius and log g were calculated to get the L and M corresponding to the track.
With the purpose of observing the effect of abundance in the spectral lines, we calculate two sets of models based on the evolutionary tracks with rotation and without it. Due to the mixing induced by rotation, the chemical composition of the stellar photosphere changes when star evolves (Maeder et al. 2004). In the models with rotation the He and N abundances increase when the star evolves from the ZAMS to the end of MS while the C and O abundances decrease. On the other hand, in the models without rotation, the abundances remain unchanged from the ZAMS to advanced stages of the star (Ekström et al. 2012). Figure 1 shows the location of the models and the evolutionary tracks in the H–R diagram.
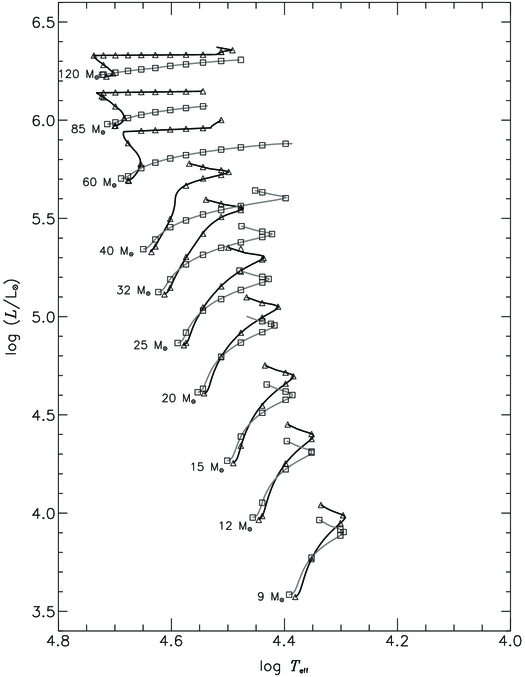
Fig. 1. Position of the models in the H–R diagram and the evolutionary tracks of Ekström et al. (2012). Triangles and squares represent models with and without rotation, respectively.
The elements included in the calculation of all models were H, He, C, N, O, Si, P, S, and Fe. The values of H, He, C, N, and O were taken from the tables of Ekström et al. (2012). For consistency, we assumed the solar metallicity reported by Asplund et al. (2009) for the Si, P, S, and Fe in all models.
The early OB stars may have winds. To model the stellar wind, CMFGEN requires values for the mass loss rate ( ), terminal velocity (vinf), and the clumping factor of the wind (cf). This increases the complexity of the grid. In order to make an appropriate comparison between models without getting lost in the parameter space, we fixed average values for the wind parameters. All models included in the atlas were calculated with the same terminal velocity, vinf = 1000 km s-1. The mass loss rate varies from 1 × 10⁻⁹ for the models with MZAMS = 9 M⊙ to 5 × 10⁻⁶ for the models with MZAMS = 120 M⊙; however, the value of
  is the same for all the models over the same evolutionary track with and without rotation. All models were calculated assuming a homogeneous wind (cf = 1.0).
In the evolutionary tracks of Ekström, the models with rotation have an equatorial rotation velocity vrot = 0.4 vcrit, where vcrit is the critical velocity, defined as
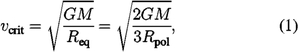
where Req and Rpol are the equatorial and polar radii of the star that deviate from a sphere due to rotation. For consistency with the evolutionary tracks, the theoretical rotation velocities of the models of this atlas are 0.4 times the vcrit reported by Ekström et al. (2012). Thereby, the rotation velocities range from 161 km s-1 for the model of 9 M⊙ at the end of the main sequence to 396 km s-1 for the model of 120 M⊙ at the ZAMS. In order to incorporate the rotation effect into the spectral lines, the synthetic spectra calculated by the CMFGEN code were rotationally broadened using the program ROTIN3. This program is part of the TLUSTY code (Hubeny & Lanz 1995).
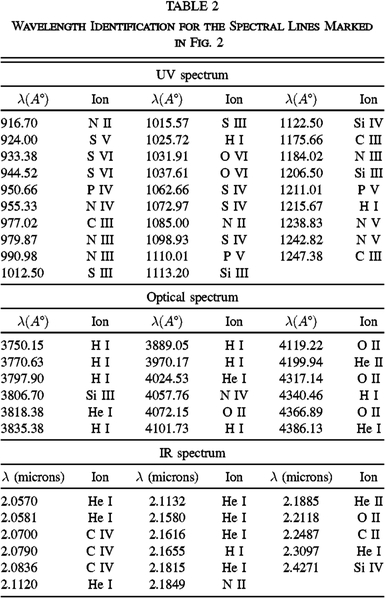
In order to visualize the changes in the spectral lines throughout the evolution of the star, the spectra were grouped following each evolutionary track. Figure 2 shows the UV, optical, and IR spectra for a sample of the models in the atlas. We plotted with solid lines the spectra of the models with rotation, and with dashed lines the spectra of the models without rotation. For consistency, these were rotationally broadened at the vrot of the model with rotation at the same Teff. Table 2 shows only the lines marked on such spectra; however, many other transitions have been considered in the models.
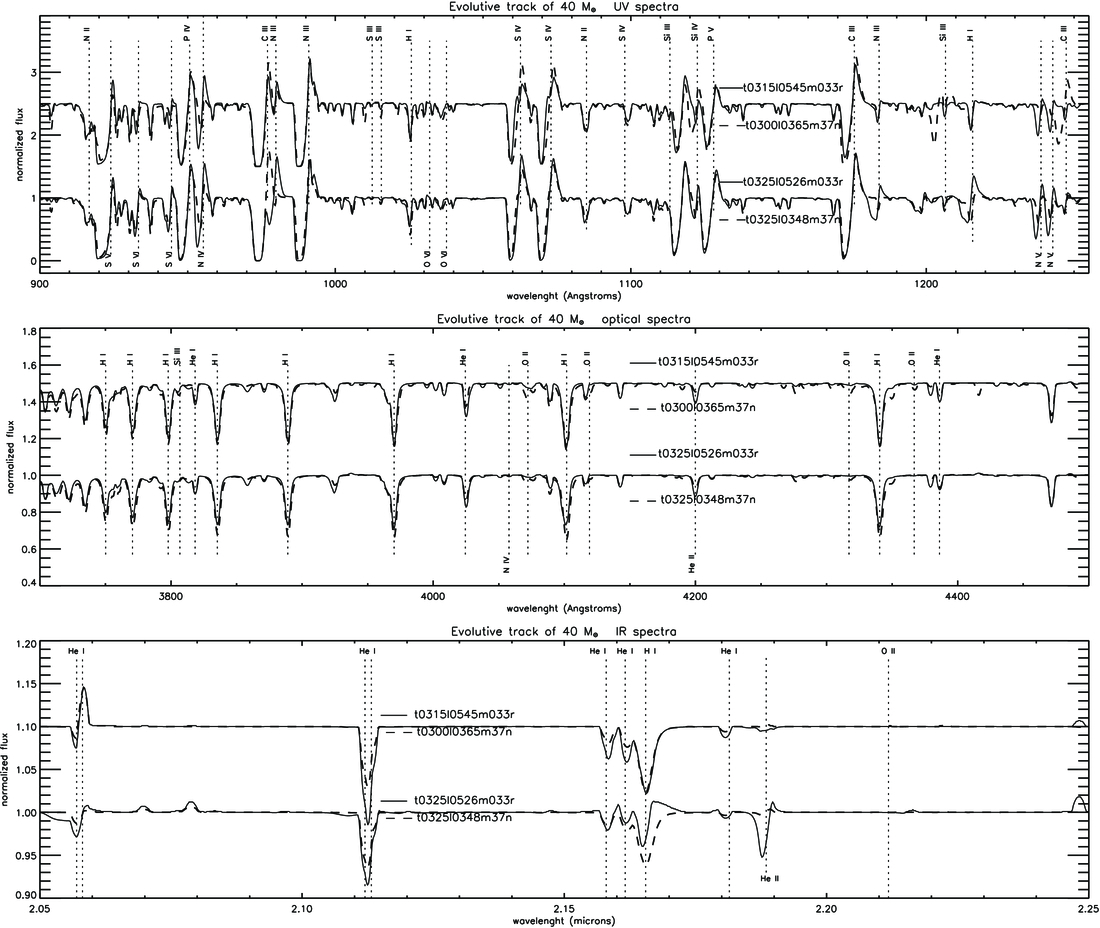
Fig. 2. A sample of the spectra in the atlas. We plotted four models on the evolutive track of 40 M⊙. Solid lines show models with rotation and dashed lines show models without rotation. These plots show only part of the UV, optical, and near IR spectra; data files covering the wavelength range of 900–2000 Å, 3500–7000 Å, and 10,000–30,000 Å are available on websites and electronic version of this article.
|
Tables 3 and 4 summarize the parameters of the 176 models included in the atlas. The plots of spectra UV, optical, and IR of all models are available in two websites: https://sites.google.com/site/modelsobmassivestars/, mantained by C. Fierro, and replicated in http://www.astroscu.unam.mx/atlas/index.html, maintained by IA-UNAM. The files containing wavelength in Angstroms and normalized flux can be downloaded from these websites and from the electronic version of this article. The wavelength range covered by the synthetic spectra is 900–2000 Å for UV, 3500–7000 Å for visual, and 10,000–30,000 Å for near IR.

|

|
By comparing the spectra of the models with similar Teff and progenitor in the ZAMS, with and without rotation, it may be noted that the less massive and evolved stars show similar spectral lines. In contrast, the most massive and evolved stars show significant differences in their spectral lines when rotation is considered.
4. Application Example: Vvvcl 086
The VVV CL086 cluster (Borissova et al. 2011) is a massive cluster found in the direction of the Perseus arm (l = 340.001, b = 0.293). The observed spectra were obtained with the ISAAC spectroscope attached at the Very Large Telescope at ESO Paranal Observatory, Chile. The observation and data reduction are described in Ramírez Alegría et al. (2014).
In order to find preliminary models for three stars in the field of the VVVCL086 cluster, we compare its IR observed spectra with the ones of the atlas. This process was done in a few hours, while the standard procedure to obtain a model for only one object by running several generations of models, changing only one of the parameters while the others remained fixed, consumed several weeks.
4.1. Stellar Parameters
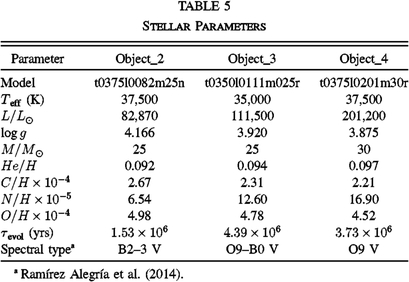
Figure 3 shows the best fit of the observed spectra with the models of the atlas. Table 5 summarizes the physical parameters and the chemical composition obtained for each star from the models.
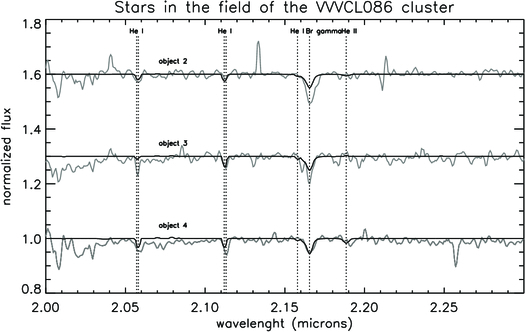
Fig. 3. IR spectra of three stars in the field of the VVVCL086 cluster, and the best fit with the models of the atlas.
|
We can notice that Brγ line is underestimated in models for objects 2 and 3. This line may be affected by the clumping factor (Lenorzer et al. 2004). The fit could be improved by using cf ≤ 1.0.
The effective temperatures obtained from the models are slightly larger than those indicated by the spectral types reported by Ramírez Alegría et al. (2014) for these stars. This difference may be caused by the line-blanketing treatment in the CMFGEN models. Line-blanketing changes the atmospheric structure: due to the metallic lines, photons are more backscattered toward the inner atmosphere. The ionization is then increased in the formation region of the He lines used for the spectral classification. Consequently, when using CMFGEN models, there is a discrepancy for one or two subtypes (Martins et al. 2005; Martins & Schaerer 2003).
4.2. Cluster Stars Members
The wavelength in the observed spectra has an rms uncertainty of 0.5 pixels, which corresponds to ∼30 km s-1 in radial velocity. Because of this, the radial velocity was discarded as a criterion for membership in the cluster.
Figure 4 shows the position of the objects 2, 3, and 4 in the H–R diagram, from its preliminary models. In this, we overplotted isochrones for 1, 3, and 5 Myrs, calculated from evolutionary tracks. From the isochrones, object 2 has an age close to 1 Myr, while objects 3 and 4 have between 3 and 5 Myr. We conclude that objects 3 and 4 are cluster members, while object 2 is not a cluster member. The cluster age was estimates in 4.0 ± 1 Myrs. These results agree with the results obtained by Ramírez Alegría et al. (2014) using the cluster photometric data. The metallicity of the cluster obtained from the models is close to that of the Sun.
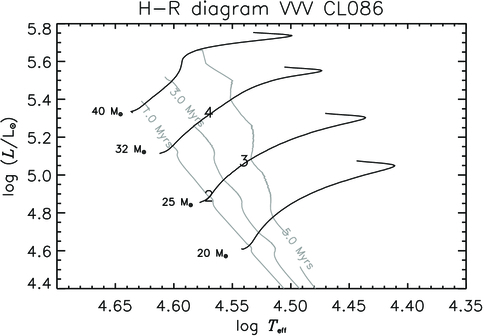
Fig. 4. Position of Objects 2, 3, and 4 in the H–R diagram. We overplotted isochrones for 1, 3, and 5 Myrs.
5. Conclusions
We present an atlas of synthetic spectra, from 176 models calculated with the CMFGEN code. These models cover the region of H–R diagram populated by the OB main sequence stars with mass from 9 to 120 M⊙. The atlas includes the UV, visual, and IR spectra.
The models included in the atlas incorporates many of the physical processes taking place in stellar atmospheres (e.g., line-blanketing, spherical symmetry, and calculation of populations nLTE), producing realistic models. Each model includes 27–29 explicit ions of nine different elements (H, He, C, N, O, Si, P, S, and Fe) as a function of their Teff. We use evolutionary tracks to constrain the values of the Teff, log g, and luminosity of each model. All these features allow us to produce realistic and reliable models for the analysis of a variety of objects observed.
The analysis of three stars of the cluster VVV CL086 shows the utility of this atlas to obtain a model able to reproduce acceptably the observed spectrum. This model allows us to know several parameters of the star (e.g., Teff, log g L, M, and chemical composition), as well as of the cluster (metallicity and age). Usually, this analysis is time consuming. This atlas reduces the time required for such analysis.
We express our acknowledgment to the anonymous referee for his comments and suggestions, which helped us to improve this work. C. R. Fierro was supported by projects 176144 and 24754-IPN of CONACYT. J. Borissova, R. Kurtev, and S. Ramírez Alegría are supported by the Ministry of Economy, Development, and Tourisms Millennium Science Initiative through grant IC120009, awarded to The Millennium Institute of Astrophysics (MAS). J. Borissova, R. Kurtev, and S. Ramírez Alegría are supported by Fondecyt No. 1120601, No. 1130140, and No. 3140605. J. Zsargó is supported by CONACYT grant 168632 CB-2011-01.