

ABSTRACT
We present the photometric properties of the eclipsing binary TU Boo from detailed studies of the period and light variations, based on our new BVR observations and historical data collected from the literature. A total of 349 times of minimum light over 80 yr, including our four timings, were used for the period study. An analysis of the resulting O–C diagram reveals that the orbital period of TU Boo has varied in a quasi‐sinusoidal way superposed on a long‐term period decrease. The secular variation presumably indicates that mass is thermally transferred from the more massive primary star to its companion at a rate of about 7.24 × 10⁻⁸ M⊙ yr−1. The period and semiamplitude of the cyclical variation are 54.5 yr and 0.0177 days, respectively, which could be produced by either a light‐time effect or a magnetic activity cycle. Our light curves are asymmetrical, with max I about 0.02–0.03 mag brighter than max II. Among possible spot models, the light variations were best‐fit by using a two‐spot model with both a cool spot and a hot spot on the secondary star. These may be formed by a combination of effects from a magnetic dynamo and mass transfer. We suggest that TU Boo is probably a triple system, consisting of a massive primary star with a spectral type of G3, a secondary component of spectral type G5–6, and a low‐mass M‐type tertiary companion with a minimum mass of about M3 = 0.34 M⊙.
Export citation and abstract BibTeX RIS
1. INTRODUCTION
TU Boo (BSD 58‐328; Vmax = +11.4; G3) was discovered to be a variable by Guthnick & Prager (1926), based on photographic plate observations, and was cataloged as a W UMa–type system. The only photoelectric light curves completed so far were made by Hoffmann (1984), wherein his observations display the conventional O'Connell effect, with max I (at phase 0.25) brighter than max II. Subsequently, Niarchos et al. (1996, hereafter NHD) analyzed Hoffmann's blue and yellow light curves and concluded that TU Boo is an A‐subtype (defined observationally by Binnendijk 1970) contact binary with photometric parameters of q = 0.498, i = 88.1°, Δ(T1–T2) = - 5 K, and f = 32%, and with a complete eclipse at the secondary minimum. In order to explain both the O'Connell effect and the small excess of light just after max I, NHD assumed a cool spot on the primary star and a hot spot near the neck of the secondary component. In addition, the same authors concluded that the orbital period of the system experienced a period shortening of 0.413 s around HJD 2,445,425.
Until now, TU Boo has been studied photometrically only this one time, and its orbital period has recently varied in a complex manner, rather than by having a sudden period jump. In this paper, we present the photometric properties of TU Boo from detailed studies of eclipse timings and light curves, based on all data collected from the literature and obtained in our new CCD photometry. Our main intention is to propose the possibility that TU Boo is a triple system, but this conclusion is not as strong as may be desired.
2. NEW OBSERVATIONS
New CCD photometric observations of TU Boo were obtained during three successive nights beginning on 24 April 2007 with a SITe 2K CCD camera and a standard Johnson BVR filter set attached to the 61 cm reflector at Sobaeksan Optical Astronomy Observatory (SOAO) in Korea. The instrument and reduction method have been described by Lee et al. (2007). A nearby star, 2MASS 14045900+2952340 (BSD 58‐328; G5), with brightness and color similar to TU Boo, was selected as a comparison star, and no peculiar light variations were detected against measurements of two nearby check stars, 2MASS 14045318+3002439 and 2MASS 14042199+3008282.
A total of 367 individual observations were obtained in the three bandpasses (123 in B, 122 in V, and 122 in R). The multicolor light curves of TU Boo are plotted in Figure 1 as the differential magnitude (i.e., variable minus comparison) versus phase. As shown in the figure, our observations are evenly distributed in phase and display the O'Connell effect for all three bandpasses.
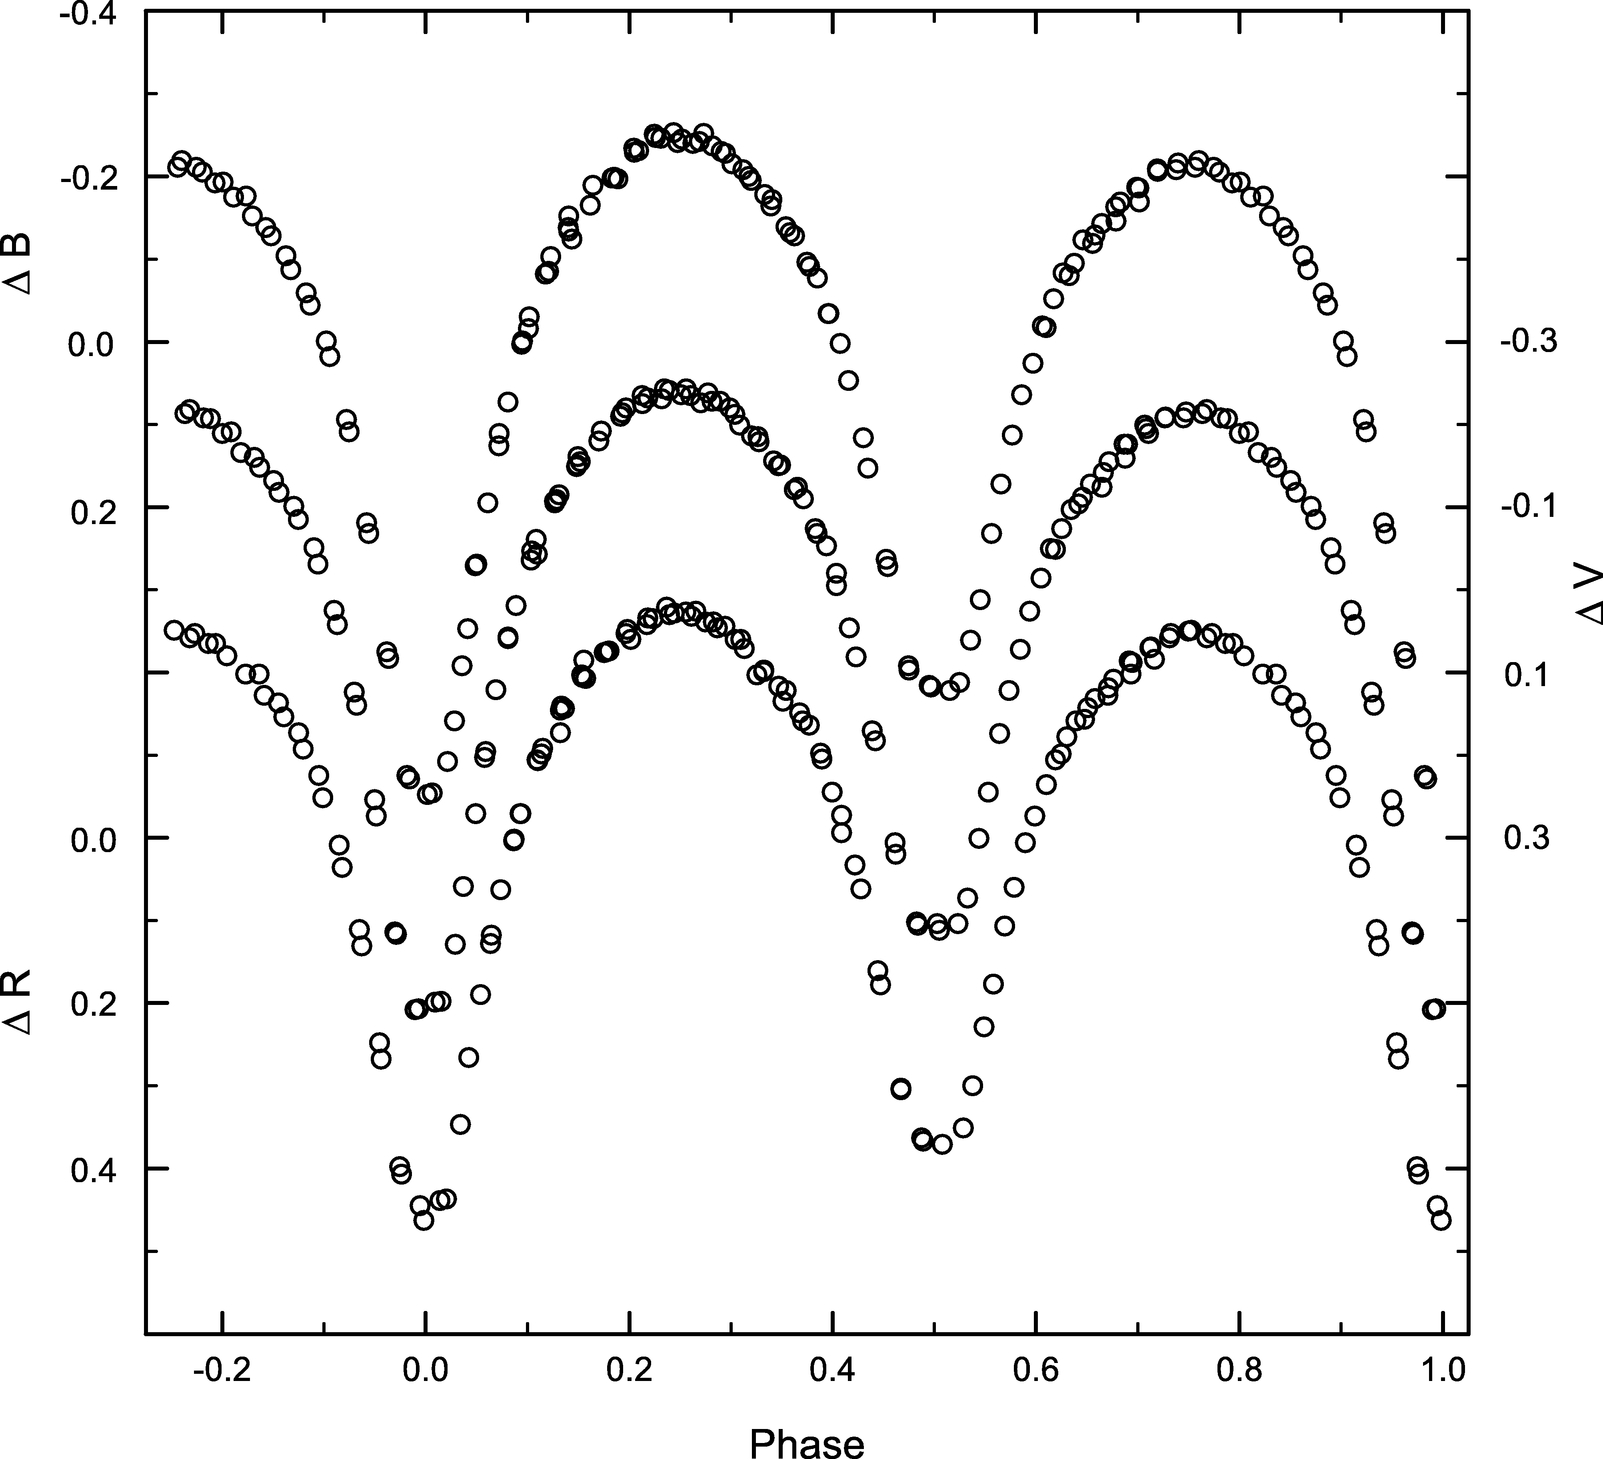
Fig. 1.— Light curves of TU Boo in the B, V, and R bandpasses defined by individual observations.
3. THE O – C VARIATION AND ITS IMPLICATIONS
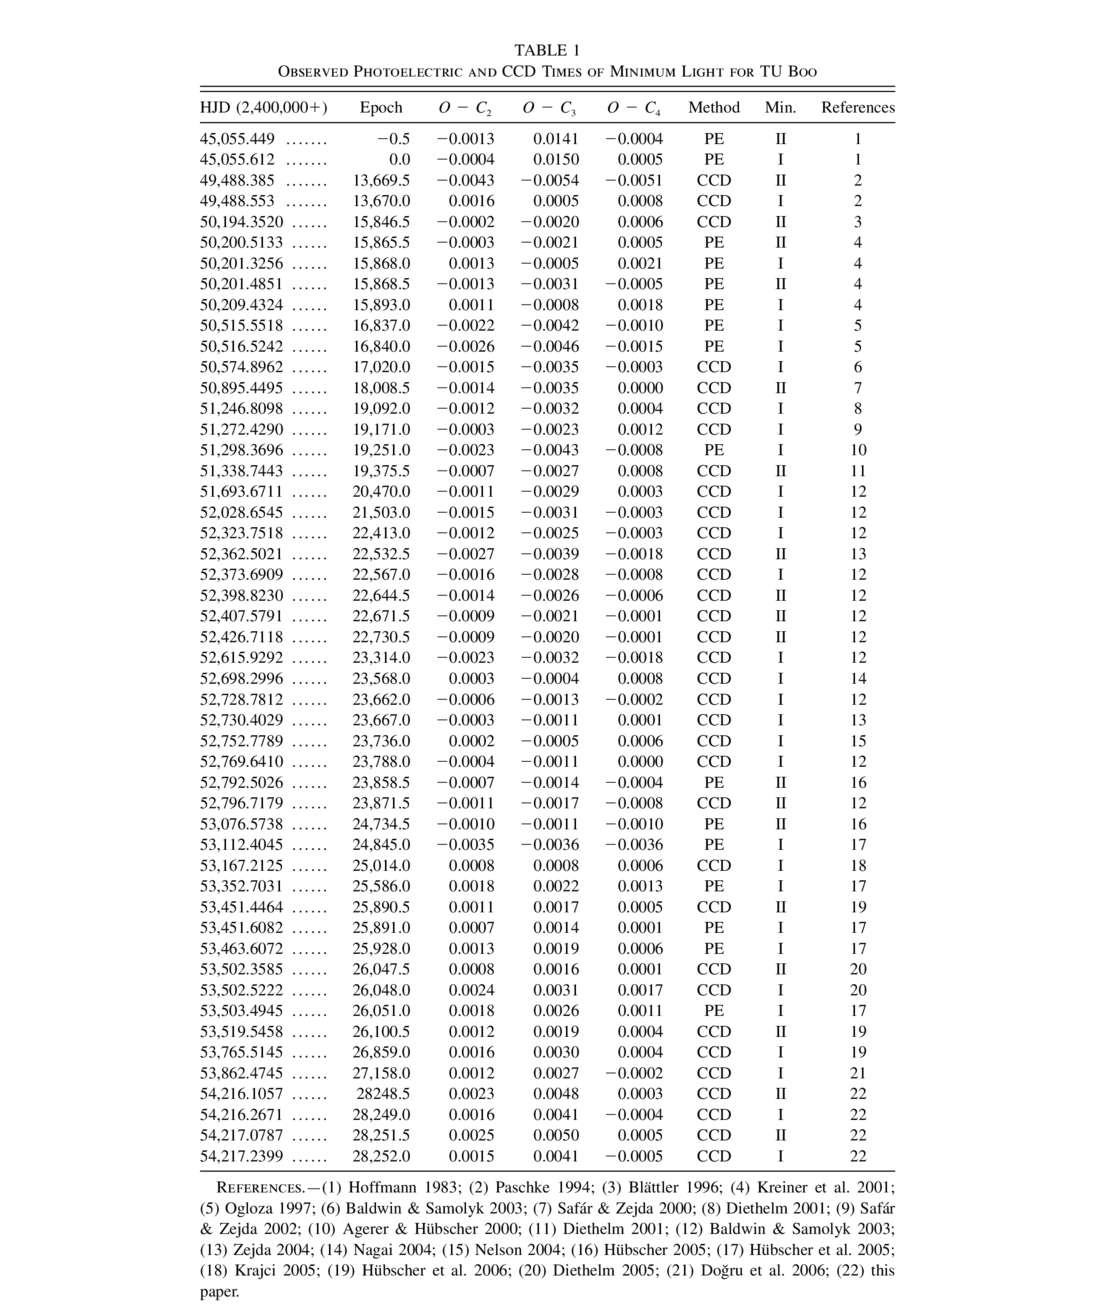
We determined four times of minimum light from our CCD observations during two primary and two secondary eclipses. These are weighted means of the timings derived by the method used in Kwee & van Woerden (1956) from the observations in each filter. For a period study of TU Boo, 349 times of minimum light (37 photographic plate, 257 visual, 5 photographic, 16 photoelectric, and 34 CCD) have been collected from the literature and our CCD measurements. Most of the eclipse timings were extracted from the database published by Kreiner et al. (2001). All available photoelectric and CCD timings are listed in Table 1.
 |
First of all, to obtain a mean light ephemeris, we applied a linear least‐squares fit to all times of minimum light and thus found an improved ephemeris, as follows:
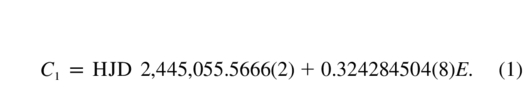
The numbers in parentheses are the 1 σ error values for the last digit of each term of the ephemeris. Because most of the timings of TU Boo have been published with no errors, the standard deviations of the scatter bands of the timing residuals were calculated to provide mean errors for the observational methods. An error for each method was assigned as follows: ±0.013 days for photographic plate, ±0.006 days for visual, ±0.003 days for photographic, and ±0.001 days for photoelectric and CCD minima. Relative weights were then scaled from the inverse squares of these values.
The resulting O - C1 diagram of TU Boo constructed with equation (1) is plotted in the top panel of Figure 2, where timings are coded by different symbols according to observational method. The integer eclipse cycle number from the ephemeris is given in the second column of Table 1. As displayed in Figure 2 and suggested by NHD, the orbital period of TU Boo seemed to experience a conspicuous period jump around cycle 0. Assuming an abrupt period decrease at about 1982 and constant periods before and after the cycle, we separately applied linear least‐squares fits to the two sections. We thus found that times of minimum light can be represented by the following light elements:
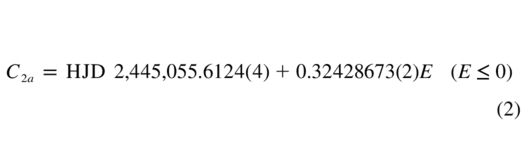
and
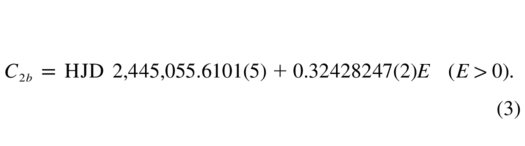
From the two equations, the putative sudden period decrease was calculated to be about ΔP = −0.37 s, which could possibly have been produced by impulsive mass ejections from one or both of the component stars. However, so far there has been no other observational evidence to support the mass‐ejection hypothesis. If the general trend of the O - C1 residuals is that of a continuous period decrease, they can be represented by a parabola. Therefore, by introducing all times of minimum light into a parabolic least‐squares fit, we obtained the following quadratic ephemeris:
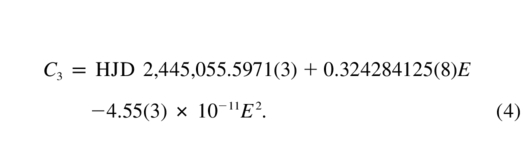

Fig. 2.— O - C diagram of TU Boo from the light elements of eq. (1). Timings are coded by different symbols according to observational method. Top: Linear fits (solid lines) to the two sections separated by a period jump around cycle 0, and the quadratic fit (dashed parabolic curve) to all the data. The inset box is drawn with only photoelectric and CCD residuals. Middle: Residuals from the linear fits of eqs. (2) and (3). Bottom: Residuals from the quadratic ephemeris (eq. [4]).
In the top panel of Figure 2, two solid lines and a dashed parabola represent the linear fits to the two partial data sets separated by the period jump, and the quadratic fit to all the data, respectively. The middle panel displays the residuals from equations (2) and (3), and the bottom panel gives the residuals from the quadratic ephemeris (eq. [4]). These appear as O - C2 and O - C3 in the third and fourth columns of Table 1, respectively. As shown in the middle and bottom panels, a few visual residuals around cycle 10,000 appear to be double‐valued, and the standard deviation (±0.009 days) among them is 1.5 times larger than the error expected for visual residuals. Although we have no plausible explanation to resolve this confusion, it is reasonable that the noise of these residuals comes from observational error rather than real changes of the period of the system. Inspecting in detail the middle and bottom panels of Figure 2, we can see an additional oscillation in the O - C2 and O - C3 residuals. Accordingly, all timings were fitted to the quadratic plus light‐time ephemeris:

(Irwin 1952, 1959), where τ3 is the light‐travel time due to a hypothetical third body, and includes five parameters (asin i', e, ω, n, and T). The Levenberg‐Marquart technique (Press et al. 1992) was used to evaluate the parameters for the light‐time orbit and secular period variation of the TU Boo system, which are summarized in Table 2. NHD's absolute dimensions (M1 = 0.97 M⊙, M2 = 0.48 M⊙, R1 = 1.05 R⊙, R2 = 0.78 R⊙, L1 = 1.12 L⊙, and L2 = 0.62 L⊙) have been used for these and subsequent calculations. The top panel of Figure 3 shows the O - C4 residuals with respect to the linear term of equation (5), where the sinusoidal and the parabolic curves represent the sum of the nonlinear terms and only the quadratic term of equation (5), respectively. The middle panel displays the light‐time orbit after subtracting the linear and quadratic terms of the equation, and the bottom panel shows the residuals from the total ephemeris, which appear as O - C4 in the fifth column of Table 1. As displayed in the figure, all times of minimum light are best‐fit by the quadratic plus light‐time ephemeris. This type of period variation occasionally appears in contact binaries and resembles those of some recently studied systems, such as RW Com (Qian 2002), V417 Aql (Qian 2003), BX Peg (Lee et al. 2004), FG Hya (Qian & Yang 2005), and AP Leo (Qian et al. 2007). The orbital period of each of the systems has varied in some combination of a long‐term period decrease and a cyclic variation, where the latter could reasonably be interpreted as either a light‐time effect due to an additional object in a close binary, or as period modulation due to a magnetic activity cycle of the solar‐type component.
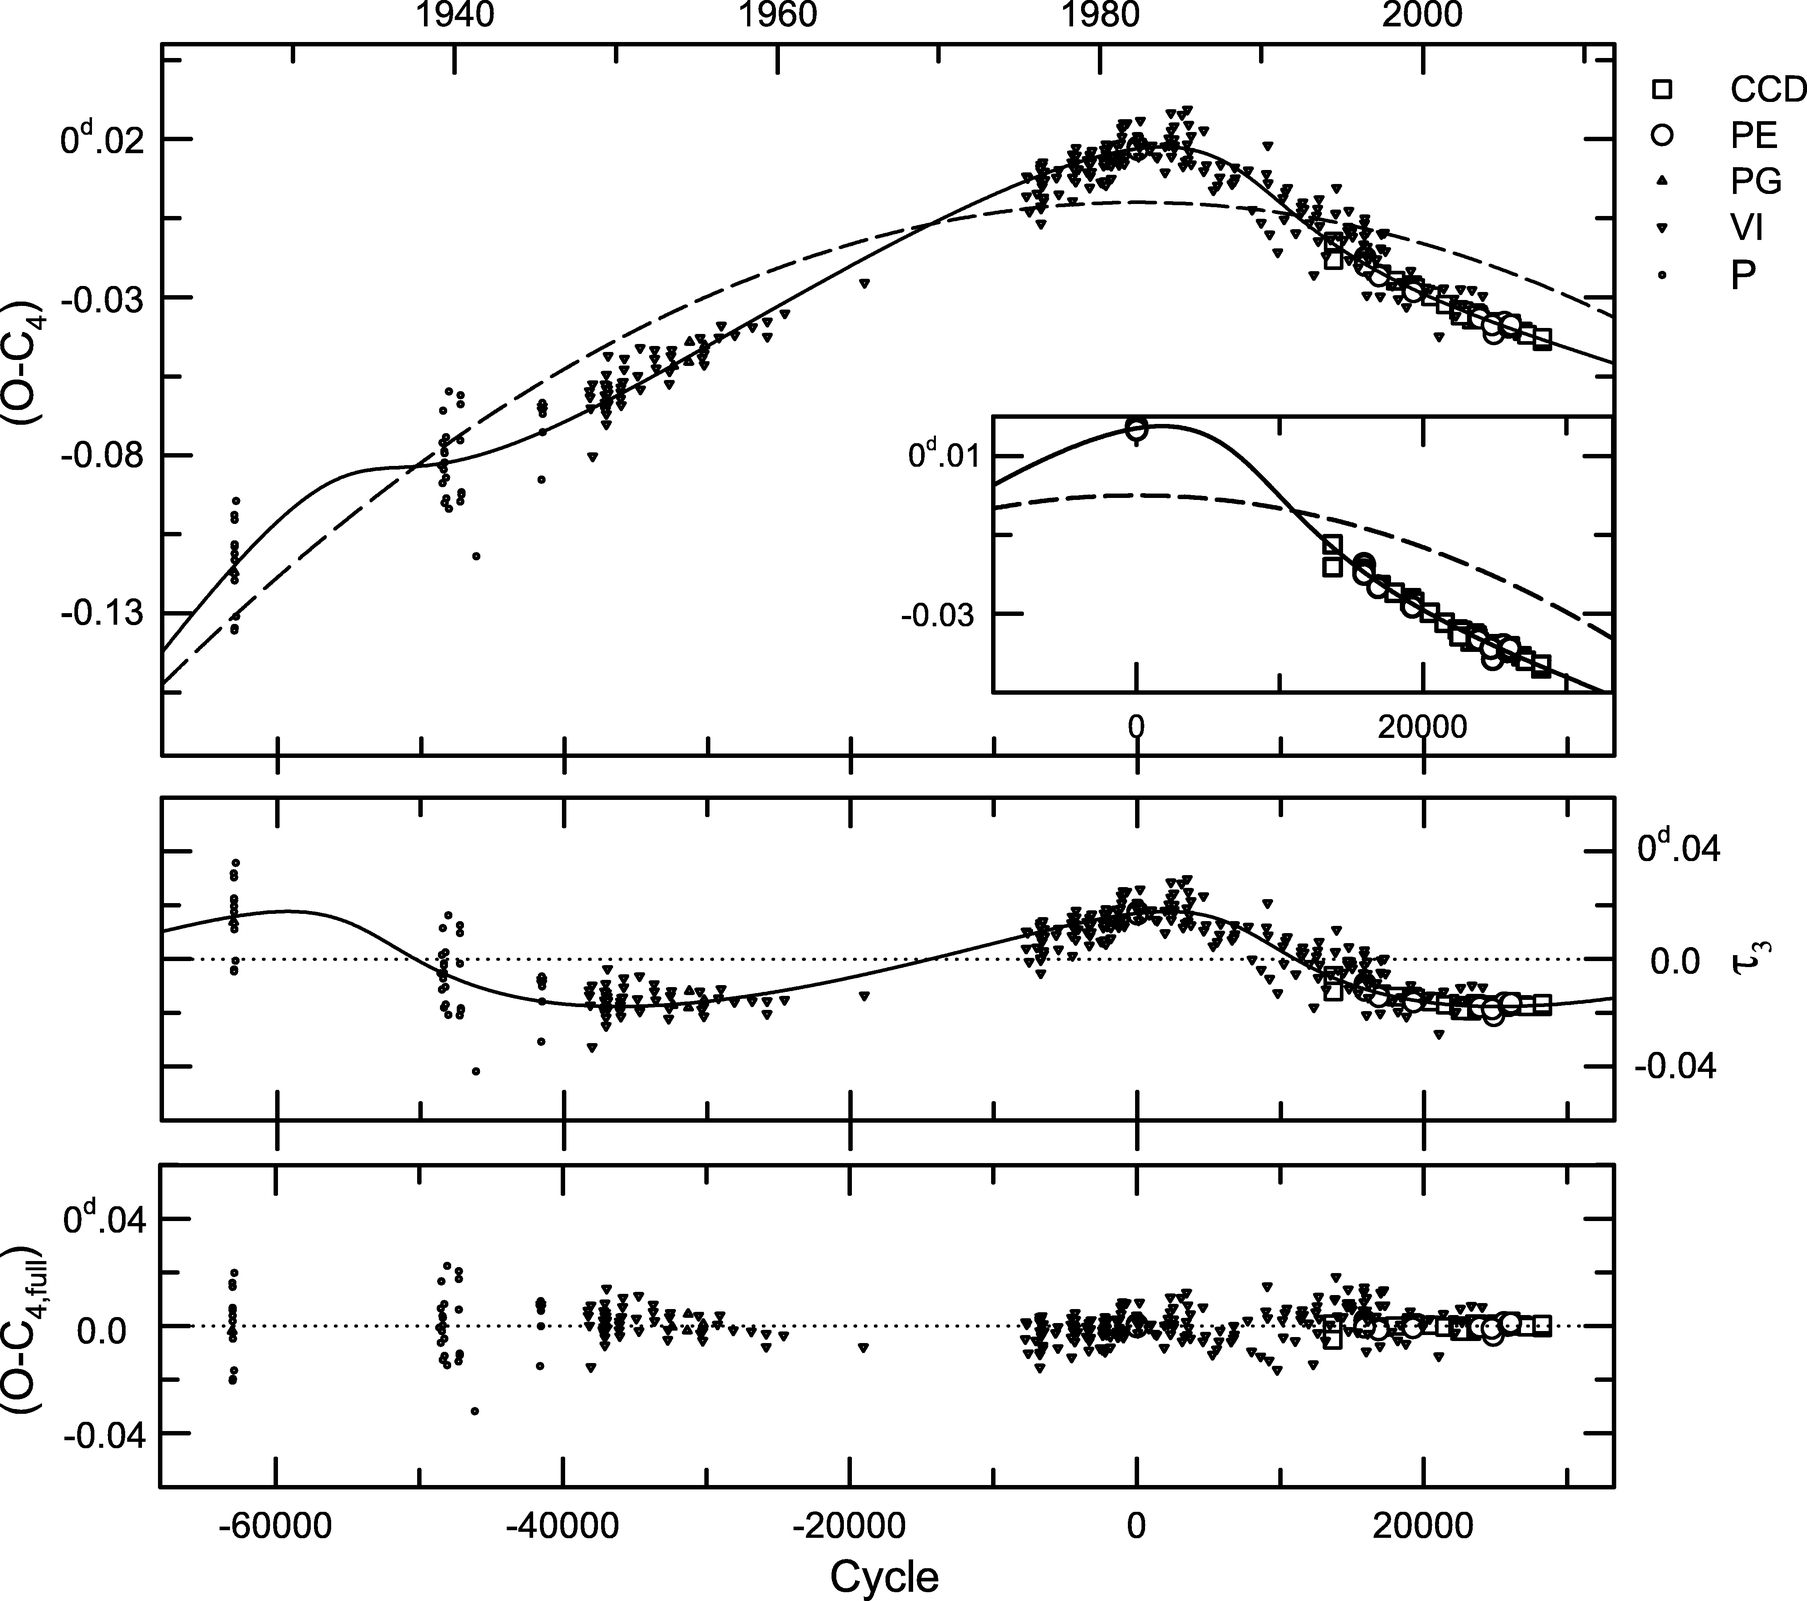
Fig. 3.— O − C4 diagram of TU Boo. Top: The sinusoidal and the parabolic curves represent the full nonlinear contribution and the quadratic term of the equation, respectively, and the inset box is drawn with only photoelectric and CCD residuals. Middle: Residuals from the linear and quadratic terms of eq. (5). Bottom: Residuals from the full ephemeris.
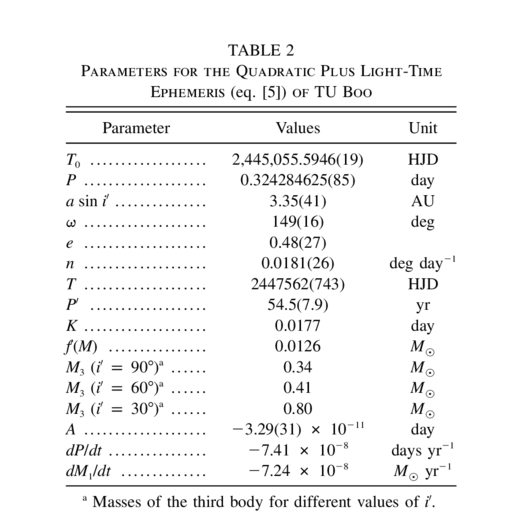 |
If the cyclical component τ3 of the period variability is produced by a tertiary companion in the TU Boo system and its orbit is coplanar with the eclipsing pair (i' = 89ˆ), the mass and radius of the object are computed to be M3 = 0.34 M⊙ and R3 = 0.35 R⊙, respectively, where the latter was obtained by means of using an empirical mass‐radius relation for low‐mass main‐sequence stars (Bayless & Orosz 2006). These values would correspond to a spectral type of M2–M3 and a bolometric luminosity of L3 = 0.02 L⊙, which contributes about 1.1% to the total light of the triple system. Another possible mechanism is a magnetic modulation due to an activity cycle in the late‐type star, as has been proposed by Applegate (1992) and later modified by Lanza et al. (1998). With the period P' and amplitude K listed in Table 2, and with the absolute dimensions of TU Boo, the model parameters for each component can be obtained from the formulae given by Applegate. The results are listed in Table 3, where the rms luminosity changes, ΔLrms, converted to magnitude scale, were obtained with equation (4) of Kim et al. (1997). The variations of the gravitational quadrupole moment ΔQ correspond to typical values for contact binaries. If Applegate's mechanism is the main cause of the cyclical variation, the light variations of the binary system should vary in phase with the period change seen in the Figure 3. However, we cannot check this possibility, because there is only one historical light curve.
 |
The quadratic term A of equation (5) represents a continuous period decrease with a rate of dP/dt = 7.41 × 10- 8 days yr−1, which may be due to conservative mass transfer from the more massive primary star to the less massive secondary component. From the masses of both component stars, we get a mass transfer rate of 7.24 × 10- 8 M⊙ yr−1. If the primary star transfers its present mass to the secondary component on a thermal timescale τth (Paczyński 1971), then τth = 2.41 × 10⁷ yr, and mass is transferred to the companion at a rate of M1/τth = 4.03 × 10- 8 M⊙ yr−1, which is very close to the value calculated from our quadratic term. The secular period decrease of TU Boo may therefore be caused by a thermal mass transfer between the components.
4. LIGHT‐CURVE ANALYSIS AND SPOT MODEL
Our light curves, like those observed in Hoffmann's (1984) observations, show that brightness varies continuously, as expected for a contact binary, and the secondary minimum in the V bandpass seems to indicate a total eclipse with a duration of about 19 minutes. This is not clear in the B and R bandpasses. If the totality is real, the discrepancies for these bandpasses might be partly caused by local photospheric inhomogeneities and/or the duty cycle of our observations, which is about 0.022P. Furthermore, our data are asymmetrical, and max I is brighter than max II by about 0.032, 0.027, and 0.021 mag for B, V, and R, respectively.
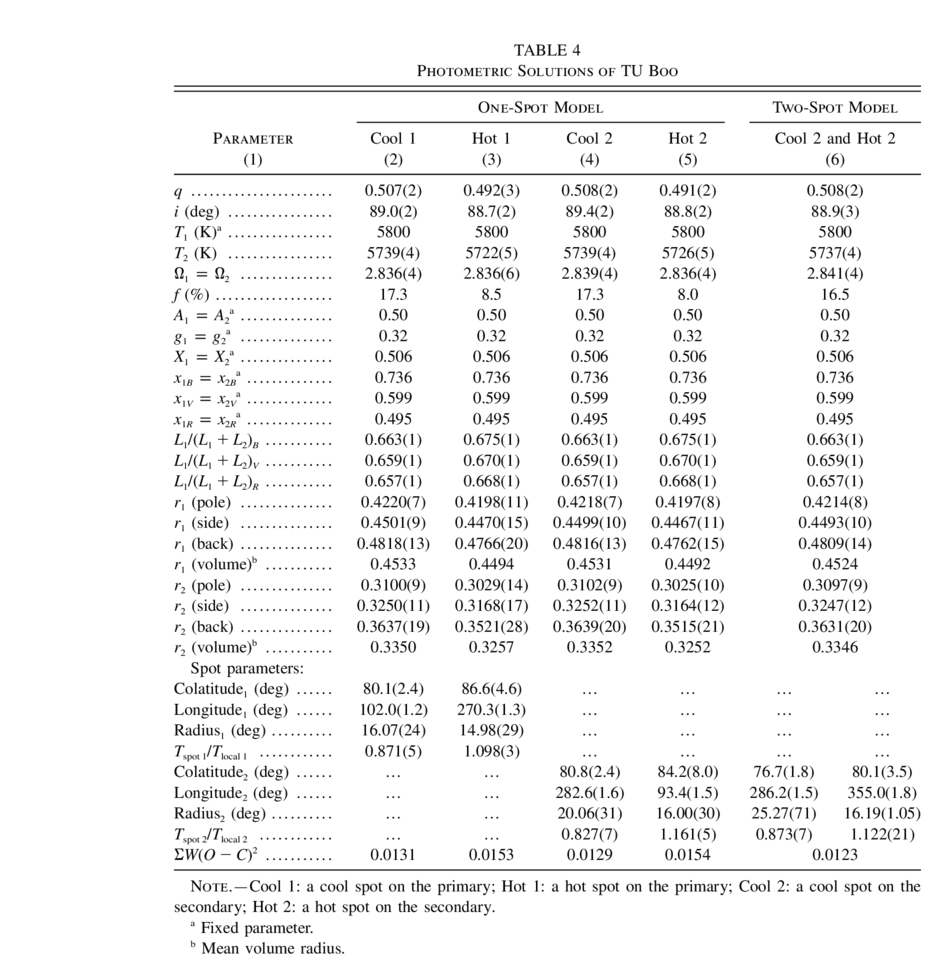
To find a unique solution for the TU Boo system, we simultaneously analyzed its BVR light curves by using the 2003 version of the Wilson‐Devinney code (Wilson & Devinney 1971). In this analysis, we assumed the surface temperature of the primary star to be T1 = 5800 K, according to its spectral type G3 and Harmanec's (1988) table, and applied contact mode 3 to all individual points. The mean light level at phase 0.25P was set to unity. Because the binary system should have a common convective envelope, as surmised from its spectral type, the light curves were analyzed in a manner similar to that of the cool contact binary BX Peg (Lee et al. 2004). In Table 4, parentheses signify adjusted parameters, and the subscripts 1 and 2 refer to the stars being eclipsed at primary and secondary minima, respectively.
 |
Although a photometric solution of TU Boo was reported by NHD from the analysis of Hoffmann's light curves, a spectroscopic mass ratio has not yet been established. Thus, we used the so‐called q‐search method for the computation of photometric solutions (Kim et al. 2004). In this initializing process, we did not consider either a third light source ℓ3 or spots, and the method of multiple subsets (Wilson & Biermann 1976) was employed to ensure the stability of our solution. From the q‐search results over the range of 0.3≤q≤3.0, we found an acceptable solution near q = 0.50, which indicates that TU Boo is an A‐subtype contact binary. To obtain the final unspotted solution, we took q as an adjustable parameter. The residuals from the fitting are plotted in the leftmost panels of Figure 4.
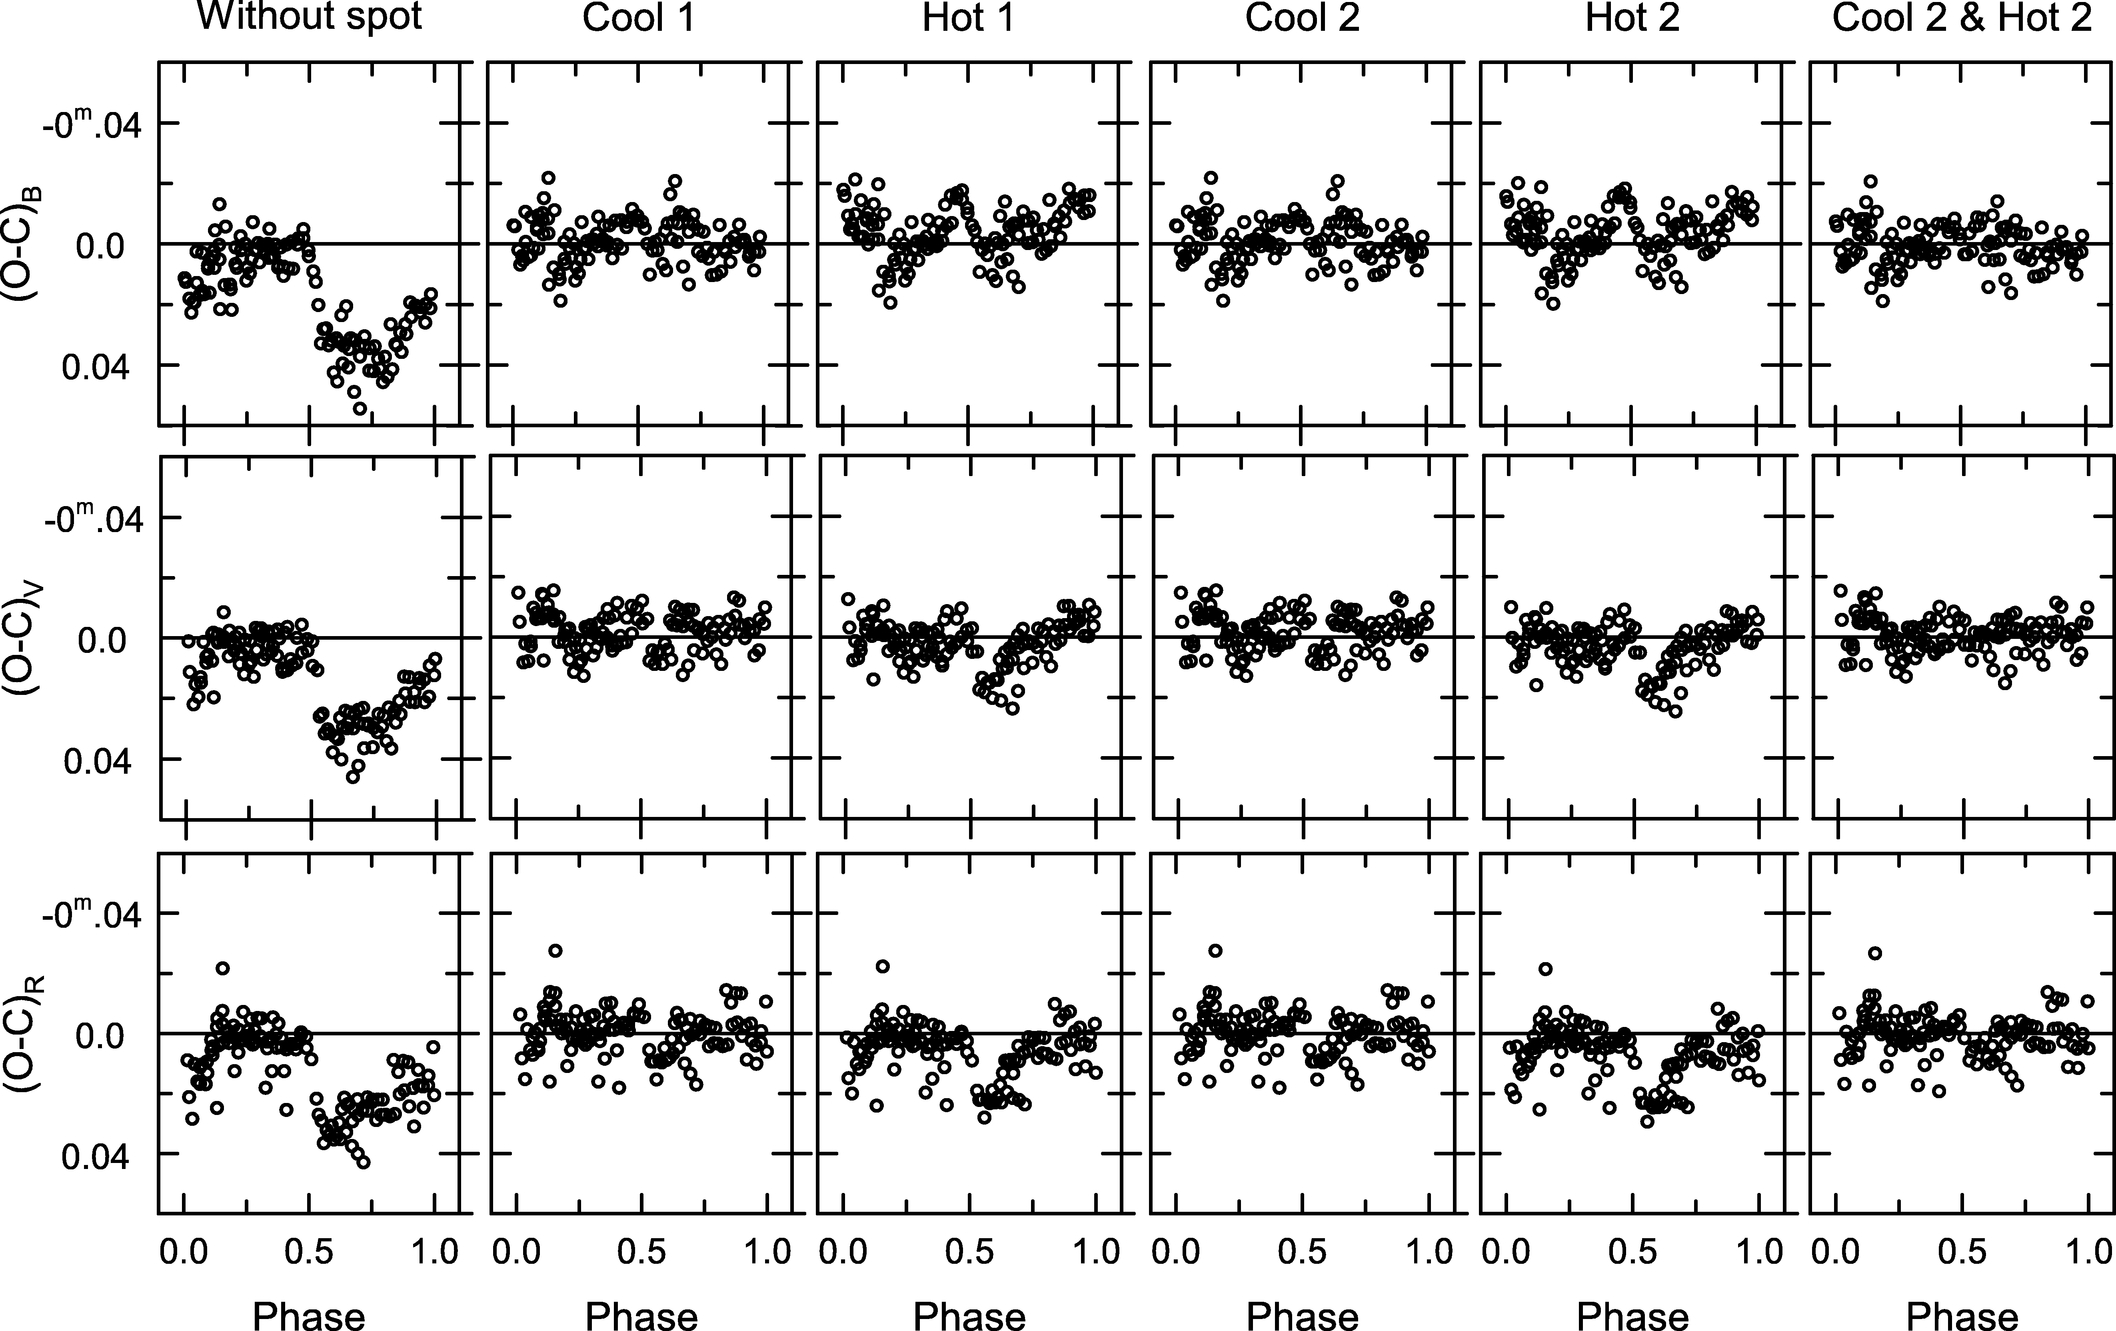
Fig. 4.— Residuals in the B, V, and R bandpasses corresponding to our binary models. See text for details.
As can be seen from these panels, the initial model light curves do not fit the observed ones well at all. In contact binaries, nonmodeled light might be produced by a magnetic cool spot on a deeply convecting component (Lee et al. 2004), or by a hot spot due to impact from mass transfer between the components (Lee et al. 2006). Thus, we reanalyzed our light curves, incorporating model spots. There is at present no way to know which mechanism is more efficient in creating light‐curve asymmetries, other than by complete light‐curve analysis. First, we separately tested a hot and a cool spot on each component. The results are given in columns (2)–(5) of Table 4, together with the spot parameters, and the residuals from the one‐spot models are plotted in the second to the fifth columns of panels in Figure 4. From the table and figure, we can see that the cool‐spot models (labeled as Cool 1 and Cool 2) give smaller values of ΣW(O - C)2 and a better fit than do the hot‐spot models (labeled Hot 1 and Hot 2) and greatly improve the light‐curve fitting. It is not easy to discriminate between the cool‐spot models using the light‐curve residuals, and even these models do not fit the secondary minima quite well enough. Accordingly, we examined a total of eight two‐spot models: a cool spot on each of the component stars, and a hot or cool spot on each component star. The final result is listed in the sixth column of Table 4, and the residuals from the chosen binary model are plotted in the rightmost panels of Figure 4. The light variations of TU Boo are best‐fit by the simultaneous existence of a cool spot and a hot spot on the secondary star. Separate trials for the other spot configurations were not as successful as this two‐spot model.
The results from the new light curves indicate that TU Boo is a totally eclipsing A‐subtype overcontact binary with a moderate fill‐out factor of about 17%, and with a small temperature difference of Δ(T1–T2) = + 63 K. Most of NHD's parameters from Hoffmann's data are in satisfactory accord with these new ones, but their fill‐out factor of 32% is about 2 times larger than ours. It is unreasonable to suppose that the fill‐out factor of TU Boo has become so much smaller with time over only about 20 years. After all, the orbital period of the system has experienced a continuous period decrease, which leads to orbital shrinking, and thus naively the fill‐out factor should have increased with time. The difference in the factors is most likely due to some unknown correlation among the binary parameters, or to the larger noise levels in the older data.
The unspotted q‐search results could have been affected by the asymmetries of the light curves, leading to a false initial value of q. Hence, we conducted a new q‐search procedure by considering a single cool spot on the secondary star. The results were very similar to the unperturbed q‐search results. Finally, before and after spot parameters were evaluated, which included the q‐search procedures, we looked for a possible third light source ℓ3, as suggested by our period study, but found that the parameter remains indistinguishable from zero within its error. Because as mentioned in § 3, any hypothetical third body contributes very little to the total light of the TU Boo system, and because the light curves are affected by spot activity, the seeming absence of a third light is not surprising, and its existence cannot be ruled out.
5. SUMMARY AND DISCUSSION
In this paper, we have presented photometric properties of TU Boo from the analysis of the O - C diagram and new BVR light curves. The findings from this work can be summarized as follows:
- 1.From a detailed study of the O - C diagram, we found that the orbital period of TU Boo has varied in a quasi‐sinusoidal way superposed on a downward parabolic variation, rather than by an abrupt period jump or by only a continuous period decrease. The secular variation indicates a continuous period decrease with a rate of dP/dt = 7.41 × 10- 8 days yr−1 and can be interpreted to mean that mass is being thermally transferred from the more massive primary star to the cooler secondary component at a rate of about 7.24 × 10- 8 M⊙ yr−1.
- 2.The period and semiamplitude of the sinusoidal component of the O - C residuals are 54.5 yr and 0.0177 days, respectively. These may be produced by a light‐time effect due to a third companion gravitationally bound to the TU Boo system, or by a magnetic period modulation of at least one component star. However, it is unclear how the Applegate mechanism works in contact systems, and there is no independent photometric evidence to support the idea.
- 3.New CCD photometry indicates that the light curves of TU Boo are asymmetrical and display the conventional O'Connell effect for all three bandpasses, with max I being about 0.0–0.03 mag brighter than max II. The light variations were best‐fit by using a two‐spot model with both a cool spot and a hot spot on the secondary star. We think that the cool spot may be produced by magnetic dynamo‐related activity, from the fact that the system has a rapid rotation and a common convective envelope, while the hot spot may be caused by impact from mass transfer between the components.
- 4.Our study of the orbital period and light curves of TU Boo represent it as an A‐subtype overcontact binary with a possible low‐mass M‐type tertiary companion. The more massive primary star has a spectral type of G3, and the less massive secondary component a spectral type of G5–G6.
It is uncommon to find hot and cool spots so close together on a binary star component, and also so close to the neck of the common convective envelope. There is a temptation to speculate that the kinetic energy dumped into the common envelope by the mass transfer has somehow caused the spot display. Some of the impact energy can be dissipated as heat so that the hot spot is formed, but some of it would have to be transmuted to magnetic energy, thus cooling the environment so that a cool spot is formed nearby. Even if the physics of such processes could be worked out consistently, an explanation would still be required to identify why a pair of closely adjoining spots is not seen at this favored location in most overcontact cool binaries. More systematic and continuous high‐resolution photometry and spectroscopy will help to identify and better understand the period and light variations of the TU Boo system and should also lead to more detailed properties, such as the absolute dimensions and evolutionary status of the system.
The authors wish to thank Dr. Robert H. Koch for some helpful suggestions and comments on the draft version of the manuscript. We also thank Prof. Chun‐Hwey Kim for his help using the O - C database of eclipsing binaries. We have used the SIMBAD database maintained at CDS many times, and we appreciate its availability. This work was supported by Korea Astronomy and Space Science Institute (KASI).