

Abstract
The results of the operation of a wavefront correction system based on a deformable bimorph mirror of the PEARL subpetawatt laser facility are presented. An improvement in the quality of focusing of laser radiation, which led to an increase in the Strehl ratio from 0.3 to 0.6, is demonstrated. The features of the compensation for phase distortions of the wavefront in the case of a low pulse repetition rate, as well as the correct allowance for the noise of the CCD camera when calculating the Strehl ratio are investigated.
Export citation and abstract BibTeX RIS
1. Introduction
Achieving the limiting values of laser radiation intensity is impossible without careful control and correction of its wavefront in a laser system. The effect of wavefront distortions on laser performance can be due to various mechanisms. For example, aberrations in a nanosecond laser can lead to a decrease in the conversion coefficient to the second harmonic or to blocking of spatial filters due to ablation of the diaphragm material [1]. Phase distortions at the input to the laser pulse compressor lead to complex chromatic effects manifested in the spatial inhomogeneity of the pulse duration, to residual angular chirps and time modulations [2 – 4]. In this regard, adaptive systems for wavefront correction based on reflecting mirrors with controlled surface geometry are standard equipment for lasers [5 – 10].
Wavefront aberrations can be conditionally divided into static (caused by imperfect optical elements) and dynamic (caused by air flows and changes in the thermal regime of laser operation) ones. The specific frequencies of the adaptive system should be higher than the characteristic frequencies of dynamic aberrations. Hysteresis and nonlinearity of a deformable mirror in most cases make it difficult to calibrate it absolutely; therefore, compensation can only occur iteratively, with the use of feedback implemented through a wavefront sensor (WFS). However, pre-calibration allows one to minimise the number of required steps.
Whereas the problem of compensating for dynamic aberrations is somehow solved by increasing the speed of the system, the compensation for distortions for lasers with a low pulse repetition rate requires a special approach, since feedback can be organised only with a delay equal to the time between shots, or using low-power tuning regimes with a high pulse repetition rate. In the latter case, the issue about the differences in the wavefront in the tuning and full energy remains unsolved.
This paper presents the results of wavefront optimisation using an adaptive wavefront correction system at the output of the PEARL laser system [11]. A deformable bimorph mirror and a Shack – Hartmann WFS were used. The efficiency of the system was investigated in various regimes of laser operation.
2. Experimental setup
The studies were carried out on the PEARL laser facility, which is topologically a three-stage parametric amplifier of chirped pulses based on KD*P crystals. The front end of the system for the signal radiation was a Ti : sapphire mode-locked laser operating at the edge of the gain spectrum of the active medium. In addition to the single-shot operation regime (a 50 fs pulse with an energy of ∼20 J and a repetition rate of 1 pulse per 20 min), two more tuning regimes were used: 'frequency' regime (50 fs, ∼10 mJ, 1 Hz) and 'quasi-continuous-wave' regime (50 fs, 500 pJ, 70 MHz). In all regimes, the radiation passed along the same path; in the quasi-continuous-wave regime, there was no pumping of parametric amplifiers, and in the frequency regime, there was no pumping of the final stage. The quasi-continuous-wave regime provided the maximum possible aperture, limited by the geometric size of the elements of the optical path, and demonstrated the most uniform transverse profile of the radiation beam intensity among all the regimes presented. The spectra of radiation pulses in all regimes were approximately the same. The schematic of the experiment is shown in Fig. 1.
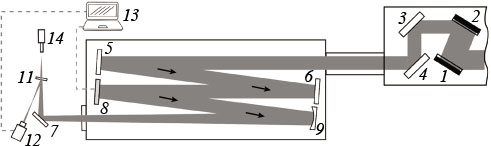
Figure 1. Experimental setup: ( 1, 2 ) compressor output gratings; ( 3, 4 ) output mirrors of the compressor; ( 5, 6, 7 ) uncoated glass plates with a frosted back surface; ( 8 ) deformable mirror; ( 9 ) spherical mirror; ( 10 ) exit window of the vacuum chamber; ( 11 ) beam splitter; ( 12 ) Shack – Hartmann WFS; ( 13 ) control unit for mirror ( 8 ); ( 14 ) digital CCD camera.
Download figure:
Standard imageAfter the PEARL laser compressor, the beam was directed into a vacuum chamber, in which it was reflected from attenuating uncoated glass plates ( 5 ) and ( 6 ) (a pair of plates attenuated the intensity by a factor of 590), a deformable mirror ( 8 ), and a spherical focusing mirror ( 9 ) with a focal length f = 5000 mm. The radiation was incident on the spherical mirror ( 9 ) at an angle of 4.5°, which introduced additional astigmatism with an amplitude of 5 μm.
A mirror focusing system is used to eliminate chromatic aberrations. Radiation was outcoupled from the vacuum volume through a glass window ( 10 ), and was further attenuated upon reflections from a plate ( 7 ) and a beam splitter ( 11 ). At a maximum radiation power, the B-integral, which determines the nonlinear phase incursion on the elements of the optical circuit, did not exceed 0.1, which guaranteed the absence of significant nonlinear distortions of the wavefront. Part of the beam that passed through the beam splitter was focused on the matrix of a digital CCD camera.
Part of the beam reflected from the beam splitter ( 11 ) was incident on a WFS ( 12 ), on which an achromatic lens was mounted (not shown in the figure), forming a telescope with a spherical mirror, which transferred the image of the deformable mirror onto the microlens array of a sensor ( 12 ) with a 20-fold demagnification. When switching the laser operating regimes and optimising the dynamic range, aberration-free neutral attenuating filters were placed in front of the cameras.
The WFS is a one-inch CMOS camera (2048 × 2048 pixels) with a built-in microlens raster with f = 3.2 mm and a pitch of 136 μm. The raster divides the wavefront incident on the sensor ( 12 ) into sub-apertures (more than 6500 on the entire sensor aperture) and forms an image of a two-dimensional grid of focal spots (hartmannogram) on the receiving matrix of the sensor [12]. The position of the centre of gravity of each spot is determined by the local slope of the wavefront averaged over the corresponding subaperture. A detailed description of the algorithm for reconstructing the wavefront profile is given in [13]. The result of the reconstruction algorithm is the difference of the radiation wavefront from the reference one, which is found by individual calibration of each sensor.
A bimorph deformable mirror is a three-layer plate consisting of a polished optical glass substrate with a reflective coating and two piezoceramic disks with conductive surfaces [14]. All mirror components are rigidly glued together (Fig. 2). Due to the inverse piezoelectric effect, in the presence of an applied electric field, longitudinal compression/tension of the piezoceramics occurs in piezo disks, which leads to deformation (bending) of the reflecting surface of the deformable mirror. An internal piezo disk with a solid electrode serves to form the overall curvature of the mirror surface. On the outer surface of the second disk, electrodes are placed in the form of galvanically isolated segments, with the help of which local deformations are formed [15]. When the control voltages are applied to a group of electrodes of a segmented piezodisk, the deformation of the mirror surface is a superposition of local deformations. We used a 96-electrode bimorph mirror 240 mm in diameter with a maximum surface deformation of more than 100 μm (defocusing) in the control voltage range from –300 to +600 V (the first resonance frequency ∼550 Hz, hysteresis 12 %). The reflective coating is a multilayer dielectric one with a reflection coefficient of at least 99.8 % in the spectral range of 860 – 960 nm.
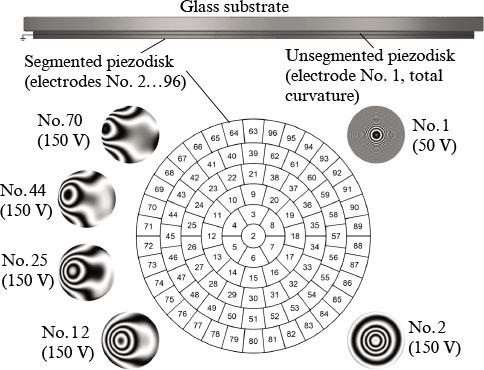
Figure 2. Schematic structure of a bimorph mirror, a diagram of the electrodes of a segmented piezodisk and examples of the response functions of some electrodes (the phase difference between neighbour fringes is λ/2).
Download figure:
Standard imageIn the optical scheme (see Fig. 1), there are two waists of the laser beam: in the plane of the CCD camera and before the WFS. The quality of focusing in them may vary due to aberrations introduced when radiation passes through the beam splitter and is reflected from it. Such aberrations are commonly called difference aberrations. If the difference aberrations are significant, then the optimisation of the intensity distributions is possible only for one of the waists, which we will call the aim waist. In our case, the aim waist is in the plane of the CCD camera 14. Optimal focusing will be achieved if the WFS readings differ from the reference profile by the magnitude of the difference aberrations taken with the opposite sign. The presence of two waists in the channel with high-power radiation and in the diagnostic channel is typical of ultra-high-power laser systems, as is the presence of difference aberrations. As a rule, the target waist is the one, where the radiation interacts with the target.
3. Adaptive wavefront correction system
Phase distortion compensation is preceded by a routine deformable mirror calibration procedure, during which the response functions – phase distortions produced by a unit voltage – are measured sequentially for all mirror electrodes. The response functions (examples are shown in Fig. 2) correspond to double deformations of the mirror surface. After that, phase conjugation and elimination of difference aberrations are carried out.
3.1. Phase conjugation
The standard procedure for wavefront correction by the phase conjugation method [13, 16] is implemented as follows. The phase distortions measured by the WFS are expanded in a series in the measured response functions of the deformed mirror. The expansion coefficients are the values of the control voltages at the mirror electrodes. Due to the hysteresis and nonlinearity of the mirror response functions, full compensation in a single step is difficult and the optimal correction is achieved in three to four iterations. The considered adaptive system is capable of performing correction steps with feedback at a frequency of at least 20 Hz, limited by the rate of image capturing and processing with a WFS, while the deformable mirror itself processes control voltages in a frequency band up to 400 Hz.
The efficiency of the phase distortion correction is estimated through the residual, i.e. the deviation of the measured two-dimensional phase profile from the reference one. For this purpose, it is convenient to use the standard deviation σ and/or the difference between its maximum and minimum values. In the case of correct allowance for the difference distortions and uniform filling of the amplitude profile of the laser beam, the residual is unambiguously related to the Strehl ratio at the target focusing point. In particular, if the Maréchal criterion (σ < λ/14) is satisfied, then the Strehl ratio S will exceed 0.8 [17].
For the quasi-continuous-wave regime of the PEARL facility with the correction enabled, the typical values of the residual σ were no larger than λ/20. When the correction was turned off while maintaining the voltages on the electrodes of the deformable mirror, the discrepancy increased with time due to the contribution of dynamic aberrations. In addition, during the times more than half an hour the effects associated with the relaxation of the shape of the deformable mirror itself could be relevant. Note that the frequency of the adaptive correction system (20 Hz) is usually sufficient to correct aberrations caused by air currents in the laboratory. However, in frequency (1 Hz) and single-shot regimes, the compensation efficiency is fundamentally reduced due to the impossibility of compensating for dynamic aberrations.
3.2. Differential aberration elimination
The WFS measures the change in the wavefront relative to the reference phase profile. The presence of difference aberrations leads to the fact that even full compensation for wavefront inhomogeneities in the plane of the sensor does not guarantee perfect focusing at the target point, and vice versa, with perfect focusing at the target point, the WFS will show residual deviations of the phase profile from the reference one. For a specific system, differential aberrations can be accounted for by redefining the reference phase profile. To this end, the focal spot must be optimised based on additional measurements that can be taken with an auxiliary WFS installed immediately behind the target focal point. In the case when it is difficult to place the sensor in the waist, direct methods of focal spot optimisation are used (see Appendix 1). Direct optimisation of the focal spot is inevitable if the reference phase front for the WFS is not determined.
Note that the possibility of redefining the reference phase profile opens up additional experimental possibilities, because the WFS, even being in the aberration diagnostic path and at a sufficient distance, can be recalibrated in such a way as to diagnose the focusing quality at the target point. This reduces the requirements for both aberration-free diagnostic tract and aberrations in the focusing system. In addition, this approach, with certain limitations, makes it possible to measure the wavefront of high-power radiation in a single-shot regime. These limitations relate primarily to the need to transfer the image of the deformable mirror to the WFS plane and to the accuracy of redefining the reference front for radiation in a single-shot regime, taking into account its high intensity, low pulse repetition rate, and possible variations in filling the near-field zone of laser radiation.
4. Discussion of experimental results
For experiments aimed at achieving the maximum peak intensity of laser radiation, the simplest and most natural estimate of the efficiency of compensation for aberrations is the Strehl ratio S. It is defined as a ratio of the energy density on the beam axis in the waist to the maximum possible energy density for the given distribution in the near field, assuming a perfectly flat phase front and ideally focusing optics. The difference between S and unity indicates a decrease in the energy density in the waist due to wavefront aberrations.
The result of calculating S from the experimentally obtained energy density distribution in the focal plane substantially depends on the CCD matrix noise amplitude. To increase the reliability of determining S, we used noise reduction algorithms based on Fourier filtering (see Appendix 2). The use of these algorithms allowed correct comparison of S values obtained with different cameras, for different regimes and at different pulse energies and spatial profiles of laser radiation intensity. In addition, the signal-to-noise ratio was maximised as much as possible by choosing aberration-free neutral optical filters installed in front of the WFS and CCD camera.
Without adaptive correction of the wavefront, S = 0.5 was obtained in the quasi-continuous-wave regime, and S = 0.3 in a single-shot regime. It is important to note that astigmatism was compensated for by adjusting the position and orientation of the optical elements, in particular the focusing system.
The use of the adaptive system allowed increasing the maximum values of the Strehl ratio up to S = 0.72 for the quasi-continuous-wave regime, up to S = 0.7 for the frequency regime, and up to S = 0.66 for the single-shot regime. We associate the residual beam aberrations, manifested in the difference of S from 1, with inaccuracies in considering the difference distortions. In different operation regimes of the laser system, the Strehl ratio has different values, which is explained by the differences in the near-field energy distributions in the presence of residual aberrations (including chromatic aberrations). Figures 3 and 4 show the experimentally obtained distributions of the intensity and radiation energy flux density in the near-field and far-field zones in the quasi-continuous-wave and single-shot regimes.
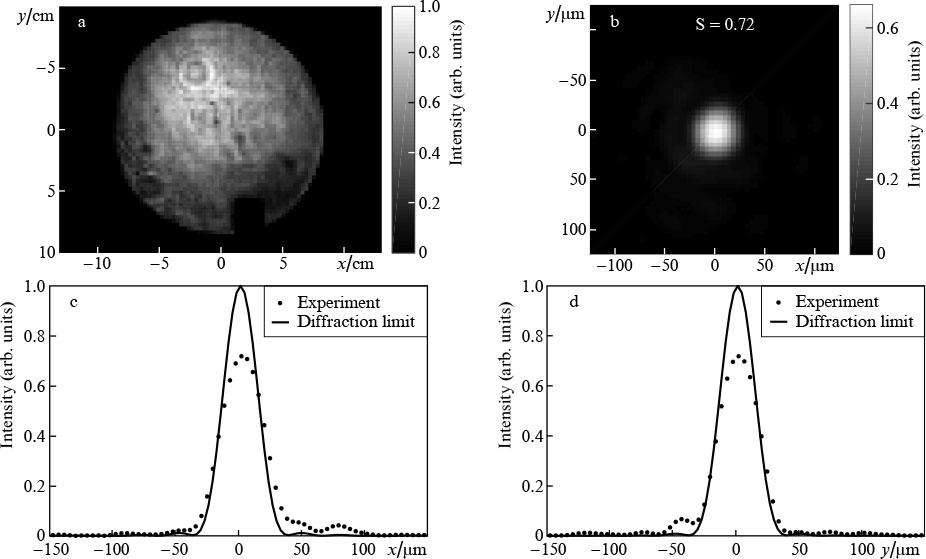
Figure 3. Normalised distributions of radiation intensity in (a) the near-field and (b) far-field zones in the quasi-continuous-wave regime when focusing with a mirror with f = 5 m, as well as (c) horizontal and (d) vertical cross sections of distributions in the far-field zone. For this measurement, S = 0.72. The rectangular 'notch' in the lower part of the aperture is a shadow from the diagnostic mirror.
Download figure:
Standard image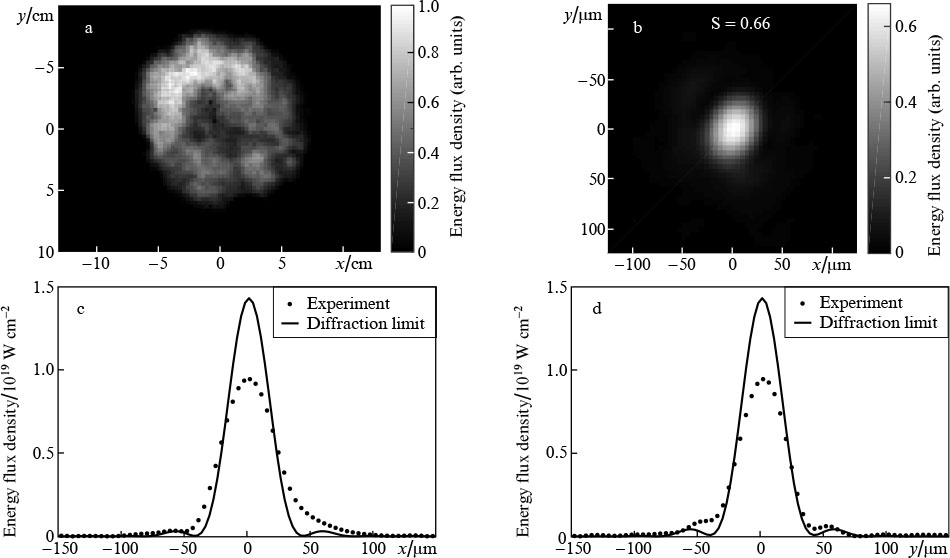
Figure 4. Normalised distributions of the radiation energy flux density in (a) the near-field and (b) far-field zones in a single-shot regime at a pulse energy of 7 J, its duration of 50 fs and focusing by a mirror with f = 5 m, as well as (c) horizontal and (d) vertical cross sections of distributions in the far-field zone. For this measurement, S = 0.66.
Download figure:
Standard imageWe investigated two ways to achieve the maximum Strehl ratio in a single-shot regime: phase conjugation in the frequency regime and phase conjugation in a single-shot regime. The advantage of the first option is the high pulse repetition rate, and the disadvantage is that both the phase and the amplitude differences between the radiation beams in these two regimes are not taken into account. At first glance, these differences are not so great, since in both cases, the beam travels the same path, and the only difference is the absence or presence of a pump beam in the final parametric amplifier.
Figure 5 shows the values of S and σ for the implementation of phase conjugation in the frequency regime, which was carried out between successive single shots. When operating in a single-shot regime, phase conjugation was not applied, and the voltage at the control electrodes of the deformable mirror remained unchanged. The frequency values were obtained by averaging over 60 realisations 1 – 2 min before a single shot. Figure 6 shows similar data for a series in which phase conjugation was carried out in a single-shot regime; measurements in the frequency regime were not used for phase conjugation. In order to correct the phase, the most successful shots were selected (marked with vertical dashed lines), for which the filling of the near zone was closest to expected. The maximum Strehl ratio for a single-shot regime was 0.66.
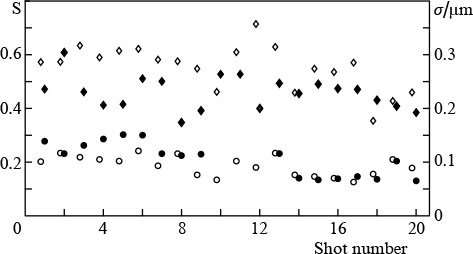
Figure 5. Experimental dependences of σ (circles) and S (diamonds) in single-shot (filled symbols) and frequency (open symbols) regimes, obtained at close times (up to 5 min) with compensation in the frequency regime. The values for the frequency regime were obtained by averaging over 60 realisations; their scatter within the series is ∼20 %.
Download figure:
Standard image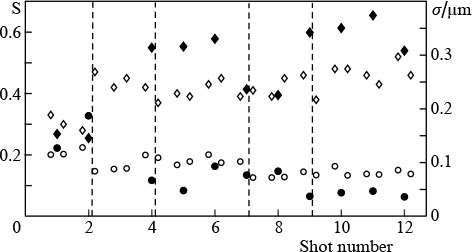
Figure 6. Experimental dependences of σ (circles) and S (diamonds) in single-shot (filled symbols) and frequency (open symbols) regimes, obtained at close times (1 – 2 min) with correction in a single-shot regime. The vertical lines mark shots (pulses), based on the measurement of the wave fronts the correction of which took place.
Download figure:
Standard imageIt can be seen from Figs 5 and 6 that a greater (by about 20 %) Strehl ratio always corresponds to the regime in which phase conjugation was carried out. Thus, we have shown that changes in the wavefront accumulated in 20 min between single shots affect the quality of the adaptive optics operation less than the differences between the beams in the frequency and single-shot regimes. The peak radiation intensity at the focus depends not only on S, but also on the distribution in the near-field zone, focusing sharpness, and pulse duration. For a PEARL laser, when the radiation is focused by a parabolic mirror with f = 32 cm (relative aperture f/2), pulse duration 50 fs, energy 20 J, and S = 0.6, the intensity at the focus will be 6 × 10²¹ W cm−2.
5. Conclusions
The use of the adaptive wavefront correction system in the PEARL laser facility made it possible to increase the Strehl ratio from 0.3 (±10 %) to 0.6 (±10 %), i.e., to double the radiation intensity at the focus up to 5(±1) × 1021 W cm−2 when focusing by a parabolic mirror with a relative aperture f/2.
Experiments have shown that for feedback in the wavefront correction system, it is most expedient to use a wavefront measured directly in a single-shot regime, despite the long (20 min) time between shots. Using the wavefront measured between shots by means of the tuning regimes leads to worse results, i.e. the Strehl ratio turns out to be reduced by about 20 %. A separate approach to wavefront correction is also required for systems with self-phase modulation of radiation, e.g., using the plasma mirror technology [18], second harmonic generation [19], manipulations with the polarisation of pulsed radiation [20], and compression after compressor approach (CafCA) [21]. This will be the subject of our further research.
Acknowledgements
The optimisation of the focal spot of the PEARL laser facility was carried out by the staff members of the Institute of Applies Physics of RAS under the financial support from the Ministry of Education and Science of Russia in the framework of State Assignment No. 0035-2020-0015. The adaptive wavefront correction system was adapted to the specifics of the PEARL laser facility by the staff members of the Institute of Geosphere Dynamics of RAS under the financial support from the Russian Science Foundation (Project No. 20-69-46064).
Appendix 1.: Optimisation of the focal spot without the use of the WFS
Efficient optimisation of the focal spot using the phase conjugation algorithm is possible only if the WFS readings are related to the focal spot by means of the Fourier transform, which is violated with significant difference distortions. Phase conjugation will lead to spot optimisation only when the reference wavefront is modified taking into account the differential distortions, so that the zero residual corresponds to optimal focusing.
Redefining the reference front with allowance for differential distortions reduces to the problem of optimising the focal spot using additional methods. The inverse problem of finding the reference phase profile from the distribution of the peak intensity in the focal plane is generally incorrect due to the lack of data on the phase profile; however, under certain conditions it can be solved, e.g., iteratively. If the spot can be optimised, then the corresponding wavefront at the WFS can be taken as a reference, and the phase conjugation will effectively improve the focal spot, minimising the residual relative to the new reference front.
One of the iterative methods for optimising the focal spot is the 'aperture probing' algorithm [22] – an adaptation of the gradient descent method. The aim of the method is to find the waist intensity global maximum in the space of stresses at the electrodes of the deformed mirror. For this purpose, the voltages at all electrodes are varied one after the other to determine the direction of improvement of the focusing spot. After that, a step is made in the found direction, and then the iteration is repeated until the condition for exiting the loop is satisfied. Note that the dimension of space is equal to the number of electrodes, which corresponds to 80096 elements for a deformable mirror with 96 electrodes, when the voltage is discretised with a step of 0.5 V. This number excludes the possibility of enumerating all possible sets of voltages in a reasonable time.
In the course of this work, for the PEARL laser, the use of the described variation of the gradient descent method made it possible to achieve a value of S not exceeding 0.4. We associate such a small S with two circumstances: with episodic vibrations leading to an incorrect measurement of the phase and, as a consequence, in malfunctions in the operation of the algorithm, and with the presence of a large number of local maxima of S in the stress space of the electrodes for a given deformable mirror. The latter circumstance led to the finding of a local maximum using the algorithm and to the loop exit before reaching the maximum S. This circumstance is confirmed by our numerical simulation of the algorithm operation using images of real response functions and will become the subject of further research.
A greater value of S was achieved by modifying the WFS passport reference front. The modification consisted of subtracting surfaces corresponding to lower-order aberrations, such as astigmatism, coma, and spherical aberration, from the reference front. In this case, the amplitudes of these aberrations were selected to optimise the value of S, achieved with phase conjugation relative to the modified reference front.
Appendix 2.: Noise suppression using Fourier filtering
When measuring the distribution of radiation intensity in the far-field zone, the noise component manifests itself in adding an independent random variable to the value of each pixel of a digital camera. The average value and variance of this random variable depend both on the camera physical parameters (pixel size, temperature, etc.) and on the regime of its operation (type of shutter, exposure duration, gain level, etc.). In the presence of the noise component, even in those pixels in which signal photons are completely absent there is a nonzero value. The typical mathematical expectation of the μn noise value in our measurements was about 1 % of the limit value (4096 for a 12-bit matrix), and the standard deviation σn = 0.5 %, which are typical numbers for commercially available matrices. It should be noted that there are technical ways to reduce noise variance, associated, e.g., with increasing the pixel size, cooling the matrix and using other technological tricks. These solutions also lead to an increase in the S measurement accuracy. However, the inevitable increase in the cost and complexity of the experiment is not always justified in this case.
Noise values must be correctly interpreted; therefore, we consider the simplest scenario for processing the image of the laser beam waist from the focal camera. For estimates, let us round off the parameters of the experiment. Consider a matrix with a characteristic resolution of 1000 × 1000 pixels (106) and a pixel size of 5 μm, which is placed in the focal plane with a characteristic waist size of 50 μm (10 pixels). In this case, the waist of the beam of the measured radiation occupies about 100 pixels. For a 12-bit camera, the energy of the radiation hitting each pixel is represented by 4096 discrete values, the number of which is proportional to the number of photons hitting the pixel. Usually, to avoid overflow of the values ('overexposure'), the filters in front of the camera are chosen so that the maximum values in pixels lies in the range of 50 % – 70 % of the limit value. For definiteness, consider an image with a maximum pixel value of 2000, the signal energy in which corresponds to 2 × 10⁵, summed over the entire matrix.
The root-mean-square deviation of the noise value σn
is 20, which corresponds to 0.5 % of the limit value. The simplest procedure for accounting for noise is to subtract the mathematical expectation of the noise μn
from the values in all elements of the matrix, which we will find by averaging the values at the periphery, in the region of 100 × 100 pixels, where the signal must certainly be absent. The averaging area cannot be too large so as not to capture the pixels on which the signal is actually incident. Averaging over 1002 pixels yields the accuracy of determining the mathematical expectation  , where n is the number of pixels over which averaging is performed. Thus, on average, the mathematical expectation of the noise will be determined with an accuracy of 0.2 of the discrete value. After subtracting the mathematical expectation from all elements of the matrix, the standard deviation of 0.2 will result in an error of 0.2 × 106 = 2 × 10⁵, which corresponds to 100 % of the useful signal energy. The obtained value of S will differ, on average, from the real one by two times, which is obviously unsatisfactory. Therefore, variations of the method associated with zeroing the values in pixels that are less than the threshold are usually used.
It is reasonable to choose the threshold for cutting off the noise in such a way that the residual energy 'contained' in the noise is significantly less than the signal energy. After the zero subtraction procedure, the 'energy in noise' is ∼100 % of the signal, therefore, to reduce the noise contribution to, for example, 5 %, with a normal noise distribution, we must choose a threshold at the level of μn + 2σn = 80, or 4 % of maximum signal value. In this case, part of the signal will inevitably be 'under the threshold'. For example, it is easy to calculate that upon ideal focusing of pulsed radiation with a uniform filling of the aperture (S = 1), this part is 12 %, which will entail a commensurate error in the measurement of S. In the case of noticeable aberrations, the part of the signal under the threshold will substantially depend on specific distribution of radiation intensity in the focal plane. The dependence of S on the intensity distribution in the far zone, which can be reconstructed from the experimental data, is an obvious confirmation of the incorrectness of such measurements. Based on this logic, it can also be shown that a change in the laser pulse energy (change in the signal-to-noise ratio) while maintaining the shape of the distribution in the far field will also lead to differences in the reconstructed S values, which complicates the data interpretation even within the same experimental series. Any additional stray illumination of the matrix, which we left outside the discussion scope, can only reduce the accuracy of the measurements. Real measurements are carried out with an error many times greater than 12 %, and an adequate assessment of this error is difficult.
Note that the accuracy of determining S can be increased by independent measurements of the energy in the signal pulse, if these measurements can be carried out with a small error. However, there are also methods that are not related to additional measurements.
To reduce the errors in determining S associated with camera noise, we used the Fourier filtering procedure [23 – 25], based on a priori information on the difference between the characteristic spatial frequencies of the signal and noise. For this purpose, a round mask was imposed on the two-dimensional spatial spectrum of the experimental distribution of the laser field in the waist, outside of which the amplitude of the spectral components was set zero (Fig. 7).
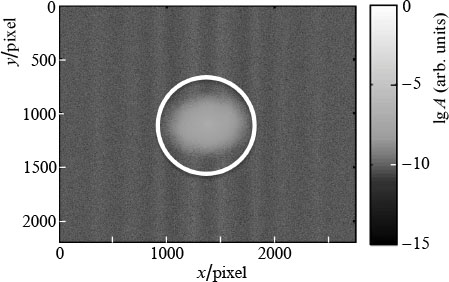
Figure 7. Amplitude A of the spatial spectrum of the far-field image. The white circle is the boundary of the mask to be applied.
Download figure:
Standard imageThe mask diameter corresponded to the angular size of the laser beam aperture in the plane of the focusing element relative to the focusing point. Since the field distributions in the near-field and far-field zones are related through the Fourier transform, such a choice of the mask diameter is mathematically equivalent to a physically trivial statement that the points outside the laser beam aperture at the focusing lens cannot affect the intensity in the waist, i.e. the amplitude values at these points are obviously zero. Figure 7 shows that for our parameters the fraction of the spatial spectrum blocked by the mask is approximately 90 %, which corresponds to an order-of-magnitude decrease in the energy of the noise component for delta-correlated noise. Sensor noise is delta-correlated if the camera electronics provide independent pixel interrogation.
If, after Fourier filtering, the procedures described above for subtracting and cutting off noise are carried out, the measurement accuracy will increase by an order of magnitude, since the energy contribution of the noise components has also been reduced by an order of magnitude. The effectiveness of the approach is clearly visible when visually comparing images before and after processing (Fig. 8).
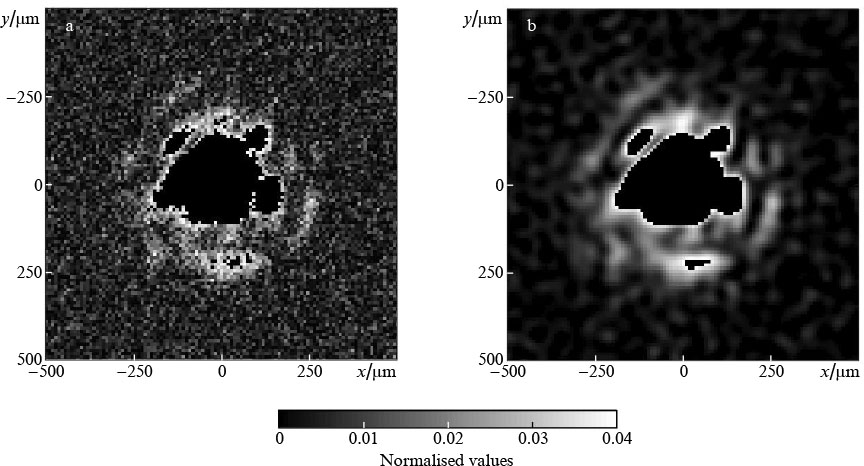
Figure 8. Images of the laser beam waist from the focal camera (a) before and (b) after the application of the described Fourier filtering algorithm. The black area in the centre contains pixels with values of more than 4 % of the maximum value.
Download figure:
Standard imageThe correctness of the proposed approach to the choice of the mask diameter is indirectly confirmed by the typical graph of the distribution density function (Fig. 9) constructed for the spatial spectrum of the far-field image.
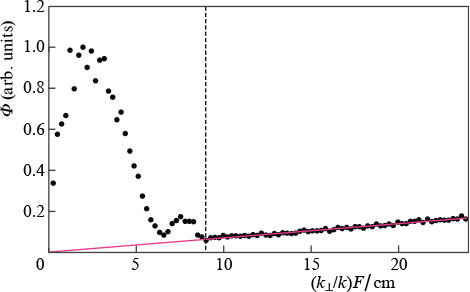
Figure 9. Distribution density function Φ for the spatial spectrum of the far-field image found under the assumption of a plane wavefront. The x axis shows the angles between the wave vector k and the axis of the system, multiplied by the focal length of the focusing element F. The vertical line corresponds to the effective radius (9 cm) of the near-field zone of the beam.
Download figure:
Standard imageThe noise contribution in Fig. 9 is represented by a slant trend line, the deviation from which corresponds to a useful signal. It is clearly seen that the contribution of the components with wave vectors, whose continuations drawn from the waist do not pass through the initial beam aperture in the near field, becomes indistinguishable from the contribution of the noise component and can be ignored.
Note that Fourier filtering is more efficient when the focal spot occupies a large part of the matrix, since this corresponds to a smaller mask diameter in Fourier space and most of the noise energy is blocked. You can enlarge the spot with a micro lens.