


Nanoparticle and polymer dynamics in nanocomposites containing spherical nanoparticles were investigated by means of molecular dynamics simulations. We show that the polymer diffusivity decreases with nanoparticle loading due to an increase of the interfacial area created by nanoparticles, in the polymer matrix. We show that small sized nanoparticles can diffuse much faster than that predicted from the Stokes-Einstein relation in the dilute regime. We show that the nanoparticle diffusivity decreases at higher nanoparticle loading due to nanoparticle–polymer interface. Increase of the nanoparticle radius slows the nanoparticle diffusion.
I. INTRODUCTION
Long polymer chains diffuse in dense systems following the reptation model of de Gennes.1 The dynamics of long polymers is controlled by entanglements, which are topological constraints imposed by the other chains. However, in polymer nanocomposites,2 there are more topological constraints due to the dispersed nanoparticles (NPs) in the polymer matrix that can influence the polymer primitive path,3–7 thus the polymer dynamics. Polymer dynamics can be altered by the characteristics of nanoparticles such as size, shape, aspect ratio, surface area, volume fraction of nanoparticles, and the nature of the interactions between the nanoparticle and the polymer matrix.8,9 There are several theories that have been used to predict how the polymer diffusivity is impeded by impenetrable particles.10–19 The first theory that was developed for a two phase system (particle and polymer) was introduced by Maxwell.10 It predicted a monotonic decrease in monomer diffusivity, as the particles act as obstacles. More diffusion models11,12,14 were developed following the same obstruction approach which also included the effect of particle geometry on polymer diffusivity. While most models for polymer nanocomposites predict a decrease in polymer diffusivity due to tortuosity, only recent models19–22 are based on the interaction of polymer chains with the nanoparticle surface. Polymer tracer diffusivity decreases in nanocomposites of large silica nanoparticles dispersed in polystyrene (PS)23 or (PMMA).24 The tracer diffusivity decreases across a wide range of polymer molecular weight and nanoparticle size23,24 and unexpectedly decreases more strongly at higher temperatures.25 In addition, Richter and co-workers explored the dynamics of entangled26,27 and unentangled poly(ethylene-alt-propylene) (PEP) polymers28 in nanocomposites by neutron spin echo (NSE) experiments. For entangled polymers, it was found that the initial Rouse relaxation rate was unaffected by the hydrophobic silica nanoparticles. A crossover from classical chain entanglement to nanoparticle entanglement, for which chains motion is hindered by nanoparticles rather than surrounding chains, has been observed experimentally.26 The confined polymer was found to be surprisingly mobile and did not exhibit glassy behavior.29,30 For unentangled poly(ethylene-alt-propylene) (PEP), there is a strong deceleration of the polymer center of mass motion, but even at the highest silica volume fraction, the segmental chain dynamics is not affected.28
From a simulation point of view, there are several studies that use the Kremer-Grest model31 to investigate the polymer dynamics. However searching for the reptation power laws1 as predicted by reptation theory, through molecular dynamics simulations, is difficult.32–38 For example, by using the Kremer-Grest model,31 the reptation regime cannot be reached for very long polymers.33 By using Monte Carlo (MC) simulations and the bond fluctuation model,39,40 it was found that there is a really long crossover region from the nonentangled dynamics to reptation dynamics.41,42 In a study of polymer chains which are confined between two walls,43 it was observed that confinement influences both the static44 and dynamic properties of the polymers.43,45–50 For a self-avoiding walk chain that diffuses between randomly distributed impenetrable fixed obstacles, the chain dynamics is slower than even reptation.51 For such of random walk polymers of length N which diffuse in a network of obstacles, the center of mass diffusion, D, varies as N−2.4.52 In a recent study on lattice MC simulations of long polymers in nanocomposites,44,53 a decrease in polymer chain diffusion was observed when the nanoparticles are fixed in the polymer matrix, with radius (R) smaller than polymer radius of gyration, by both geometric (confinement by fillers)44,53 and energetic (monomer-nanoparticle interaction) effects.53–60 Nanoparticle diffusion in a medium is predicted theoretically by the Stokes–Einstein formula61 in a dilute nanoparticle regime. Nanoparticles smaller than the tube diameter62–65 do not follow the Stokes-Einstein relation.62,66–74 To the best of our knowledge, there is no simulation study that investigates the polymer (except Ref. 75 for unentangled polymers) and nanoparticle diffusion in nanocomposites, in a non-dilute nanoparticle regime. In this article, we explore how spherical attractive nanoparticles and polymers diffuse in dense melts in the cases when the polymer radius of gyration (Rg) is larger than76–79 the nanoparticle diameter (2R), in comparison to experiments. The rest of this paper is organized as follows. In Section II, the methodology and simulation details of the present study are described. Subsequently in Section III A 1, the diffusion coefficient of unentangled polymers, normalized to its bulk value, is presented as a function of nanoparticle loading. In Section III A 2, the polymer diffusion of weakly entangled chains is compared to that of experiments.24 In Section III B, the diffusion of small nanoparticles of different radii, in the various molecular weight polymer matrices, is calculated, for a range of nanoparticle loading, and compared to the Stokes-Einstein formula. Finally, in Section IV, conclusions are presented.
II. SIMULATION METHODOLOGY
In this study, NPT molecular dynamics simulations were performed using the GROMACS package. A Kremer-Grest polymer model31 was used to incorporating an intrinsic stiffness through a cosine harmonic bending potential,4,80 which acts on three consecutive beads along the chain
where is the bending angle between three consecutive bonds. The equilibrium value , and the bending constant .80 For the polymer model used in this study, Ne obtained from the S-coil estimator is 54.9,4 and the tube diameter is 4 using the primitive path analysis method.81 More details regarding the polymer model used can be found in Ref. 78. The nanocomposite systems contain nanoparticles represented by single spheres dispersed in the dense polymer melt. The Lennard-Jones (LJ) potential, , acting along the line between the centres of mass of two particles force82 is given by
where is the interaction energy between particle i and particle j (for monomers: , for nanoparticles: , , , ), and rij represents the distance between particles i and j. For monomer (m)- nanoparticle (p) interactions, the combination rules and 82 were used. The monomers (or nanoparticles) are modelled with the repulsive only part of Eq. (2), shifted and truncated with a cutoff radius at ( for nanoparticles). For the monomer–nanoparticle interaction also the attractive part of the LJ potential (Eq. (2)) is considered and the cutoff radius is . The interaction energy between monomers and nanoparticles is . A total number of Nt = 23 600 monomers were used in a cubic cell with nanoparticles of radius R = 1, 1.5, or 2. We define the nanoparticle (filler) volume fraction ϕ in our simulations as , where 2R is the nanoparticle diameter and is the total average volume of the nanocomposite simulation box during the NPT simulation. The mass of nanoparticle is . For equilibration of polymer melts, the fast push off method was applied.83 The pressure calculated for the N = 200 polymer melt was = 4.864. That pressure was used to perform all the nanocomposite system simulations in the NPT ensemble. In nanocomposites, the starting structures were created by an ensemble of polymers with N = 200 (or N = 400) and nanoparticles inserted at random positions within a large simulation box. Subsequently, the NPT ensemble was used at melt pressure to gradually squeeze the simulation box to a dense polymer nanocomposite. Specifically, for nanocomposites with polymer matrices N = 200 and 100, the equilibrium time was and , respectively, which is sufficient time to evolve the entanglement density. For nanocomposites with unentangled matrix (N = 50, 20, 10), the starting structure was the equilibrated nanocomposite with matrix N = 100, and then a further equilibration of and was performed for systems with N = 50 and N = 20, 10, respectively. The polymer radius of gyration reached a constant value with time. We also checked that the mean square internal distances for all nanocomposites reach a Gaussian limit.84 The duration of the simulation production runs was between for unentangled polymers (N = 10, 20), for polymers with N = 50, and for polymers with N = 100. Details of the nanocomposite systems studied are given in Table I. A snapshot of the simulated polymer melt containing spherical nanoparticles is shown in Figure 1.
Nanoparticle volume fraction ϕ (%), simulation cell average length , measured in units of the monomer diameter , number of nanoparticles Nn, and radius of nanoparticles R, measured in units of the monomer diameter, for nanocomposites. The ϕ (%) and correspond to nanocomposites with attractive nanoparticles R = 1 (ϕ (%) and of the other nanocomposites with R = 1.5, R = 2 can be found in Ref. 4).
| ϕ (%) | Nn (R = 1) | Nn (R = 1.5) | Nn (R = 2) | |
|---|---|---|---|---|
| 5.5 | 31.157 | 400 | 118 | ⋯ |
| 10.3 | 31.863 | 800 | 237 | 100 |
| 14.5 | 32.569 | 1200 | 355 | ⋯ |
| 18.2 | 33.282 | 1600 | 474 | 200 |
| 24.2 | 34.653 | 2400 | 711 | 300 |
| ϕ (%) | Nn (R = 1) | Nn (R = 1.5) | Nn (R = 2) | |
|---|---|---|---|---|
| 5.5 | 31.157 | 400 | 118 | ⋯ |
| 10.3 | 31.863 | 800 | 237 | 100 |
| 14.5 | 32.569 | 1200 | 355 | ⋯ |
| 18.2 | 33.282 | 1600 | 474 | 200 |
| 24.2 | 34.653 | 2400 | 711 | 300 |
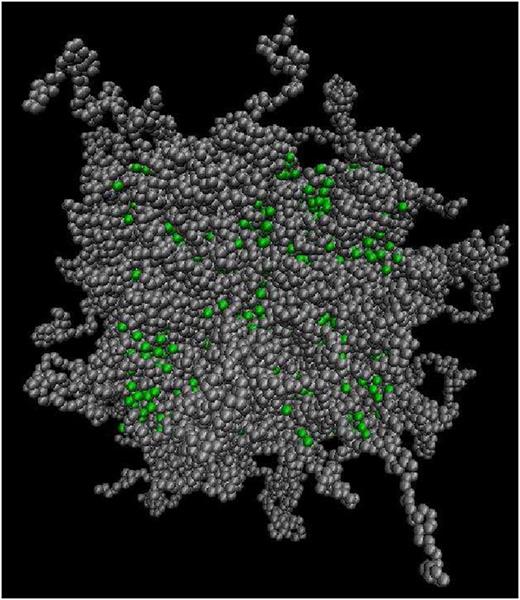
Polymer matrix with chains shown in grey and dispersed spherical nanoparticles shown in green.
Polymer matrix with chains shown in grey and dispersed spherical nanoparticles shown in green.
The length of the simulation cell, which is (depending on the nanoparticle volume fraction ϕ: see Table I), was always larger than the end-to-end distance, Re, of the polymer chains plus the cutoff distance (), thus the polymers do not interact with its periodic image. In a previous simulation study of Desai,85 a smaller simulation cell length was used () studying diffusion of polymers of similar length (N = 80).
To set the temperature at , the Langevin thermostat86 was used with a friction constant . To set pressure at , the Berendsen barostat was used with time constant . The equations of motion were integrated using the leapfrog-algorithm87 with a time step equal to 0.004τ, where τ is the Lennard-Jones time. The glass transition of a polymer model which contains a bending potential (but not a torsional potential) is Tg = 0.4.80 The monomer–nanoparticle radial distribution function gmp(r) exhibits a three layer structure.78 The high monomer density of the layers establish a well defined interface between nanoparticles and polymers whose structure differs from that of the amorphous polymer melt. Also, the nanoparticle loading increases the monomer density of polymers in contact with the nanoparticle surface.78
III. RESULTS AND DISCUSSION
A. Effect of nanoparticle loading on polymer diffusion
1. Unentangled polymer diffusion
The dynamic properties of polymer chains are estimated through the self-diffusion coefficient D0 which is calculated through the mean square displacement82 in the regime where the mean square displacement increases linearly with time
where is the time dependent displacement of the monomer averaged over time and monomers of the ensemble (ri is the position of a monomer i).
The diffusion of unentangled tracer polymers in an entangled matrix88 follows the Rouse model. In a polymer nanocomposite containing non-attractive large nanoparticles75 (where diameter 2R is larger than Rg), unentangled polymer diffusion decreases with nanoparticle loading. However in our study, we investigate spherical nanoparticles with attractive interactions with the polymers that are well dispersed78 in the polymer matrix. We show in Figure 2 the polymer diffusivity, normalized to its bulk value, as a function of the nanoparticle loading for (2R = 2). We can see that at nanoparticle loading higher than the dilute regime (), the polymer diffusivity is lower than that predicted from the Maxwell model. We observe that the polymer diffusion decreases with the addition of nanoparticles in the matrix. This is due to, by adding nanoparticles in the matrix, the increased interfacial area around the nanoparticles and more monomers exist into the interfacial area.78 The same trend appears for unentangled matrices of N = 10, 20, 50. Similarly, a reduction of unentangled polymer diffusion with the nanoparticle loading has also been observed in the case of very strong attractive polymer-filler interaction (59,85,89). The polymer chain dynamics of the nanocomposites containing attractive polymer/nanoparticle interaction is largely affected by the nanoparticles,90 in nanoparticle loading larger than the dilute regime () as in the experimental systems of poly(ethylene glycol) (PEG) and poly(butylene oxide) (PBO) chains91 or (poly(2-vinylpyridine) (P2VP)) chains9 with silica nanoparticles. Since the PEG polymers interact attractively with neat silica nanoparticles, a fraction of PEG chains was attached to the nanoparticle surface.30

Dependence of diffusivity (normalized to its bulk value) of unentangled polymers for different nanoparticle loading: Maxwell prediction (black line), N = 10 (circles), N = 20 (squares), N = 50 (diamonds). The size of the error is smaller than the symbol size in all cases, so error bars are not shown.
Dependence of diffusivity (normalized to its bulk value) of unentangled polymers for different nanoparticle loading: Maxwell prediction (black line), N = 10 (circles), N = 20 (squares), N = 50 (diamonds). The size of the error is smaller than the symbol size in all cases, so error bars are not shown.
2. Weakly entangled polymer diffusion
We show in Figure 3 the diffusivity (as calculated from Eq. (3)) of weakly entangled polymers (N = 100) as a function of the nanoparticle loading. We observe that the polymer diffusion decreases with the addition of nanoparticles in the matrix. In particular, in the nanocomposites studied at 24.2% nanoparticle loading, the ratio, of polymer diffusivity, D/D0 = 0.3, whereas in a Monte Carlo (MC) study of athermal nanocomposites,44 the ratio D/D0 decreases to , for weakly entangled polymers, at nanoparticle loading 30%. However, it is worth noting that in the MC study, the nanoparticles are fixed into the simulation cell, thus they are immobile, contributing to the decrease of polymer diffusivity, whereas in our work, they are mobile and not fixed in the simulation cell. In addition, in the case of repulsive nanoparticles,54,59,85 the polymer diffusion coefficient initially increases with increasing nanoparticle loading (up to 5%),54,85 it reaches a maximum, and decreases further to a D/D0 = 0.8 ratio, at nanoparticle loading (10%). While in the initial dilute nanoparticle loading, the increase of polymer diffusion (in comparison to its bulk value) reflects the repulsive polymer-nanoparticle interaction, at a higher loading (10%), a reduction of the polymer diffusion is observed, due to simply geometrical reasons, and is affected by the presence of tortuous path.85 We can see that the simulation data agree with the experimental system of PMMA tracer diffusion,24 at high nanoparticle loadings. However, in the dilute nanoparticle regime, there is discrepancy to the data. In the experimental nanocomposite, tracer diffusion24 collapses onto a master curve when the neat homopolymer diffusion (D/D0) is plotted versus a confinement parameter defined as the interparticle distance relative to the polymer radius of gyration (ID/2Rg)23,24,92 where the interparticle distance ID is given as , where ϕ is the volume fraction of nanoparticles. However in our data, the mechanism of reduction of diffusion in our simulation data is not due to entropic barriers but due to nanoparticle interfacial area.93,94 Although the, experimental, nanocomposite system24 considers immobile nanoparticles (of radius 6.5-25 nm) that are different than our simulated small nanoparticle composites, this is the only studied nanocomposite system which contains an attractive nanoparticle polymer interaction, and thus the nanoparticles are well dispersed in the polymer matrix. In order to estimate the local segmental dynamics, the bond autocorrelation, Cb(t), was calculated according to the equation , where P2 is the second Legendre polynomial, b(t) is a unit vector aligned along the bond of a polymer, and the angular brackets indicate an average over all polymer bonds in the system. Cb(t) measures the local segmental dynamics of polymer chains, equally weighting reorientation motions in all spatial directions. It was found that the segmental dynamics decreases (thus the relaxation time increases) with nanoparticle loading and with increasing nanoparticle radius (see Figures S1 and S2 in the supplementary material).

Dependence of diffusivity (normalized to its bulk value) of weakly entangled polymers (N = 100) for different nanoparticle loadings: (i) Maxwell prediction (black line), (ii) simulation data N = 100 (stars), (iii) PMMA tracer diffusion: diameter dNP = 13 nm (circles), (iv) dNP = 29 nm (squares), (v) dNP = 50 nm (triangles).
Dependence of diffusivity (normalized to its bulk value) of weakly entangled polymers (N = 100) for different nanoparticle loadings: (i) Maxwell prediction (black line), (ii) simulation data N = 100 (stars), (iii) PMMA tracer diffusion: diameter dNP = 13 nm (circles), (iv) dNP = 29 nm (squares), (v) dNP = 50 nm (triangles).
In a simplified model where polymer chains were modeled as spheres diffusing down cylindrical pores,95 it was shown that excluded volume effects can account for the observed reduction in polymer diffusion for values of . In that region, the excluded volume model predicted a pseudomaster curve for the reduced diffusion coefficients, in good agreement with experimental results23,92 at higher nanoparticle loading. In addition, in nanocomposites of poly(ethylene glycol) (PEG)-tethered silica (SiO2) nanoparticles and poly(methyl methacrylate) (PMMA), polymer chain dynamics undergoes a continuous transition from bulk-like behavior at low nanoparticle loading to confinement behavior at intermediate nanoparticle loading and ultimately to glassy behavior at high nanoparticle loading.96
B. Nanoparticle diffusion
Nanocomposites containing nanoparticles have been investigated experimentally such as systems of polyhedral oligomeric silsesquioxane (POSS) nanoparticles (R = 1 nm) dispersed in poly(ethylene-alt-propylene) matrix27 or cadmium selenide nanoparticles dispersed in PS matrix.66 While in other theoretical studies,70,85,97–99 only the dilute nanoparticle loading has been explored, we investigate, for the first time, the nanoparticle diffusion for a wide nanoparticle concentration range. It is known that the dynamics of spherical particles (colloids) in a fluid can be predicted by the classic continuum Stokes-Einstein relation. For a spherical particle of radius R in a fluid of viscosity η, the diffusion coefficient DSE of the particle is given by59,61
where η is the viscosity of the dense polymer melt (Kremer Grest model), given by Ref. 100 and for long polymers (N = 200, 400) by Ref. 101. However, in the case of small nanoparticles dispersed in polymer melts27,79,102,103 and solutions,104,105 the validity of Equation (4) is questionable as observed by experiments66 and theory.69,106 The nanoparticle diffusivities of the simulated nanocomposite systems are calculated from the mean square displacement measurements given by Equation 3, where , where is the time dependent displacement of the nanoparticle averaged over time and nanoparticles of the ensemble.
It can be seen from Figure 4 the nanoparticle diffusivity for different polymer matrices and nanoparticle loading. Clearly it can be seen that in the dilute nanoparticle regime (), small nanoparticles (R = 1) diffuse much faster than the SE prediction64 for matrices . The Stokes-Einstein relation can be valid, for nanoparticles diffusivity, in nanocomposites containing very short (unentangled) polymers at the dilute regime in agreement with experiments.72 The diffusion of such small sized nanoparticles reaches a plateau in entangled polymer matrices for in agreement with the Generalized Langevin Equation (GLE) theory62,64 and theoretical predictions by de Gennes1 who argued that bulk viscosity does not capture the behavior of surrounding flows near NPs, and thus the NPs diffusion is decoupled from the SE relation (Eq. (4)). In addition, by increasing the nanoparticle loading, nanoparticles diffusivity is decreased dramatically in all polymer matrices. The same plateau region is obtained for all nanoparticles loading in entangled polymer matrices. Since the nanoparticle diameter is smaller than the entanglement strand, such dispersed nanoparticles can diffuse inside the mesh of polymers, faster in comparison to the SE predictions, due to local viscosity.64 Such small fillers provide the best reinforcement effects3,4,107–109 in all the loading range considered and diffuse faster than the monomers. In the inset of Figure 4, the nanoparticle diffusivity is scaled with the SE prediction (Eq. (4)) for different polymer matrices. It can be seen, from all the data, that such nanoparticles, smaller than the tube diameter dT ( for our polymer model), deviate more from the SE predictions by increasing the molecular weight of the polymer matrix and nanoparticle loading. The discrepancy is large for weakly entangled (and even more for entangled) polymer matrices due to the viscosity scaling with molecular weight in the entangled regime. In an experimental study of silica nanoparticles in entangled poly(2-vinylpyridine) (P2VP) melts, in which 2R/dT = 3, the diffusion of silica nanoparticles in P2VP9 is well-described by the hydrodynamic Stokes-Einstein relation as can be seen in the inset of Fig. 4.

Dependence of nanoparticle (R = 1) diffusivity in unentangled and entangled polymer matrices for different nanoparticle loading: The Stokes-Einstein relation predictions (open symbols), (circles), (diamonds), (squares), (upper triangles), (stars). Inset: scaled nanoparticle (R = 1) diffusivity with the Stokes-Einstein prediction in unentangled and entangled polymer matrices (4) for different nanoparticle loading. Silica/P2VP experiment (filled squares).9
Dependence of nanoparticle (R = 1) diffusivity in unentangled and entangled polymer matrices for different nanoparticle loading: The Stokes-Einstein relation predictions (open symbols), (circles), (diamonds), (squares), (upper triangles), (stars). Inset: scaled nanoparticle (R = 1) diffusivity with the Stokes-Einstein prediction in unentangled and entangled polymer matrices (4) for different nanoparticle loading. Silica/P2VP experiment (filled squares).9
The nanoparticle loading has a high impact on the nanoparticle diffusivity decrease, especially for unentangled polymers, as can be seen in Fig. 5. By increasing the nanoparticle radius, the nanoparticle diffusivity decreases as can be seen in the inset of Fig. 5 for different polymer matrix molecular weights. It is worth noting that a similar plateau region in the entangled regime appears in experiments, and nanoparticles diffusivity will approach the Stokes-Einstein predictions when the radius is approximately 4-5 times of the matrix tube diameter, as was evidenced in poly(n-butyl methacrylate)/gold nanocomposites.73

Nanoparticle (R = 1) diffusivity in unentangled and entangled polymer matrices vs. nanoparticle volume fraction: N = 10 (circles), N = 20 (diamonds), N = 50 (squares), N = 100 (upper triangles), N = 200 (stars). Inset: Nanoparticle diffusivity of different radius, at nanoparticle loading : R = 1 (circles), R = 1.5 (upper triangles), R = 2 (inverted triangles).
Nanoparticle (R = 1) diffusivity in unentangled and entangled polymer matrices vs. nanoparticle volume fraction: N = 10 (circles), N = 20 (diamonds), N = 50 (squares), N = 100 (upper triangles), N = 200 (stars). Inset: Nanoparticle diffusivity of different radius, at nanoparticle loading : R = 1 (circles), R = 1.5 (upper triangles), R = 2 (inverted triangles).
IV. CONCLUSIONS
The nanoparticle and unentangled polymer dynamics in nanocomposites containing spherical nanoparticles were investigated by means of molecular dynamics simulations. In conclusion, we have found that attractive interactions between the nanoparticles and the polymers appear to hinder chain motion, especially at higher nanoparticle volume fractions. Contrary to previously studied models containing unentangled polymers, we also calculate the diffusivity of weakly semiflexible entangled polymers and predict a better comparison to experimental data of nanocomposites, in which there is a good dispersion of silica nanoparticles in a polystyrene matrix. We reported that the polymer diffusivity decreases with nanoparticle loading due to the increase of the nanoparticle surface area. Also other parameters may affect polymer diffusion, such as polymer radius of gyration with nanoparticle loading,78 polymer entanglements,4 nanoparticle diffusivity, strength of monomer-nanoparticle interaction, and confinement.
We also show that small sized nanoparticles can diffuse much faster than that predicted from the Stokes-Einstein relation in the dilute regime. However, for large volume fractions, the nanoparticles diffusivity decreases due to both nanoparticle–polymer surface area and nanoparticle loading.
SUPPLEMENTARY MATERIAL
See supplementary material for the bond autocorrelation decay function and mean square displacement of polymers in different nanocomposites.
ACKNOWLEDGMENTS
This research was funded by the EPSRC/NSF Materials Network Program Nos. EP/5065373/1 (EPSRC: N.C. and A.K.) and DMR-1210379 (NSF: K.I.W. and R.J.C.). Support was also provided by ACS/PRF 54028-ND7 (RJC) and NSF/DMR 1507713 (RJC).

