


Abstract
The entire area of the Japanese Islands has been covered by the permanent GPS observation network of the Geographical Survey Institute since 1994. In this paper we use a solution for the vectors of motion during 1995 for a selection of 116 stations to discuss the origin of the observed deformation field. We refer the displacement field to Eurasia using the VLBI-determined motion of Kashima and demonstrate that other choices such as the Okhotsk or North American plates for north Japan are not compatible with the data. 1yr GPS velocities are much higher than geological constraints would allow because these short-term measurements include transient elastic deformation. However, the good qualitative agreement between the observed geodetic deformation tensors and those inferred from active faults and earthquakes suggests that the Quaternary permanent deformation is essentially the result of the transfer of part of the subduction-induced elastic deformation into permanent plastic deformation. We then compute the elastic deformation of the Japanese Islands caused by interseismic loading of the Pacific and Philippine subduction planes. The geometry of the coupled zone and its downward extension are determined from the distribution of earthquakes for the Pacific slab. For the Philippine slab we use the geometry proposed by Hyndman et al. (1995). These elastic models account for most of the observed velocity field if the subduction movement of the Philippine Sea Plate is 100 per cent locked and if that of the Pacific Plate is 75–85 per cent locked. We note that the boundaries of the areas where significant elastic deformation is predicted (more than 10mmyr−1 of motion with respect to Eurasia) coincide with the main zones of permanent deformation: the Eastern Japan Sea deformation zone for the Pacific subduction elastic deformation field and the Setouchi/MTL deformation zone for the Nankai field. Each zone probably accommodates 10–15mmyr−1 of motion in the long term (convergence in the Eastern Japan Sea; strike-slip in the Setouchi/MTL zone). To account for this deformation, the effect of elastic loading from the trench must be combined with 5–10mmyr−1 of motion of the Amur Plate with respect to Eurasia. Because loading during the subduction earthquake cycle causes an increase in stress in the Eastern Japan Sea and Setouchi/MTL deformation zones, the probability of earthquake occurrence in these zones may be higher near the end of the cycle.
Introduction
The entire area of the Japanese Islands has been covered by the permanent GPS observation network of the Geographical Survey Institute Abe & Tsuji 1994) since 1994. In this paper we use a solution for the vectors of motion during the year 1995 for a selection of 116 stations to discuss the origin of the observed deformation field. We refer the measured displacement field to Eurasia using the motion of Kashima (35°57′N, 140°40′E) with respect to Eurasia determined by Heki (1996) from VLBI measurements (20.7±1.3mmyr−1 towards 278°). Essentially the same velocity is determined by Heki for nearby Tsukuba, which is the reference station of the GSI observation network. We shall later justify the use of Eurasia as a reference frame.
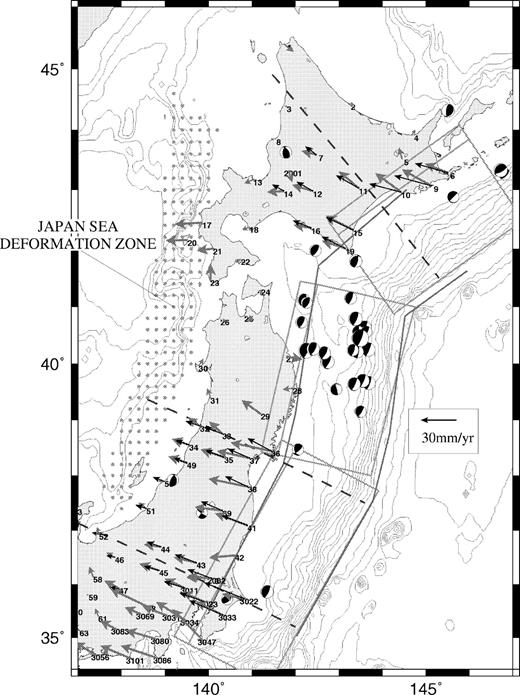
The striking character of this displacement field, shown in Fig. 1, is its homogeneity. Within Honshu and Shikoku, the vectors everywhere have a westerly orientation, changing progressively from 290° in northern Honshu and central Japan to 305° in Shikoku. The modulus of the velocity is 25–35mmyr−1 on the eastern coast of northern Japan and decreases to less than 10mmyr−1 to the west in the vicinity of the Eastern Japan Sea seismically active shortening zone (Nakamura 1983; Tamaki & Honza 1985; Tamaki et al. 1992). It is also 25–35mmyr−1 on the southern coast of southwestern Japan and decreases to less than 10mmyr−1 to the north within the Setouchi Inland Sea seismically active shear zone (Sugiyama 1994). The error ellipses were not available to us, but comparisons of the 1995 and 1996 velocity fields indicate that the main features of the velocity field that we are trying to match do not change significantly from one year to the next.
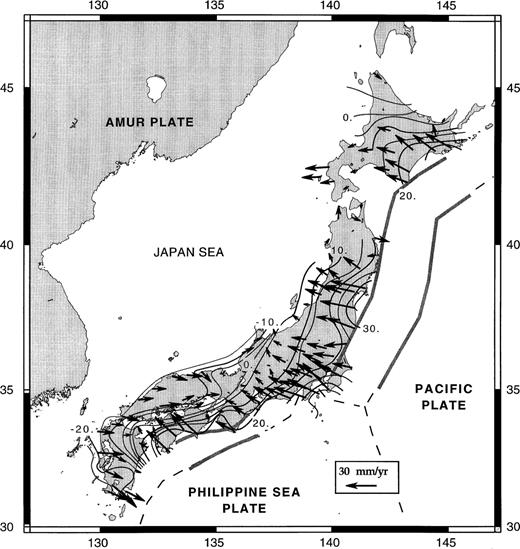
Velocity field with respect to Eurasia obtained from 1995 GPS observations within the GSI permanent network. The vectors are inmmyr−1. The Eurasian reference has been obtained by setting the vector for Kashima station at the value proposed by Heki (1996). The limits of the locked zones along the Pacific plate boundary are after Shen Tu & Holt (1996) and along the Philippine Sea plate boundary after Hyndman et al. (1995). The modulus of the velocity is contoured; values are inmmyr−1. These contours are not drawn over the northern part of North Honshu and the southern part of Hokkaido because they were affected by a 7.7 earthquake that occurred near the Japan Trench and by its numerous aftershocks. The eastern limit of the Amur Plate approximately follows the 0 isovelocity contour (see text).
The GPS velocity vectors are parallel to the Pacific subduction vector in northern Japan [92mmyr−1 towards 292° with respect to Eurasia (DeMets 1992; DeMets et al. 1990)] and to the Philippine Sea subduction vector in southwestern Japan [48mmyr−1 towards 310°, also with respect to Eurasia (Seno et al. 1993)]. These values are too large to correspond to permanent tectonic deformation. We will show that they correspond mostly to elastic transient deformation, directly related to the tectonic coupling of the Japanese Islands with the Pacific and Philippine Sea plates, as has been proposed by many authors.
In the simplest tectonic model, elastic strain accumulation along a subduction zone between seismic events is assumed to result from a constant rate of elastic build-up produced by the locking of the thrust zone, this elastic deformation being instantaneously released during the earthquakes. The locked thrust surface can then be treated as an edge dislocation in an elastic half-space with a constant backslip (normal-slip) rate during the interseismic phase (Savage 1983). The downdip extent of the locked zone can be obtained from modelling the large amount of deformation that occurs during great earthquakes and approximately coincides with the maximum extent of interplate thrust events. In southwest Japan, Hyndman et al. (1995) have determined the geometry of the locked thrust plane based on the analysis of the Nankaido and Tonankai great earthquakes; they showed that the downdip extent of the locked zone is thermally controlled. Their modelling indicates a 100 per cent rate of elastic coupling there. In northern Japan, Shen Tu & Holt (1996) have determined the geometry of the locked zone based on the locations of interplate earthquakes (Byrne et al. 1988; Kawakatsu & Seno 1983). Their modelling indicates only a 50 per cent rate of elastic coupling there.
In this paper we first test in what measure the GPS 1995 velocity field over the Japanese Islands with respect to Eurasia can be accounted for by elastic loading along the Pacific and Philippine Sea plates’ subduction zones using the analytical expressions proposed by Savage (1983) for finite rectangular sources within an elastic half-space and the locked thrust planes geometries proposed by Hyndman et al. (1995) and Shen Tu & Holt (1996). We ignore the complexities related to the Izu–Bonin collision in the Kanto-Tokai area, and those related to the subduction west of Palao-Kyushu ridge in the Kyushu area. We compare the GPS deformation field with the seismic and tectonic deformation fields and show that they are qualitatively similar but that the GPS deformation field is much larger than the other two. We then show that, as a first approximation, most of this GPS velocity field can indeed be accounted for by full elastic coupling along both the Pacific and the Philippine locked thrust zones. Finally, we discuss the tectonic implications of our analysis.
From Elastic To Plastic Deformation
The strain pattern derived from the GPS velocity field is shown in Figs2(a) and (b). It is in qualitative agreement, in the style of deformation and in the directions of the principal horizontal strain component, with those obtained from both the distributions of fault-plane solutions of earthquakes and active faults (Research Group for Active Faults in Japan 1991; Tsukahara & Kobayashi 1991; Tsukuhara & Ikeda 1991). It changes from pure shortening in northern Japan to strike-slip deformation in central and southwestern Japan, and the direction of maximum shortening essentially coincides with the direction of the velocity vectors everywhere. Thus the instantaneous GPS presumably elastic strain pattern appears to be collinear with the long-term plastic strain pattern. Consequently, this probably mostly elastic transient deformation field is directly related to the long-term plastic deformation field and both fields are largely determined by the tectonic coupling of the Japanese Islands with the Pacific and Philippine plates, as has been proposed by many authors (Wesnousky et al. 1982; Hashimoto & Jackson 1993; Shen Tu & Holt 1996; Shen-Tu et al. 1995).
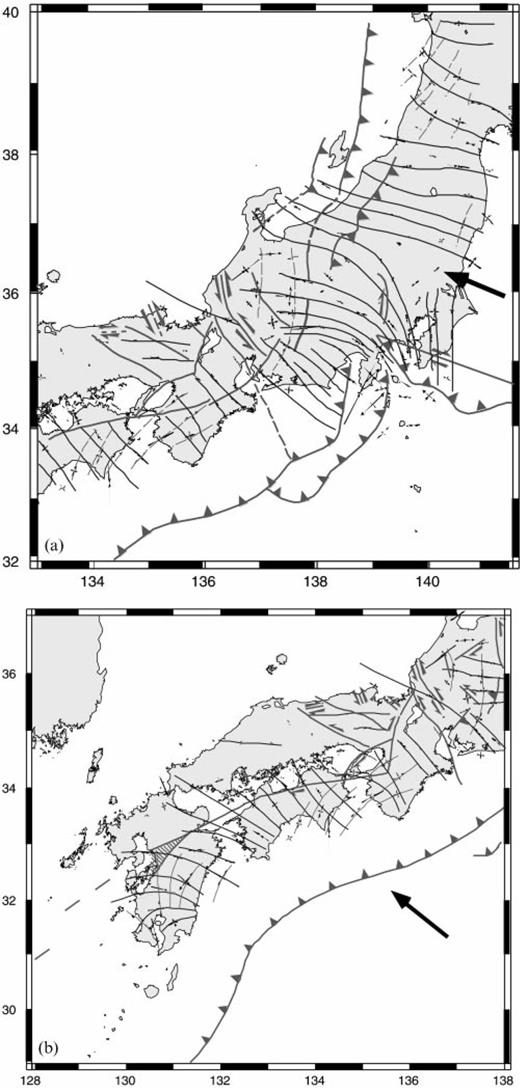
Strain patterns in central and northern Japan (a) and in southwestern Japan (b) derived from the GPS velocity field shown in Fig. 1. The trajectories of maximum shortening are shown as continuous lines, whereas the trajectories of maximum extension are dashed grey lines. Main active tectonic faults and plate boundaries have been schematized (thick continuous lines). The subduction vectors with respect to Eurasia are shown by large arrows. Note the parallelism between the subduction vectors and the maximum shortening trajectories.
Another independent argument is related to the similar qualitative agreement between the elastic vertical deformation and the long-term plastic deformation. Note that in Fig. 1 the landward limit of the locked zone, as defined by Shen Tu & Holt (1996) and Hyndman et al. (1995), coincides approximately with the coastline. The elastic deformation induced by the subduction of the oceanic plates produces subsidence seawards of this limit and uplift landwards of this limit during the interseismic phase. Thus, the coastline coincides with the change from subsidence to uplift. A simple way to explain this coincidence is to assume that part of the interseismic deformation is transformed into plastic permanent deformation and consequently is not restored by elastic deformation of the opposite sense during the coseismic phase. Alternatively, other authors have assumed that this long-term uplift is related to incomplete viscoelastic relaxation at depth Matsu’ura & Sato 1989).
The present deformation system of Japan was initiated near the early Pliocene, at 5Ma, and was fully established by the late Pliocene (Taira et al., personal communication, 1997). For example, the East Japan Sea convergence zone was initiated near 5Ma but became very active only at 1.8Ma (Tamaki et al. 1992). The Izu collision in central Japan started at about 1.8Ma. The progressive formation of the Median Tectonic Line and the associated Setouchi Inland Sea as a dextral shear zone started at 4Ma and was complete by about 2Ma (Sugiyama 1994). The volcanic rift of Kyushu started near 5Ma and was fully active by 1.8Ma (Tamanyu 1993). Finally, the extension of the Kyushu Rift within the Okinawa Trough became active between 2 and 1Ma. Thus we can assume that the present system of deformation has been fully active for about 2Myr. Knowing that the maximum interseismic uplift rate is about 5mmyr−1 (Hyndman et al. 1995) and that the continent has been uplifted by about 500m (Huang et al. 1997), the part of the instantaneous deformation that is plastic and permanent appears to be between 5 and 2 per cent, assuming that the present deformation field has been active for 2–5Myr.
Results Of Elastic Modelling
We now demonstrate that the GPS-measured displacement field can be accounted for as a first approximation by elastic loading of the Japanese lithosphere during the interseismic phase along the locked parts of the Pacific and Philippine Sea subduction thrust planes. The geometries of the thrust planes we use are shown in Fig. 3.
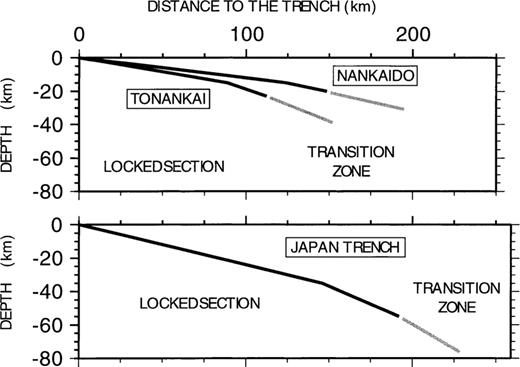
(Top) simplified geometries adopted for the Philippine Sea slab in Tonankai and Nankaido, after Hyndman et al. (1995). Black lines correspond to the locked zone, grey lines to the transition zone. The rectangular approximations may be compared with the actual geometries of the locked zones as shown in Fig. 1. (Bottom) same for the Pacific slab below northern Honshu. Geometry is from Shen Tu & Holt (1996).
For the Philippine Sea slab, we adopt the geometry proposed by Hyndman et al. (1995) based on thermal modelling of the slab as well as on elastic modelling of both the interseismic and coseismic vertical motions in Shikoku and on the Kii peninsula. The modelling of the vertical motions tightly constrains the downward limit of the locked plane, as will be seen later. In the Nankaido region, the coupled zone extends to a depth of about 20km, then a transition zone is added down to 30km. The downdip lengths of the two portions are 150 and 45km, respectively. In the Tonankai region, the subduction is steeper. The locked zone extends to a depth of 23km but is only 115km long and the transition zone extends to 38km and is 40km long. The existence of the transition zone below the locked zone is independently supported by the fact that a large slow slip below the seismogenic zone has been shown by Linde & Sacks (1997) to have preceded both the Tonankai and the Nankaido earthquakes.
For the Pacific slab, we adopt the geometry proposed by Shen-Tu et al. (1995) on the basis of the locations of interplate earthquakes (Byrne et al. 1988; Kawakatsu & Seno 1983). The downdip extent of the coupled zone they adopt is 200km with a transition zone 40km long. The maximum depth of the locked part of the plane is about 55km and the transition goes down to 75km depth.
Thatcher & Rundle (1979), Savage (1983) and Matsu’ura & Sato (1989) have described the subduction cycle by the combination of steady-state slip over the whole subduction interface, steady-state backslip (normal slip) along the locked portion of the subduction interfaces and coseismic plus post-seismic effects from the subduction earthquakes [see Cohen (1996) for a summary of the formulations of Savage (1983) and Matsu’ura & Sato (1989)]. In order to compare the GPS displacement field observed over Japan during 1995 to the predicted displacement due to coupling along the locked portions of the subduction zones, we ignored viscoelasticity and used a purely elastic model, computing the motion vectors predicted by an elastic dislocation over rectangular planes at the rates and directions of the subduction vectors given in the introduction, the solution being obtained from Savage (1983). The velocity is multiplied by the coupling factor. The purely elastic solution is a good first approximation to solutions using more complex rheologies (Savage 1983).
In order to identify possible effects of coseismic motions during large earthquakes on the 1995 GPS motion vectors, we have plotted the locations of the Harvard CMT solutions which correspond to shallow earthquakes larger than about 5.1. The two main earthquakes are shown by stars in Fig. 4. That off the east coast of north Honshu did not occur in 1995, but four days earlier on December 28, 1994, and was a 7.7 magnitude earthquake. However, numerous aftershocks of magnitude up to 6.9 occurred during 1995 and for this reason we did not consider the vectors corresponding to stations 17, 18 and 20–31 in northernmost Honshu and southernmost Hokkaido (see Fig. 7 for locations of stations) for the adjustments, although computed vectors are shown for all measured vectors in Fig. 4. The second large earthquake is the 6.9Kobe earthquake which occurred on January 16, 1995. We did not consider the vectors corresponding to stations 81, 80, 69, 67 and 71 immediately adjacent to the epicentre (see Fig. 5 for locations of stations) for the adjustments.
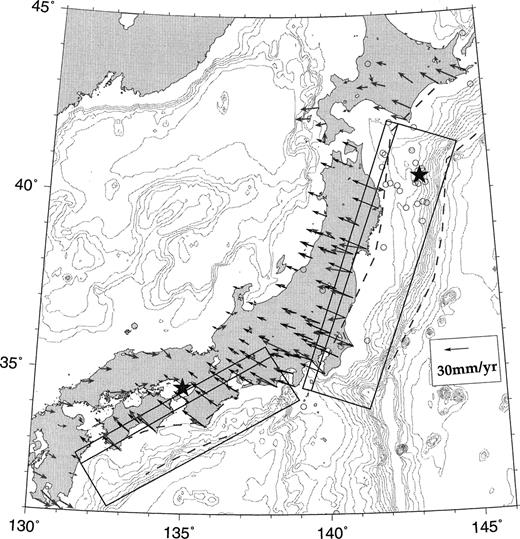
Elastic modelling using two simple rectangular dislocations, one for the Pacific Plate locked thrust zone below northern Honshu, the other for the Philippine Sea Plate locked thrust zone below southwest Japan. The outlines of the planes are indicated, including the deeper zones of progressive decoupling. The rectangular approximations may be compared with the actual geometries of the locked zones as shown in Fig. 1 (dashed lines). The coupling factor is assumed to be 100 per cent for the Philippine Sea Plate and 80 per cent for the Pacific Plate; the subduction velocity is the velocity of the subducted plate with respect to Eurasia. Circles are the 1995 shallow earthquakes (from the Harvard CMT database, Mb>5.0) and the two stars correspond to the Kobe earthquake and the Mb 7.7 earthquake in the Japan Trench. The measured (grey arrows) and computed (black arrows) velocities are identical to first order. This confirms that most of the observed velocity field is produced by elastic coupling along the locked subduction thrust zones.
Elastic modelling of northern Japan thrust zones using three rectangular planes: two for northern Honshu and one for Hokkaido. Symbols as in Fig. 4. The dotted area covers the Eastern Japan Sea convergence zone, active during the Quaternary. Computations were performed for a coupling factor of 75 per cent. Note the perturbation of the GPS data around the Mb 7.7 earthquake and its aftershocks (CMT symbols). The dashed lines indicate the locations of cross-sections in Fig. 8.
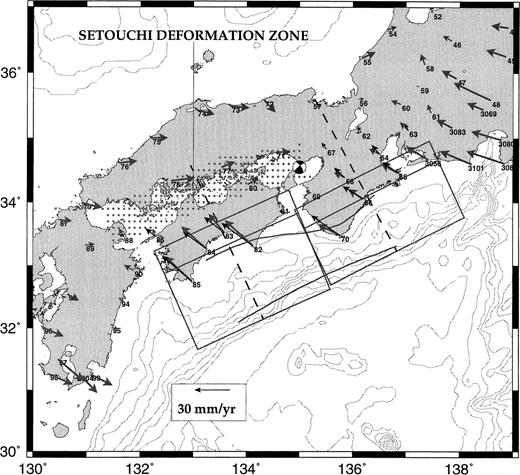
Elastic modelling of the southern Japan thrust zone with an approximation of the locked portion by two rectangles, one for the Nankaido zone to the west, and one for the Tonankai zone to the east. Symbols are as in Fig. 4. The dashed lines indicate the locations of cross-sections in Fig. 6. The dotted area covers the Setouchi Quaternary tectonic zone. Computations were performed for a 100 per cent coupling factor. Note the perturbation of the GPS data around the Kobe earthquake (CMT symbol).
We first adopt the simplest possible configuration for the two Pacific and Philippine Sea slabs, as shown in Fig. 4, to demonstrate that the overall Japanese Islands 1995 velocity field is dominated by the effect of elastic coupling on the two locked planes. We thus use a single rectangle for each coupled plane and another for each transition zone. The Nankai Trough dislocation surface strikes N060° and extends over 300km, with a locked section down to 20km depth and a transition zone to 30km (with a dip of 7°–12°). The Japan Trench subduction plane strikes N020°, is 405km long and extends to 55km depth for the locked section (75km for the transition) with a dip of 13.5°–30°. The validity of this approximation can be judged by comparing their outlines in Fig. 4 to the actual limits of the locked planes as defined above. The coupling factor is 100 per cent for the Philippine Sea slab and 80 per cent for the Pacific slab. A comparison of the computed and measured vectors confirms that the moduli and directions of the GPS displacement vectors are indeed well approximated by this rather crude model.
We then successively model in greater detail the Philippine Sea slab and the Pacific slab. Figs 5 and 6 show this modelling for the Philippine Sea slab. We now use two sets of rectangular planes, one for the Tonankai and one for the Nankaido locked and transition zones. The elastic effect is not significant north of the Setouchi Inland Sea. The best fit is obtained for a 100 per cent coupling factor. The computed directions agree closely with the measured directions and the amplitudes also agree well, as seen in Fig. 6(a). The predicted vertical motion also agrees well with the coseismic and interseismic vertical motions as given by Hyndman et al. (1995) [Fig. 6(b)]. This last point is not surprising because we used the same slab geometry and coupling factor as they did to fit the same vertical motions, but it confirms that our computing techniques give comparable results. As noted above, in general the interseismic coupling produces uplift on land north of the coast and subsidence at sea south of it. This is the same pattern of vertical motion as the permanent plastic vertical motion that has prevailed in the last 2–5 Myr. It confirms that plastic and elastic deformations are essentially collinear. The percentage of the coupled vertical motion that has been plastic is thus about 2–5 per cent, as mentioned above.
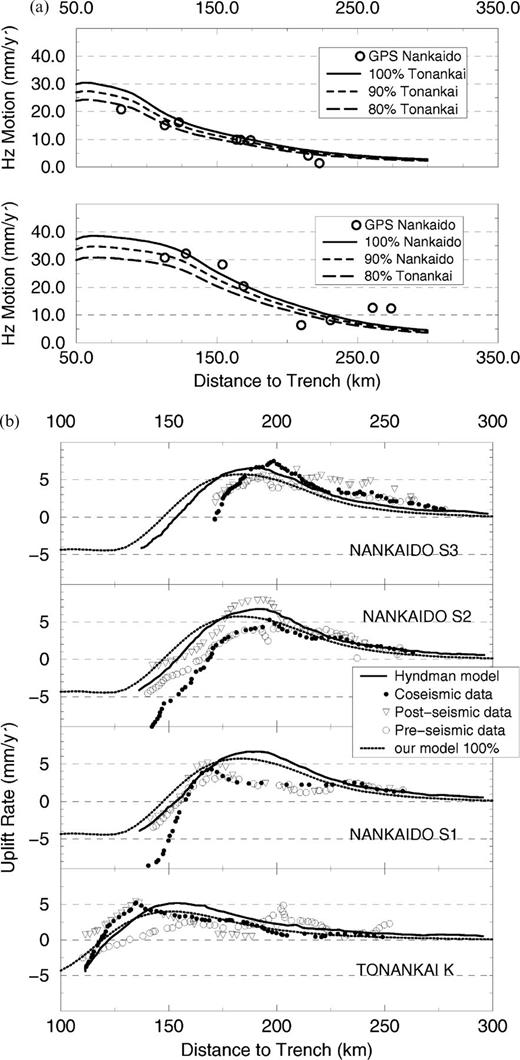
(a) Elastic modelling of the Nankaido (bottom) and Tonankai (top) thrust zones in southern Japan based on the geometry of Fig. 5. The variation of the modulus of the horizontal velocity is plotted with respect to the distance to the subduction front. GPS data are indicated by circles. Computed curves along cross-sections (see Fig. 5 for location) for 100, 90 and 80 per cent coupling. (b) Computed vertical motion compared to the measured coseismic and interseismic vertical motions after Hyndman et al. (1995). Note the general agreement between measured and computed motions for a 100 per cent coupling factor.
Figs 7 and 8 show the modelling for the Pacific slab. We use three sets of rectangles to model the locked and the transition planes. The best fit of the measured vectors, next to which computed vectors are shown, is obtained for a coupling factor of 75 per cent. This coupling factor is that used for Fig. 7. The agreement in direction is fairly good. Note that the computed velocities drop to 10–15mmyr−1 on the shore of the Japan Sea and that this is close to the average value of the measured GPS velocities. The Harvard fault-plane solutions of the shallow 1995 earthquakes are also shown. Fig. 8 shows the computed curves for the modulus of the velocity vectors compared to the actual measured values for three zones, the Hokkaido zone to the north, the Tohoku section in north Honshu and the Kanto region to the south. Systematic differences exist between the sections but all are best fitted by coupling factors larger than 60 per cent.
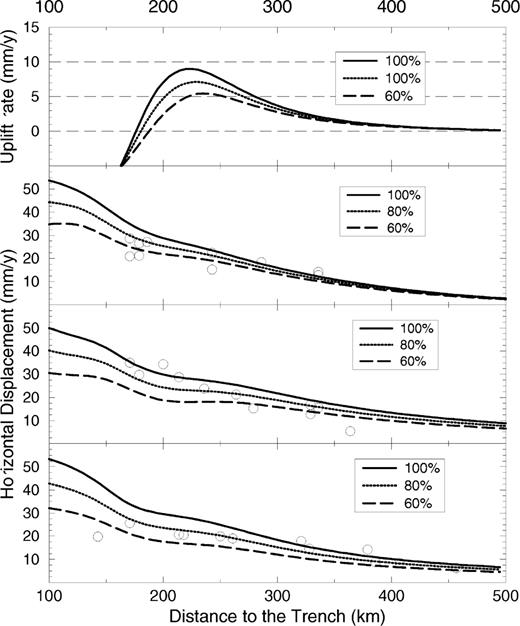
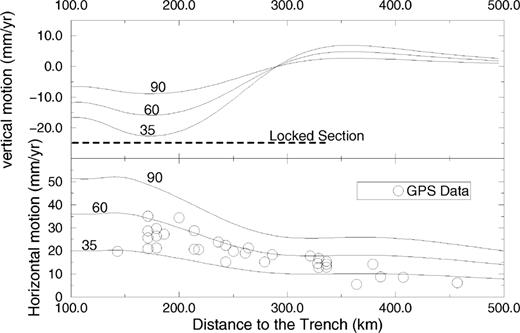
Elastic modelling of northern Japan based on the geometry of Fig. 7. On the three lower graphs the variation of the modulus of the horizontal velocity with distance to the subduction front is plotted for three cross-sections in Kanto, Tohoku and Hokkaido (see Fig. 7 for locations). GPS data are indicated by circles. Computed curves are given for 100, 80 and 60 per cent coupling. The graph at the top shows the computed vertical motion for the Kanto cross-section.
Discussion Of The Reference Frame
To quantify the transient interseismic motion vectors, we have used Eurasia as a reference frame. Many authors believe that northern Honshu and Hokkaido belong either to north America (e.g. DeMets 1992) or to an independent platelet called Okhotsk (Seno et al. 1996). Either choice results in a westerly motion of about 10mmyr−1 of northern Honshu and Hokkaido with respect to Eurasia. As a result, the GPS velocities with respect to northern Honshu, which presumably mostly measure the interseismic loading velocities, are reduced by about 30 per cent to the east of north Honshu but by 100 per cent to the west (see Fig. 9, bottom). However, the strain rates are not affected by the frame of reference. We have computed the average principal geodetic strain rates over 50km intervals and have compared them to predicted rates for various coupling velocities on the subduction interface. The top part of Fig. 9 shows that the measured strain rates are not compatible with velocities on the coupling interface that are less than 70mmyr−1. However, the bottom part of Fig. 9 shows that coupling velocities of about 70mmyr−1 predict interseismic velocities that fit the GPS velocities within the Eurasian reference frame, as was demonstrated previously, but they are about 10mmyr−1 larger than the velocities measured within the Okhotsk frame. In other words, the gradients are too large to be compatible with small coupling velocities and consequently with a north American or Okhotsk reference frame.
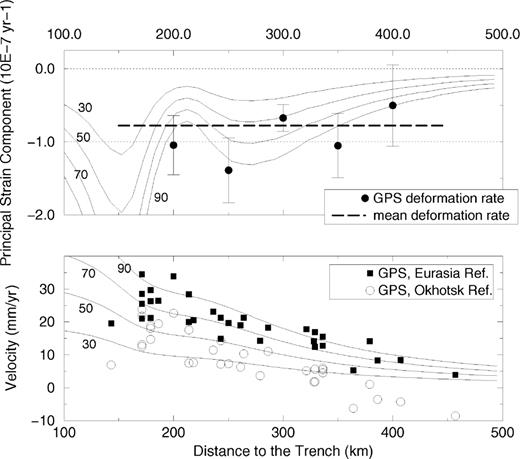
Top: principal strain rates across northern Japan. The measured rates on northern Honshu have been averaged over portions of 50km according to their distance from the trench. The computed rates are obtained for coupling velocities of 30–90mmyr−1. The mean principal strain rate is a little less than 1×10⁻⁸yr−1. These rates cannot be matched with coupling velocities less than about 70mmyr−1. Bottom: measured horizontal velocities from northern Honshu within the Eurasian and Okhotsk reference frames. The velocities in the Okhotsk reference frame are not compatible with simple elastic loading of the subduction interface, whereas velocities within the Eurasian frame are.
One could argue that the relatively large gradients of westward transient velocity to the west of north Honshu are due to elastic loading in the opposite direction by the east Japan Sea convergent tectonic zone. To test this possibility, we computed the elastic loading due to a convergence of 10mmyr−1 in this tectonic zone. It is known that there is no continuous subduction interface there because the vergence of thrusting earthquakes alternates between east and west (e.g. Mendoza & Fukuyama 1996; Hashimoto et al. 1993). In order to obtain the geometry of the thrusting zone, we assumed that it would be similar to the geometry of the 1993 7.8 earthquake that occurred southwest of Hokkaido. We used the fault model of Hashimoto et al. (1993) and tested both eastward- and westward-dipping planes (parameters: strike N005°, dip 10°, coupling depth 10–21km). In the case of westward dip, the predicted effect is null on the northwestern Honshu coast. Even in the case of an eastward-dipping surface, because the lower limit of the seismogenic fault is fairly high (less than 30km), the locked zone does not extend below the Japanese Islands and thus the net effect on western north Honshu is less than 1mmyr−1. We conclude that the effect from the interseismic loading of the Japan Sea convergent tectonic zone does not play a significant role in the transient velocity field of western north Honshu and that the GPS data do not seem to be compatible with north Honshu and Hokkaido belonging to the north American Plate or the Okhotsk Plate. Rather, the Japan Sea appears to be moving eastwards with the Amur Plate at a velocity of 5–10mmyr−1, based on the GPS velocity in Korea [7.5mmyr−1 towards the east with respect to Eurasia in Daejon; JPL GPS solution as given by Heflin (1997)]. Thus, the eastward limit of the Amur Plate would approximately follow the 0 isovelocity contour in Fig. 1.
Comparison With Previous Studies
The problem is to understand why previous studies concluded that the coupling coefficient along the Japan Trench subduction zone was of the order of 30 (Shimazaki 1974; Kato 1979; Seno 1979a) to 35–60 per cent Shen Tu & Holt 1996), whereas we find a coupling coefficient of 70–80 per cent.
The most recent study of Shen Tu & Holt (1996) is based on trilateration and triangulation surveys over the last century. As pointed out by the authors, large historical intraplate earthquakes such as the 1896 Rikuu and the 1964 Niigata earthquakes have affected the area during the period of measurement. The authors have tried to correct for these but their corrections are quite uncertain, as they pointed out. With the corrections, they find a best slip rate on the subduction zone of 33–41mmyr−1 (16–66mmyr−1 at the 95 per cent confidence limit) compared to 70mmyr−1 for this paper. Without the corrections, the best rates obtained are 15 per cent higher (45–53mmyr−1). However, they did not apply any correction for large interplate earthquakes which occurred during the same period (Kato 1979).
The average corrected geodetic principal strain rates used by Shen Tu & Holt (1996) do not exceed 3–5×10⁻⁸yr−1 compared to 8–12 × 10−8 yr−1 for the GPS data, and the geodetic velocity vectors derived decrease from 12mmyr−1 to the east to 6mmyr−1 to the west, compared with 30–10mmyr−1 with the GPS data we used. We conclude that the difference results from differences in the data used and that it is most probably the result of the effects of the large subduction earthquakes which have affected the data during the century of geodetic measurements used by Shen Tu & Holt (1996).
The net geodetic strain measured over one century does not include the elastic strain which has been released by large subduction earthquakes. Thus, the coupling velocity estimated from the strain measurements does not include the seismic slip on the subduction planes. Consequently, one should sum the amount of motion released during these earthquakes with the amount given by the modelling of the elastic strain to obtain the total coupled motion. The range of the seismic coupling coefficient obtained from seismological data is 25–50 per cent Peterson & Seno 1984; Pacheco et al. 1993; Sykes & Quittmeyer 1981). Then the sum of both estimations (25–50 per cent+35–60 per cent) gives a quasi-total coupling within the uncertainties, which agrees well with our estimations based on short-term measurements.
Shimazaki (1974), Kato (1979) and Seno (1979a) mostly relied on the fit of the measured subsidence during the same period of time to constrain the coupling factor. They consequently had the same problem with perturbations by large earthquakes [see for example the post-seismic effect of the Rikuu earthquake in Thatcher et al. (1980) and Rydelek & Sacks (1990)]. Because the subsidence in the northern part of north Honshu extends over the whole eastern part of the island, they had to assume that the locked part of the subduction zone extends to 120km depth, beyond the volcanic front, which seems difficult. This led Kato to assume a coupling velocity of 35mmyr−1 on the subduction interface. The effect of adopting such a deep locked subduction interface is shown in Fig. 10. It does account for the subsidence of a little less than 5mmyr−1 over the eastern part of the island with a coupling velocity of 35mmyr−1, but this velocity fails to fit the horizontal motion and gives principal strain rates that are too low. Kato realized that such a very deep locked zone was unlikely. He consequently assumed alternatively that the subduction interface was pulled vertically downwards between about 65 and 100km. Using this solution, Seno found that he had to use a 21mmyr−1 coupling velocity to 65km depth along the coupling interface. However, if one has to introduce another unexplained phenomenon, such as a downward vertical pull, to explain the data, the solution becomes largely unconstrained.
Motions predicted for a locked zone extending downwards to 120km for loading velocities of 35, 60 and 90mmyr−1. Top: vertical motion rate. The 35mmyr−1 loading velocity fits the secular subsidence obtained from triangulation data by Kato (1979). However, the corresponding predicted horizontal velocities do not fit the GPS data over northern Honshu.
If the discrepancy between long-term and short-term estimations is confirmed, it might be explained in the following way. Physical coupling at a given time and a given location is always full or non-existent. However, spatial variation at a given time may exist with full coupling at asperities and no coupling in between, which may appear locally at the surface as partial coupling. A second possibility is that the total integrated coupling during the full seismic cycle is less than predicted by full coupling because of temporal variations in the rate of viscous processes.
Discussion
Fig. 11 schematizes data, model assumptions and the results we obtain for a north Honshu E–W cross-section. Fig. 11(a) displays the instantaneous kinematics. The instantaneous westward velocity of the Pacific Plate with respect to Eurasia is 92mmyr−1; the instantaneous velocity drops to 35mmyr−1 on the eastern shore of northern Japan and progressively decreases across northern Japan to 10–15mmyr−1 on the western shore of northern Japan. The Japan Sea floor probably has a velocity of 5–10mmyr−1 towards the east with respect to Eurasia, as seen above. The instantaneous convergence in the Eastern Japan Sea convergence zone is thus about 10 to 15+5 to 10, that is 20±5mmyr−1. We have shown that the GPS instantaneous velocity field over Japan, in the Eurasian frame, can be accounted for by our elastic modelling with a coupled subduction velocity of 70mmyr−1 [Fig. 11(b)].
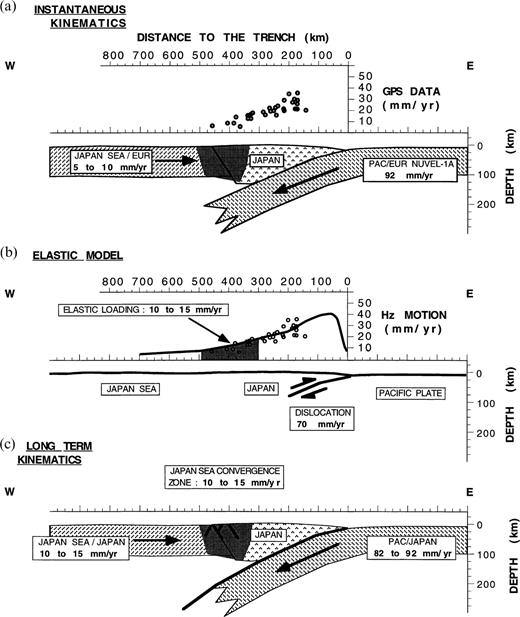
Schematized cross-sections across the Pacific–northern Japan–Japan Sea system. (a) Instantaneous kinematics, plate motion and GPS data, given in the Eurasia reference frame. The GPS data are the same as in Fig. 8. (b) Elastic model for a dislocation of 70mmyr−1 on the Japan Trench subduction plane. Modelled velocities are taken from the model in Fig. 8. (c) Long-term kinematics. Plate motions are with respect to Japan. The Eastern Japan Sea convergence zone is shown in grey.
Fig. 11(c) displays the long-term kinematics over the same section. Shen-Tu et al. (1995) found a velocity of 5.6±1.5mmyr−1 based on seismic data between northern Honshu and the Sea of Japan, which may underestimate the actual convergence velocity. Hashimoto & Jackson (1993) modelled 100years of triangulation data over Japan with elastic blocks. They found that northern Honshu had a permanent velocity of 12–13mmyr−1 with respect to the Japan Sea. Thus, these results suggest long-term convergence between the Japan Sea floor and northern Honshu at a rate of 10–15mmyr−1. Taking into account the 5–10mmyr−1 eastward motion of the Japan Sea with respect to Eurasia, the actual long-term relative velocity along the subduction plane should be 92+5 to 10−10 to 15, that is between 82 and 92mmyr−1. The convergence in the Eastern Japan Sea thus decreases the subduction velocity, and results in a slightly higher coupling factor (75–85 per cent) between north Honshu and the Pacific Plate than in our first estimate. The 10–15mmyr−1 long-term plastic deformation in the Eastern Japan Sea convergence zone represents two-thirds of the 20±5mmyr−1 instantaneous convergence velocity. This suggests that a significant part of the strain applied to this deformation zone by elastic loading remains as plastic deformation.
In the Nankai Trench area, the horizontal velocity with respect to Europe and due to elastic loading is 10–15mmyr−1 (of which about 5mmyr−1 corresponds to strike-slip motion) at the southern limit of the Setouchi deformation zone. According to GPS data, the instantaneous strike-slip motion across the Setouchi deformation zone is about 15mmyr−1 (Fig. 5). This 15mmyr−1 total strike-slip motion may be accounted for by adding the 5–10mmyr−1 eastward motion of the Japan Sea with respect to Eurasia (assuming that southwest Japan north of the Setouchi deformation zone moves with the Japan Sea) and the 5mmyr−1 motion caused by elastic loading from the trench. Geological estimates from trenching on the Median Tectonic Line (the MTL marks the southern limit of the zone of plastic deformation) are 5–9mmyr−1 (Okada 1980). The long-term motion accommodated in the whole deformation zone, including what is absorbed in the Setouchi Sea, is higher than 5–9mmyr−1, implying that more than half of the instantaneous strike-slip motion remains as plastic deformation.
Except for the obliquity of convergence in the Nankai region, which favours shear partitioning, kinematics of the Setouchi deformation zone and of the Eastern Japan Sea convergence zone appear similar. Both zones are located where the rate of elastic loading from the trench reaches 10–15mmyr−1, and both accommodate 10–15mmyr−1 of permanent deformation. These deformation zones thus lie near the limit of the zone where significant stress fluctuations occur in relation to the subduction earthquake cycle. We infer that the earthquakes there are triggered by elastic loading from the subduction thrust plane.
This model has further implications that may be investigated. First, in the Setouchi deformation zone, compression, as well as strike-slip motion, is implied by the elastic model. Because the MTL is not vertical but dips about 30° to the north (Ito et al. 1996), a thrusting component may be expected on this fault. Second, the probability of earthquake occurrence in the Eastern Japan Sea convergence zone should be higher near the end of the seismic cycle in the Japan Trench. If there is such a relationship, earthquakes in this remote zone may occur as precursors of subduction earthquakes, but rather than trigger earthquakes in the trench, these would merely indicate that the accumulated stress is close to the rupture threshold. This kind of earthquake sequence has been studied by different authors in southwestern Japan. Shimazaki (1976), Seno (1979b) and Hori & Oike (1996) showed that the seismic activity in and landwards of the trench was high before the great Nankai earthquakes, whereas Mogi (1987), Kanaori et al. (1993) and Kanaori & Kawakami (1996) suggested a southward migration of the seismic activity, from Central Japan to the Nankai Trough. Similarly, in northern Honshu, Shimazaki (1978), Seno (1979a) and Rydelek & Sacks (1990) have pointed out that earthquakes landwards of the trench tend to occur systematically earlier than the great subduction earthquakes. Rydelek and Sacks found a statistically significant peak of 36years for this time lead and attributed it to stress diffusion from the land earthquakes by viscoelastic coupling. Thus, in their model, land earthquakes would also tend to occur near the end of the subduction loading cycle but would actually trigger the subduction earthquakes.
Conclusions
Most of the Japan GPS velocity field within the Eurasian reference frame can be accounted for by a simple elastic coupling model along the Pacific and Philippine Sea subduction planes. The necessary coupling factor is 100 per cent over the Nankai subduction zone and 75–85 per cent over the Japan subduction zone.
Only a minor part of this deformation is permanent plastic deformation, except in the two main deformation zones that are known from geology (the Eastern Japan Sea convergence zone and the Setouchi plus MTL deformation zone) and probably also in central Japan, where the collision with the Izu–Bonin arc adds complexity (but this is not part of the present study). In the two main deformation zones, from half to two-thirds of the total deformation applied remains as permanent plastic deformation. Our computations indicate that long-term convergence in the Eastern Japan Sea deformation zone as well as long-term strike-slip motion along the Setouchi plus MTL deformation zone are half due to the motion of the Amur Plate (5–10mmyr−1) and half due to elastic loading from the subduction trench. There is no need to invoke a velocity larger than 10mmyr−1 for the Amur Plate Wei & Seno 1998; Seno et al. 1996; Savostin et al. 1983).
The relationship found between elastic loading and long-term plastic deformation suggests that the probability of earthquake occurrence in the Eastern Japan Sea convergence zone and the Setouchi plus MTL deformation zone may be correlated with the subduction earthquake cycle. Sequences of earthquakes starting in deformation zones on land and ending with subduction earthquakes may thus occur. Sequences in the reverse order could not be explained by the elastic loading models because these models predict a general decrease in stress after a subduction earthquake. Our main conclusion that most of the deformation in Japan may be accounted for by the stresses applied from the trench opens interesting possibilities of dynamic modelling using more sophisticated rheologies than the homogenous elastic medium we chose for simplicity.
Acknowledgements
The authors are grateful to the Director of the Geographical Survey Institute, Japan, for making available the data used in this study. We thank F. Pollitz for preliminary computations on elastic coupling that indicated the possibility of explaining most of the GPS velocity field as we did in this paper. We thank R. Gaullon for providing us with the core of the computer code. F. Pollitz and T. Seno provided very useful reviews. This research was sponsored by Collège de France and JSPS as well as CNRS, Ifremer and Ministère des Affaires Etrangères.
References
Author notes
Now at: Research Center for Earthquake Prediction, Disaster Prevention Institute, Kyoto University, Uji, Kyoto 611, Japan.
