
Abstract
Forests are a substantial terrestrial carbon sink, but anthropogenic changes in land use and climate have considerably reduced the scale of this system1. Remote-sensing estimates to quantify carbon losses from global forests2,3,4,5 are characterized by considerable uncertainty and we lack a comprehensive ground-sourced evaluation to benchmark these estimates. Here we combine several ground-sourced6 and satellite-derived approaches2,7,8 to evaluate the scale of the global forest carbon potential outside agricultural and urban lands. Despite regional variation, the predictions demonstrated remarkable consistency at a global scale, with only a 12% difference between the ground-sourced and satellite-derived estimates. At present, global forest carbon storage is markedly under the natural potential, with a total deficit of 226 Gt (model range = 151–363 Gt) in areas with low human footprint. Most (61%, 139 Gt C) of this potential is in areas with existing forests, in which ecosystem protection can allow forests to recover to maturity. The remaining 39% (87 Gt C) of potential lies in regions in which forests have been removed or fragmented. Although forests cannot be a substitute for emissions reductions, our results support the idea2,3,9 that the conservation, restoration and sustainable management of diverse forests offer valuable contributions to meeting global climate and biodiversity targets.
Main
The continuing climate and biodiversity crises threaten ecosystems and human society10,11. Representing 80–90% of the global plant biomass1 and much of Earth’s terrestrial biodiversity12, forests play a key role in both climate-change mitigation and adaptation. So far, humans have removed almost half of Earth’s natural forests13,14, and we continue to lose a further 0.9–2.3 Gt C each year (about 15% of annual human carbon emissions) through deforestation15. In response to these pressing challenges, international environmental initiatives such as the UN Decade on Ecosystem Restoration16, the Kunming-Montreal Global Biodiversity Framework17 and the Glasgow Leaders’ Declaration on Forests and Land Use18 have been established to reduce deforestation and revitalize ecosystems. A key step in guiding such environmental targets is gaining a comprehensive understanding of the global distribution of existing forest carbon stocks, as well as the potential for carbon recapture if healthy ecosystems are allowed to recover3,19.
Remote-sensing observations have been central to the development of spatially continuous models of global forest biomass2,7,8. Building on these satellite-derived observations, a growing body of research has begun to use statistical extrapolations to estimate the potential extent of forest carbon stocks under natural conditions2,3,4. In recent years, refs. 3,4 combined remote-sensing forest-area estimates with coarse (ecoregion-level or country-level) carbon-storage estimates to approximate the global carbon potential. More recently, Walker et al.2 used satellite-derived biomass estimates from natural forested regions to statistically extrapolate potential forest biomass in the absence of human disturbance. Despite yielding carbon potential estimates ranging from 200 to 300 Gt C, inherent strengths and weaknesses of each approach have given rise to uncertainty across studies, with suggestions that these estimates may be up to 4–5 times too high5,9,20,21. As a result, confidence in the carbon potential of forest ecosystems remains low. Without an independent, bottom-up assessment of global forest carbon potential built directly from ground-sourced data, evaluating and benchmarking these satellite-derived trends remains challenging. Overcoming this controversy requires consideration of various independent approaches to identify the extent of confidence and uncertainty across different land uses around the world.
Another key challenge in the development of potential biomass estimates is how to approximate the ‘natural’ state of vegetation stocks. To do this, recent extrapolations of forest potential have been built from data collected in protected land3 or areas with minimal human disturbance2. However, a limitation of such approaches is that the focus on undisturbed areas restricts data to a few regions, which can bias results towards environments systematically avoided by humans. Protected areas may, for example, often exist in regions of marginal agricultural value or that possess unique ecological features22. An alternative approach to avoid such biases is to use observations across the full gradient of human disturbance and then use statistical techniques to remove the human footprint23. This method has proved successful in assessing the impact of historical human land use on soil carbon storage23. By allowing the inclusion of larger datasets across a broader range of environmental conditions, this approach has the potential to improve the statistical strength of biomass potential estimates. Consideration of the results from these different modelling datasets and approaches will be necessary to develop a comprehensive understanding of the global forest carbon potential.
Here we used a combination of independent modelling approaches to generate spatially explicit estimates of potential forest biomass worldwide. The first set of analyses was based on ‘bottom-up’ models built directly from ground-sourced (denoted GS) aboveground live biomass estimates from forest inventory data of the Global Forest Biodiversity initiative (GFBI)6. This was contrasted with three ‘top-down’ models built from the latest satellite-derived (denoted SD), high-resolution aboveground forest biomass maps, namely, the European Space Agency’ Climate Change Initiative (ESA-CCI)7, Walker et al.2 and harmonized8 products. As our GS model operates independently from satellite information, it serves as a benchmark for evaluating the satellite-driven approaches. For all four datasets, we then approximated forest biomass under hypothetical natural conditions through two distinct methods: (1) representing human-disturbance indices as independent variables (model type 1) and (2) building models exclusively using data from undisturbed areas (model type 2). We define ‘natural’ forest potential as that which might exist in the absence of extensive anthropogenic degradation. Using each of these databases, we then scaled to total forest carbon potential using spatially explicit global estimates of root mass fraction24, soil carbon potential23 and biome-level estimates of dead wood and litter19. By contrasting these diverse approaches and comparing the results against previous evaluations using a meta-analysis, we aimed to provide an integrated assessment of the natural forest carbon potential.
Mapping the human impact on tree biomass
The underlying goal of our analysis was to investigate the impact of human land-use change on forest carbon stocks globally. Of course, many indigenous populations and local communities live in sustainable harmony with natural forests, often with beneficial impacts on ecosystem structure. However, we aimed to isolate the effects of extensive land-use change and anthropogenic degradation. To achieve this, we used a partial-regression approach in the first step, testing for the relationship between aboveground forest biomass and anthropogenic degradation, while controlling for the effects of climate, topography and soil conditions (Fig. 1d,g and Methods). This analysis revealed a consistent decline in tree carbon density along the anthropogenic degradation gradient across all biomes, evident in both the ground-sourced and the satellite-derived biomass observations (Fig. 1e,h).

a, Map of ground-sourced aboveground tree carbon observations (GFBI data; aggregated to 30-arcsec (1-km2) resolution). b, Satellite-derived ESA-CCI map of current aboveground tree carbon stocks (1-km resolution). c,f, Observed biome-level tree carbon densities in existing forests based on ground-sourced (c) and satellite-derived (f) data. d,g, Principal component analysis (top two principal components shown) of the eight human-activity variables either directly or indirectly reflecting human-caused forest disturbances or the lack thereof, such as land-use change, human modification, cultivated and managed vegetation and wilderness area, to detect the effect of human disturbance on tree carbon densities for the ground-sourced (d) and satellite-derived data (g). e,h, Partial regression of the global variation in forest carbon density along the human-disturbance gradient (represented by the first principal component of the eight human-activity variables; see panels d and g) for the ground-sourced (e) and satellite-derived data (h), controlling for 40 environmental covariates. Relative carbon density is the observed carbon density divided by the global average.
Our GS models of potential forest biomass combine plot-level aboveground forest carbon measurements with spatially explicit data reflecting climate, soil conditions, topography, forest canopy cover and human disturbance, using random-forest machine-learning models to interpolate our biomass measurements across the globe (see Methods). In the first set of models (GS1), we estimated the global forest carbon potential in the absence of human activity by statistically accounting for the impact of human disturbance23, setting all variables directly reflecting human disturbance to zero. By contrast, the second set of GS models (GS2) extrapolated the global forest carbon potential from data derived from protected areas with minimal human disturbance2,3. To account for uncertainties in canopy-cover estimates from the forest inventory plots, we incorporated upper and lower boundaries of canopy cover in each pixel, resulting in a total of four GS models: GS1Upper, GS1Lower, GS2Upper and GS2Lower. We extended this combination of approaches to evaluate the biomass potential for each of the three satellite-derived biomass products (ESA-CCI, Walker et al. and harmonized). The models included either all terrestrial regions (SD1) or only regions with minimal human disturbance (SD2), using the same set of predictor variables as covariates included in the GS models. This resulted in a total of six SD models: SD1ESA-CCI, SD1Walker, SD1Harmonized, SD2ESA-CCI, SD2Walker and SD2Harmonized.
The full combination of models allowed us to disentangle the effects of deforestation and forest degradation on tree carbon losses while representing data and model uncertainties. The total tree carbon potential was determined by summing the forest carbon that would naturally exist (1) outside existing forests (restoration potential) and (2) in existing, degraded forests (conservation potential). The resulting maps provide models of tree carbon potential under current (1979–2013) climate conditions in the hypothetical absence of human disturbance (Fig. 2a).
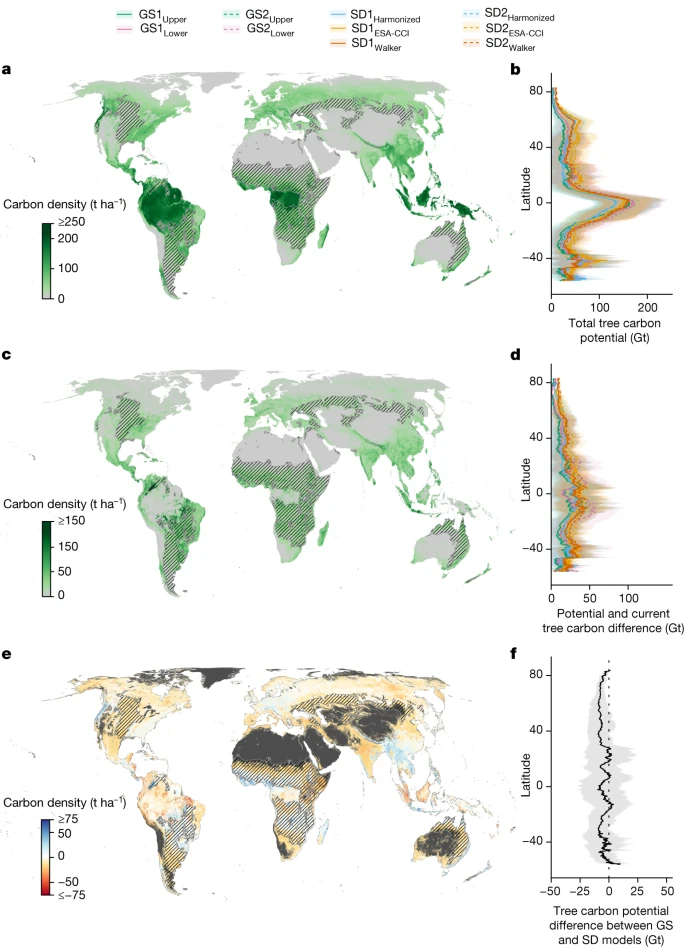
a,b, The total living tree carbon potential of 600 Gt C within the natural canopy cover area of 4.4 billion ha2. c,d, The differences between current and potential tree carbon stocks, totalling 217 Gt C. e,f, The difference of tree carbon potential between the GS and SD models, subtracting the mean values of the six SD models from the mean values of the four GS models. Blue colours indicate that the GS models predict higher potential than the SD models, whereas red colours indicate the opposite. b,d,f, Latitudinal distributions (mean ± standard deviation) of the total tree carbon potential for the GS1, GS2, SD1 and SD2 models (b), the difference between current and potential tree carbon (d) and the difference of tree carbon potential between the GS and SD models (f). Maps represent the average estimates across all GS and SD models and are projected at 30-arcsec (about 1-km2) resolution. We show dryland and savannah biomes with stripes to denote that many of these areas are not appropriate for forest restoration. Where trees would naturally exist, they often exist far below 100% canopy cover, and restoration of forest cover should be limited to natural conditions.
The coefficients of variation from a bootstrapping procedure showed that existing and potential carbon stocks were estimated with confidence across all models. For 90–100% of the pixels inside the existing and potential forest area, the coefficients of variation were below 20% (Supplementary Figs. 1 and 2). A spatial-validation procedure (spatially buffered leave-one-out cross-validation (LOO-CV)), accounting for the potential effects of spatial autocorrelation on model-validation statistics, showed that the GS and SD models explained 70–77% or 82–87% of the spatial variation in tree biomass, respectively (Supplementary Table 1 and Supplementary Fig. 3). Furthermore, when specifically considering disturbed regions with human-disturbance levels ranging from 10% to 60%, the explained variation in tree biomass remained high (>60%), showing that our models effectively captured the variation of carbon stocks in regions with high human footprint (Supplementary Fig. 4).
Comparison between models
Despite discrepancies in certain regions, there was high overall agreement between the ground-sourced and satellite-derived biomass estimations at the global scale (average R2 of 0.72 at a spatial resolution of approximately 1 km2; Supplementary Figs. 5–9). This agreement translated to similar estimates of existing live tree biomass: 367 Gt C (model range = 334–400 Gt C) for the GS models and 394 Gt C (model range 355–445 Gt C) for the SD models (<7% difference). A comparison of existing biomass estimates across the latitudinal gradient also showed high inter-model consistency, with the GS model predicting slightly higher biomass values than the SD model for the equatorial zone and lower biomass values at high-latitude regions of the Southern Hemisphere (>40 °S) (Supplementary Fig. 6). On average, the models predicted that 69% of live tree biomass is stored in tropical regions, with temperate, boreal and dryland regions accounting for 18%, 11% and 1%, respectively (Supplementary Table 3).
Using all sets of GS and SD models, we could estimate the total potential living tree carbon that would exist in the absence of human influence. Our models projected considerable gains in the hypothetical natural forest biomass, with a mean estimate for total potential living tree carbon of 600 Gt C (model range = 487–712 Gt C). The individual model estimates were as follows: GS1Upper = 487 Gt C, GS1Lower = 595 Gt C, GS2Upper = 517 Gt C, GS2Lower = 647 Gt C, SD1Harmonized = 552 Gt C, SD1ESA-CCI = 578 Gt C, SD1Walker = 669 Gt C, SD2Harmonized = 596 Gt C, SD2ESA-CCI = 645 Gt C and SD2Walker = 712 Gt C (Figs. 3 and 4 and Supplementary Tables 2 and 3). The highest estimates were derived from the Walker et al.2 map, with the GS, harmonized biomass and ESA-CCI estimates being 19%, 17% and 11% lower, respectively. Overall, we predict that, under current climate conditions, a further 217 Gt (model range = 153–267 Gt) of living tree carbon could potentially exist in the absence of humans (Fig. 5b). Of this potential, 123 Gt C (99–153 Gt C) can be attributed to tropical regions, 55 Gt C (40–66 Gt C) to temperate regions, 14 Gt C (5–25 Gt C) to boreal regions and 25 Gt C (9–41 Gt C) to dryland regions (Supplementary Table 3).

a, Total estimated living tree biomass potential of the GS1, GS2, SD1 and SD2 models. Error bars represent the lower and upper boundaries based on the 5% and 95% quantiles from a bootstrapping procedure. Colours represent the different input datasets, that is, upper or lower canopy cover boundaries (GS models) and ESA-CCI, Walker et al.2 or harmonized (SD models). Light colours above white lines indicate the difference between current and potential tree carbon stocks. b, Meta-analysis showing literature estimates of living tree carbon potential based on ensemble models4,53,54, inventory data19,55,56,57,58,59,60,61 and mechanistic62,63,64,65,66,67 or data-driven2 models. The horizontal dashed line represents the average existing living tree carbon of 443 Gt C estimated in these publications. c, Differences between current and potential tree carbon stocks. d, Literature estimates for the difference between current and potential tree carbon stocks from ref. 4 (ensemble models), refs. 1,53,58,61 (inventory data), refs. 63,64 (mechanistic models) and ref. 2 (data-driven models).

a,b, Relative contribution of individual uncertainty sources to the overall uncertainty in carbon potential for the GS (a) and SD (b) models: (1) model approach (type 1 versus type 2 models); (2) input data (current aboveground tree carbon input, that is, upper and lower canopy cover boundaries for GS models and ESA-CCI, Walker et al.2 and harmonized for SD models); (3) aboveground biomass potential estimates (bootstrapping); (4) belowground biomass (accounting for uncertainties in both root mass fraction and aboveground biomass); (5) dead wood and litter (accounting for uncertainties in both dead wood and litter-to-tree biomass ratios and tree biomass); and (6) soil organic carbon potential23. The maps show the top uncertainty source within each pixel. The pie charts show the relative contribution of uncertainties worldwide.

a, Of the 328 Gt C discrepancy between current and potential carbon stocks, 226 Gt C is found outside urban and agricultural (cropland and pasture) areas, with 61% in forested regions in which the recovery of degraded ecosystems can promote carbon capture (conservation potential) and 39% in regions in which forests have been removed (restoration potential). b, Relative contribution of forest degradation (conservation potential; blue area) and land-cover change (orange colours) to the difference between current and potential ecosystem-level carbon stocks. The darker blue area represents the conservation potential of 10.5 Gt C in forest plantation regions. c, Relative contribution of tropical, temperate, boreal and dryland forests to the total forest conservation potential. d, Relative contribution of the three main carbon pools (living biomass, dead wood and litter, and soil) to the difference between current and potential carbon stocks. e, The nine countries contributing more than 50% to the difference between current and potential carbon stocks.
Despite the broad consensus on the global top-down and bottom-up carbon potential estimates, considerable spatial variations were observed in the models. The SD models tended to predict higher potential carbon stocks than the GS models across 82% of pixels, particularly in South American tropical forests (Fig. 2e,f), suggesting possible overestimation of satellite-derived biomass potential in these regions. More ground-sourced data are needed from tropical areas to improve accuracy and balance the high sample sizes available for temperate regions7,25. On the other hand, the GS models predicted slightly higher potential than the SD models in subtropical regions and temperate forests of Europe.
We also show that the type 1 models (GS1 and SD1) predicted a 47 Gt C lower potential than the type 2 models (GS2 and SD2; Fig. 3). The focus on ‘undisturbed’ regions in the type 2 models may introduce bias by favouring regions with unusually high biomass. By contrast, the type 1 models incorporated observations across the full human-disturbance gradient, potentially resulting in an underestimation of potential in regions with incomplete historic-disturbance data. Furthermore, we imposed a constraint on forest biomass potential by limiting forest growth to the potential tree cover range projected in a previous analysis3. If this spatial constraint is removed to compare our model with the estimate of Walker et al.2 of 796 Gt C (without such constraints), our SD2Walker model generates a similar total potential of 760 Gt C (<5% difference). Thus, our mean estimate of Earth’s total potential living tree carbon of 600 Gt C from the ensemble of modelling approaches is probably conservative.
Total ecosystem carbon potential
To determine the total carbon storage potential of natural woody ecosystems, we converted our estimates of living tree biomass into total ecosystem carbon stocks by incorporating global data on soil carbon23, dead wood and litter19. To represent the various sources of uncertainty (Fig. 4), we considered: (1) model type (types 1 and 2); (2) input data (upper and lower canopy cover boundaries for GS models; ESA-CCI, Walker et al. and harmonized for SD models); (3) aboveground biomass potential (bootstrapping); (4) tree root biomass; (5) dead wood and litter; and (6) soil carbon23. The GS and SD models exhibited similar uncertainty contributions globally, with 21.2% and 19.0% attributed to aboveground living tree biomass potential, 21.6% and 23.9% to dead wood and litter, 22.8% and 20.7% to aboveground biomass input data, 15.0% to soil carbon, 12.1% and 11.8% to root biomass and 7.3% and 9.6% to model type. Soil carbon emerged as the primary source of uncertainty in regions with high latitudes and elevation. By contrast, aboveground biomass input data and dead wood and litter were the primary sources of uncertainty in dry and humid tropical areas, respectively (Fig. 4).
Considering all carbon pools together, we estimate that current forest carbon storage is 328 Gt (221–472 Gt) lower than the full natural potential (Fig. 5 and Table 1). Of this difference, 226 Gt C (151–363 Gt C) exist outside urban and agricultural areas, with 61% in forested regions in which sustainable management and conservation can promote carbon capture through the recovery of degraded ecosystems and 39% in regions in which forests have been removed (Table 1). These estimates highlight that forest conservation, restoration and sustainable management can help achieve climate targets by mitigating emissions and enhancing carbon sequestration.
Carbon potential in existing forests
Previous work has suggested that up to 80% of the world’s forests are secondary systems that have undergone anthropogenic degradation26. Our models corroborate these findings, revealing a considerable potential for carbon capture in existing forests by allowing these degraded ecosystems to regenerate to maturity. The difference between current and potential ecosystem carbon stocks amounts to 139 Gt C (108–228 Gt C) in existing forests, representing 61% of the total difference when excluding urban and agricultural areas (Table 1). Of the total 139 Gt, 11 Gt (8%) can be attributed to biomass loss in existing forest plantations, in which restoring diverse ecosystems could lead to further carbon capture. The remaining 128 Gt can be attributed to human degradation in other forest ecosystems. These findings highlight the importance of forest conservation for carbon capture, as ecosystems are allowed to recover to their mature states. It suggests that a substantial proportion of carbon capture can be achieved with minimal land-use conflicts. However, it is essential to acknowledge that the demand for wood and other forest-based products imposes limitations on this potential, given their climate benefits as substitutes for carbon-intensive materials such as fossil fuels and concrete5. Nonetheless, evidence shows that reductions in harvesting intensity and forest degradation can deliver important climate benefits27. Moreover, our model might underestimate the extent of degradation owing to challenges in capturing historical land-use legacies and limited data availability on plantations in certain countries28. These observations reinforce the importance of effective forest conservation and management not only in reducing future carbon emissions15,29 but also in removing carbon that has already been released into the atmosphere.
Carbon potential in converted lands
In areas in which forests have been removed, the difference between the current and potential forest carbon stocks amounts to 189 Gt C (112–269 Gt C). Of this difference, 30% (57 Gt C) can be attributed to cropland areas, 28% (53 Gt C) to areas experiencing low anthropogenic pressure at present, 23% (43 Gt C) to pasture land, 18% (34 Gt C) to rangeland and 1% (2 Gt C) to urban areas (Fig. 5, Table 1 and Supplementary Fig. 10). It is important to recognize that the scale of this potential is contingent on social land-use constraints. Socially responsible ecosystem restoration must be driven by the land-use decisions of local communities, especially indigenous communities that often face marginalization. Sustainable economic development that promotes approaches that work with nature (for example, agroforestry, ecotourism etc.) can provide critical avenues for long-term financial security as a result of healthy nature. Also, it is important to acknowledge that forests can lead to reductions in surface albedo30,31, which generally have warming effects in high-latitude regions. Conversely, the local biophysical cooling effects of forests in warmer regions32 probably enhance the climate-adaptation benefits in the global south.
Taking into account the future food and feed demand, the Intergovernmental Panel on Climate Change (IPCC) highlights a range of measures to improve ecosystem health and carbon storage in the land-use sector33. This will require a diverse range of approaches, including sustainable diets, reducing food waste, rewetting, improved soil health, methane reduction and promoting the use of wood in construction. We estimate that approximately 41% of the difference between current and potential ecosystem carbon stocks outside existing forests, within the areas of the world that would naturally be forested, can be attributed to livestock grazing areas (pasture and rangelands). Also, 36% of the world’s crop yields are being used for animal feed34. This impact of animal husbandry on forest ecosystems underscores the potential implications of transitioning to more plant-based diets. Besides reducing greenhouse gases that directly stem from animal farming (methane emissions, food production), a reduction in meat consumption could reduce emissions from land-use change and create large carbon sinks if ecosystems were allowed to regenerate on former pasture lands35,36.
Comparison with previous estimates
Our integrated estimate of the difference between current and potential global living tree biomass (217 Gt C) falls at the lower end of the range of previous estimates, which ranged from 150 to 446 Gt C (Fig. 3c,d). Also, our estimate of the extra potential for total ecosystem carbon storage outside urban and agricultural land (226 Gt C) aligns closely with recent global-scale estimates of 205 and 287 Gt C (refs. 2,3). However, it is worth noting that three previous data-driven approaches, not included in this meta-analysis because of methodological differences, have suggested carbon potential values below this range. Specifically, Lewis et al.9 considered more rigorous social constraints and estimated that natural restoration of 350 Mha of deforested, tropical land could capture 42 Gt C in living tree biomass. Scaling this estimate to 900 million hectares yielded a potential of 89–108 Gt tree carbon20, which is comparable with our estimate of tree biomass restoration potential of 91 Gt C outside existing forest, urban areas and cropland regions (Table 1). Similarly, Roebroek et al.5 recently reported that the carbon potential in existing forests could be as low as 44 Gt C. Their estimate is considerably lower than our conservation potential estimate of 139 Gt C. This difference arises because Roebroek et al.5 focused only on aboveground tree biomass (excluding soil, roots, dead wood and leaf litter) and only considered the tree cover of existing forested regions. When we narrow our analysis to aboveground biomass in these forests, we recover a similar estimate of forest potential of 50 (39–63) Gt C. Nonetheless, when we consider studies that focused on the total ecosystem potential in all forest regions, our analysis reveals a distinct overlap that provides confidence in the scale of carbon losses from the global forest system.
Discussion
Understanding the potential for carbon storage in natural forests is crucial for comprehending their role in combating climate change. Our combined modelling approach, including ten estimates from this study and nine others from previous studies, allows us to identify the extent of overlap across diverse approaches and increases our confidence about the scale of the forest carbon potential across the globe. We found that total forest carbon storage is, at present, 328 Gt C (model range = 221–472 Gt C) below its full potential. Of this potential, 102 Gt C (69–134 Gt C) exist in urban areas, cropland and permanent pasture sites, in which substantial restoration is highly unlikely. Yet, a potential of 226 Gt C (151–363 Gt C) is in existing forests and regions with low human pressure (Table 1). Of this constrained forest carbon potential, 139 Gt C (61%) can be found in regions that are already forested. This highlights that the prevention of deforestation does not only contribute to the reduction of carbon emissions but has large carbon drawdown potential if ecosystems can be allowed to return to maturity. Improved forest management and restoration to reconnect fragmented forest landscapes contribute a considerable 87 Gt (39%) to the extra carbon drawdown potential. We stress that, despite considering the broad land-use types, we cannot identify detailed land-use activities at a high resolution, so different social and economic considerations may place further constraints on the scale of this potential. Nevertheless, this work highlights the potential contribution of forest conservation, restoration and sustainable management in capturing carbon from the atmosphere.
The development of current and natural forest carbon maps involved several approaches and data sources with varying strengths and weaknesses. This ensemble of modelling approaches can help to identify the extent of agreement and uncertainty across modelling approaches, enabling a comprehensive understanding of carbon potential at a global scale. As new satellite technologies, such as the Global Ecosystem Dynamics Investigation (GEDI) project37, begin to reveal high-resolution information about forest structure, it will be increasingly important to refine the spatial and temporal resolution of these carbon stock models. Our multimodel and multidata comparison pinpoints regional variation in the main sources of uncertainty in forest carbon potential, highlighting the need for improved aboveground data-sampling efforts in the tropics and soil carbon sampling at high latitudes (Fig. 4). As such, continuing efforts to refine the confidence in this forest carbon potential require advancements in remote-sensing instrumentation7, field-monitoring strategies with sustained funding for research teams and field workers, especially in the Global South38,39, better representation of temporal dynamics in carbon stocks, especially in ecosystems prone to natural disturbances40, and methodology to allow for strict and verifiable integration of ground data and remote sensing into comprehensive carbon stock estimates41. Fair and equitable funding support for sustaining and sharing tropical forest data is vital to reduce global sampling biases in forest inventory efforts38,39 (Supplementary Fig. 11).
It is important to note that our estimates of potential carbon capture in woody ecosystems pertain only to the biophysical potential and do not account for future changes in human pressure that may threaten forests42,43. Moreover, our estimations are based on recent climate conditions (1979–2013). If fossil fuel emissions continue to rise, the capacity of ecosystems to capture and store carbon will be threatened by climate-change-induced factors such as increasing temperature, drought and fire risks44,45. CO2 fertilization also has the potential to further change this system46. The dynamic and vulnerable nature of forests underscores the urgency of conserving existing ecosystems to maintain their carbon sink potential and highlights the urgent need to uphold no-deforestation pledges at the 26th UN Climate Change Conference of the Parties (COP26), including public and private-sector commitments to end forest loss as soon as 2025 (refs. 18,47,48).
Given the positive effect of biological diversity on ecosystem productivity6,49, the magnitude of the estimates presented here can only be achieved in ecosystems that support a natural diversity of species. Indeed, almost half of global forest production can be directly or indirectly attributed to the role of biodiversity6, highlighting that the full carbon potential cannot be achieved without a healthy diversity of species. Ecologically responsible forest restoration does not include the conversion of other natural ecosystem types, such as grasslands, peatlands and wetlands, that are equally essential. Restoration can take many forms, including the protection of land to allow natural vegetation recovery, soil microbiome enhancement, enrichment planting or reintroducing wild animals33,50. It also includes a vast array of active management practices, such as sustainable agroforestry, silviculture or permaculture practices, to promote biodiversity in managed systems. Ultimately, the protection and restoration of forest ecosystems are complex social, political and economic challenges that require the development of land-management policies that give priority to the rights and wellbeing of local communities and indigenous people51. Only when healthy biodiversity is the preferred choice for local people can ecosystem-restoration initiatives be sustainable in the long term52. When built in a socially and ecologically responsible way, the promotion of diverse forests can contribute substantially to achieving our combined climate and biodiversity goals.
Methods
Ground-sourced tree biomass
Forest inventory data
Plot-level forest inventory records were obtained from data compiled in the GFBI database6 (http://www.gfbinitiative.org), which hosts information for 1,188,771 plots (median plot size = 250 m2) from every continent except Antarctica (Fig. 1). Each plot contains information on stem diameter at breast height (DBH) for each tree6. Individuals with a DBH < 5 cm were removed from the analysis. Quality controls of tree density values were conducted and we removed plots with tree densities that fell outside the median ± 2.5 times the median absolute deviation (moderately conservative threshold)68 in each biome (6% of total plots). This resulted in retaining a total of 25,779,993 tree observations in 1,089,026 plots.
Biomass estimation for individual trees
For extratropical biomes, we used 430 species-specific DBH-based allometric equations obtained from the GlobAllomeTree database69 to estimate the aboveground biomass of each tree, W. These allometric equations use a common logarithmic equation for estimating aboveground biomass from DBH measures70:
in which W is the predicted individual aboveground biomass (kg dry weight), DBH is the measured diameter at breast height (cm), ln is the natural logarithm and β0 and β1 are the parameter estimates.
Following ref. 70, we applied back calculation to generate a pseudo dataset for biomass changes along DBH gradients based on each of the 430 allometric equations. To generate the pseudo data, we applied the following rules: (1) for a DBH between 5 and 25 cm, each centimetre was assigned a corresponding pseudo biomass value; (2) for a DBH between 25 and 100 cm, every 5 cm was assigned a corresponding value; (3) for a DBH between 100 and 300 cm (maximum DBH), every 10 cm was assigned a corresponding value. We then trained biome-specific allometric equations (varying in the β0 and β1 parameter estimates) based on the pseudo DBH and biomass dataset71 (Supplementary Fig. 12 and Supplementary Table 4).
Biomass estimations for the tropics followed the allometric model for pantropical regions from ref. 72, which is available through the R package BIOMASS (ref. 73). These equations require information on wood density, which came from the Global Wood Density Database74 and the Biomass And Allometry Database (BAAD)75. To match the binomial species names between the GFBI and the wood density databases, we standardized species binomials using the Taxonomic Name Resolution Service (TNRS)76.
Plot-level tree biomass calculation
After computing the aboveground dry biomass for all approximately 28 million individuals in our dataset, plot-level biomass values were obtained by summing the biomass of all individuals in the respective plot. For plots that contained data for several years, we calculated the mean of these years. The median year of observation across all plots was 2002. Subsequently, the biomass densities (in t ha−1) of each plot were obtained by dividing the total aboveground biomass (W) by the plot area. Carbon values were obtained by multiplying tree biomass by biome-specific wood carbon concentrations, ranging from 45.6% in tropical moist broadleaf forest to 50.1% in temperate conifer forest77 (see Supplementary Table 5). The spatial modelling was performed at 30-arcsec (about 1-km2) resolution and we therefore averaged tree carbon-density values for plots located in the same 30-arcsec pixel.
To avoid overestimation of carbon densities, we removed (1) values larger than the maximum carbon density ever recorded for forests (1,867 t C ha−1) and (2) values that fell outside the median ± 2.5 times the median absolute deviation (moderately conservative threshold) in each biome68,78. Small outlier values were kept, however, if they fell in human-modified non-forest landscapes, that is, regions with a human-disturbance index >10% and canopy cover <10%. This was done to avoid the underestimation of current carbon in croplands, pasture lands and urban areas that can contain notable amounts of existing biomass in trees outside forests79. To obtain normally distributed data, the carbon-density values were log-transformed before the median absolute deviation was calculated, using the following equation (Supplementary Fig. 13):
This removed 6.4% of the data (0–6% in biomes), resulting in a total of 527,767 spatially distinct carbon-density values used for the final analysis.
Environmental and human-disturbance variables
Environmental covariates
In total, 40 layers, reflecting climate, soil and topographic features, were used as covariates in our analyses (Supplementary Table 6). All layers were standardized to 30-arcsec resolution (1 km2 at the equator). Layers for 19 bioclimatic variables came from the CHELSA version 1.2 open climate database (www.chelsa-climate.org)80, topographic information (elevation, slope, roughness, eastness, northness, aspect cosine, aspect sine and profile curvature) from the EarthEnv (www.earthenv.org/topography) database81, cloud cover (annual mean, inter-annual standard deviation and intra-annual standard deviation) from the EarthEnv (www.earthenv.org/cloud) database and ref. 82, depth to the water table from ref. 83, the annual mean of solar radiation and wind speed from the WorldClim database (version 2)84, absolute depth to bedrock and soil texture (clay content, coarse fragments, sand content, silt content and soil pH), averaged for the depth between 0 to 100 cm below surface, from the SoilGrids database85 and the Global Aridity Index from the Global Aridity Index and Potential Evapotranspiration (ET0) Climate Database version 2.0 (refs. 86,87).
Human-disturbance covariates
To represent human disturbance in our models, we used eight global layers that directly reflect anthropogenic effects on the environment. Information on the proportion of cultivated and managed vegetation and urban built-up areas in each pixel came from the EarthEnv database88. These maps integrate four global land-cover products to represent accuracy-weighted consensus information on the prevalence of land-cover classes at 1-km resolution across the globe (except for Antarctica). By representing the proportional area of anthropogenic modification in each pixel (urban area or managed vegetation), the maps provide information on the spatial extent of human disturbance within pixels.
Information on agricultural land use (cropland, grazing, pasture and rangeland layers transformed to the percentage of agricultural land in each pixel) came from the HYDE database version 3.1 (refs. 89,90). Each layer represents the proportional area of cropland, grazing, pasture or rangeland in each pixel, thus allowing us to account for the individual impacts of agricultural land-use types.
Information on human modification, reflecting the overall intensity of human activity, came from ref. 91. Rather than representing the impact of individual human-modification classes, such as urban areas or cropland, this map provides a cumulative measure of human modification based on models of the physical extent of 13 anthropogenic stressors in five main classes: (1) human settlement (population density, built‐up areas); (2) agriculture (cropland, livestock); (3) transport (major roads, minor roads, two tracks, railroads); (4) mining and energy production (mining, oil wells, wind turbines); and (5) electrical infrastructure (power lines, night-time lights).
All variables were scaled to represent a continuous gradient of human impact, whereby values of zero indicate no human impact in the respective pixel and values of 1 indicate maximum human impact. Also, we included information on the regions with minimal human disturbance across the globe, using the global protected area map from the World Database on Protected Areas92,93. Protected areas were treated as a binary variable of whether the respective pixel is intentionally disturbed by humans or not (that is, strict nature reserve or wilderness area)94.
Geospatial modelling of existing tree carbon
Ground-sourced tree carbon density model
To represent the uncertainty in canopy cover of the forest inventory plots, we used upper and lower boundaries of canopy cover in each pixel at approximately 30-m resolution to convert C per plot to C per pixel95. We either assumed the canopy cover (% forested) of each forest inventory plot to represent the maximum canopy cover observed for the respective 1-km2 pixel (termed ‘upper canopy cover estimate’) or the mean canopy cover of the forested part (≥10% canopy cover) of the respective pixel (‘lower canopy cover estimate’). This canopy cover range ensured that our estimates represent the range of feasible sampling designs, as forest inventory plots can be biased towards high canopy cover sites within pixels rather than representing the average forest canopy cover. To convert C per plot into C per pixel, we divided the C per plot by the canopy cover within the plot (assuming either upper or lower canopy cover) and multiplied by canopy cover of the entire pixel, that is, C per pixel = (C per plot)/(canopy cover within plot) × (% forested per pixel). Thus, the resulting carbon value is inversely related to the canopy cover of the forest inventory plots: if the plot locations are assumed to reflect the maximum canopy cover in the pixel, then the resulting carbon estimate is the smallest; if instead the plots reflect the mean canopy cover, then the resulting carbon estimate is the largest. Note that we do not consider the scenario in which the plots are preferentially located in areas with minimum forest canopy cover, as this would lead to unrealistically high pixel-level carbon estimates (and carbon potential values) and is also unrealistic given the study design of the forest inventories underpinning the data. All subsequent analyses were conducted using C per pixel derived from both the upper and lower plot-level canopy cover estimates, allowing us to represent the uncertainty associated with canopy cover.
To train spatially explicit tree carbon models across the world’s forests, we ran random-forest machine-learning models using Google Earth Engine96. The models included 40 environmental layers (representing climate, soil and topographic features), eight human disturbance layers, and canopy cover as predictors. In random forest, unlike traditional regression, correlation among variables does not affect the model accuracy. Indeed, the ability to use many correlated predictors is one of the key benefits of machine-learning models97. When variables are correlated, the effect of these variables is ‘shared’ across the trees in the random forest. Because random forest does not estimate coefficients as in regression, this correlation does not hinder model fit or performance but, rather, complicates efforts to quantify variable importance, which is also shared across correlated variables (see Supplementary Fig. 14 for an evaluation of variable importance using a reduced, uncorrelated set of variables). Thus, including numerous variables, even if correlated, can improve the predictive power of the model to accurately quantify current carbon.
The model had the following form:
in which CCurrent is the current forest tree carbon density in each pixel, \({\mathop{{\rm{V}}{\rm{a}}{\rm{r}}}\limits^{\longrightarrow }}^{{\rm{Env}}}\) are the environmental variables, \({\mathop{{\rm{V}}{\rm{a}}{\rm{r}}}\limits^{\longrightarrow }}^{{\rm{Human}}}\) are the variables directly representing human disturbance (see ‘Environmental and human-disturbance variables’ section for details) and \({\mathop{{\rm{V}}{\rm{a}}{\rm{r}}}\limits^{\longrightarrow }}^{{\rm{CanopyCover}}}\) is the current canopy cover for the year 2010 (ref. 95).
In a first step, we tested for the existence of spatial autocorrelation in model residuals, which can bias model-validation statistics98. This was done by calculating the Moran’s I index of the residuals from generalized additive models at different spatial scales (0–1,000 km). The Moran’s I indices indicated residual spatial autocorrelation at distances of up to 80 km for all GS models (Supplementary Fig. 15a–d). To avoid any bias introduced by the influence of spatial autocorrelation and correct for the uneven sampling across regions, we therefore applied bootstrapped spatial subsampling (100 iterations) to predict both current and potential tree carbon densities (see ‘Geospatial modelling of tree carbon potential’ section). The spatial subsampling was conducted by subsampling one random observation inside each 0.7-arcdegree (about 78-km) grid, resulting in approximately 4,500 observations for each subsample. Given that the model was run with 100 iterations, this resulted in a total of about 450,000 samples used to build our GS models. Parameter tuning for each model was performed through the grid-search procedure of Google Earth Engine96 to explore the results of a suite of machine-learning models trained on the 49 covariates. For each of the models, we ran 48 discrete parameter sets covering the total grid space of 700 possible parameter combinations. Performance of each model was assessed using the coefficient of determination (R2) values from tenfold cross-validation (Supplementary Table 1) and we retained the best models from each bootstrapped spatial subsample. All R2 values reported throughout the manuscript represent the coefficient of determination relative to the 1:1 line of observed versus predicted values, which is equivalent to a standardized mean squared error.
As an alternative to testing whether spatial autocorrelation in model residuals affects model-validation statistics, we applied spatially buffered LOO-CV using the respective autocorrelation distances as buffer radii (Supplementary Table 1). In this procedure, each data point is predicted by a model that uses all data outside the buffer radius of the respective data point as training data. To run the LOO-CV, we used the hyperparameter settings of the best-performing random-forest model based on random tenfold cross-validation.
To create the final maps of current tree carbon density, we used an ensemble approach, whereby we averaged the global predictions from the 100 best random-forest models. By taking the average prediction across several models, ensemble methods minimize the influence of any single prediction, thereby stabilizing variation and minimizing bias that can otherwise arise from extrapolation or overfitting when using a single machine-learning model99. Geospatial mapping was also performed in Google Earth Engine96.
To account for tree carbon stored belowground as roots, we multiplied our aboveground tree carbon predictions by the pixel-level means or the upper and lower confidence bounds of the proportional contribution of root carbon, using a spatially explicit map of tree root mass fraction24 (Supplementary Fig. 16). This map was derived from random-forest models based on 5,170 spatially explicit observations of tree biomass ratios between roots and shoots, covering all continents except Antarctica. Confidence ranges of the pixel-level root mass fraction estimates were based on sampling uncertainty, using a stratified bootstrapping procedure (see methods in ref. 24 for details).
To generate the final ground-sourced map of existing total living tree carbon (aboveground and belowground biomass in t C ha−1) at 30-arcsec resolution (about 1 km2), the total carbon stored at present in living trees (Cexisting) was then calculated as:
in which Dexisting is the living tree carbon density in each pixel and AreaPixel is the area of each pixel.
To evaluate the extent of model interpolation versus extrapolation, that is, how well our training data represent the full multivariate environmental covariate space, we performed an approach based on principal component analysis (PCA)100. To do so, we performed PCA on the 49 covariates represented in our training data, using the centring values, scaling values and eigenvectors to transform the 49 covariates into the same PCA spaces. Then we created convex hulls for each of the bivariate combinations from the top 19 principal components (which collectively covered more than 90% of the sample-space variation). Using the coordinates of these convex hulls, we classified whether each pixel falls within or outside each of these convex hulls. In total, 92% of the potential canopy cover area fell within ≥95% of the 171 PCA convex hull spaces computed from our training data (representing the range of environmental conditions in our training data), with most of the outliers existing in arid regions (Supplementary Fig. 17a).
We also tested how well the training data span the variation in the eight human-disturbance layers. In total, 90% of the potential canopy cover area fell within ≥95% of the ten PCA convex hull spaces computed from our training data (Supplementary Fig. 17b).
Satellite-derived tree carbon density models
To compare and benchmark our ground-sourced tree carbon models against satellite-derived predictions, we used three state-of-the-art products of current aboveground forest biomass: (1) the latest ESA-CCI forest biomass map published in 2022 by the European Space Agency’s Climate Change Initiative7,101; (2) a woody carbon stock map published in 2022 by Walker et al.2; and (3) a harmonized woody carbon stock map published in 2020 by Spawn et al.8.
The ESA-CCI map represents aboveground living tree biomass for the year 2010 and was produced using satellite data from ALOS-2/PALSAR-2 and a physical-based inversion model that estimates biomass from growing stock volume, wood density and biomass expansion factors, with bias adjustment following the validation framework in ref. 7. The map was averaged from 100-m to 1-km2 spatial resolution to match the resolution of the covariates. The 1-km2 ESA-CCI map was assessed following the validation framework in ref. 7, wherein map bias is predicted using a model-based approach based on global reference data. This step reduces mapping bias in areas with statistically significant prediction bias and particularly reduces the underestimation of biomass at high-biomass forests >350 t ha−1. The map comes with an uncertainty layer that accounts for spatially correlated errors during spatial averaging. To convert the living tree biomass estimates to carbon, we multiplied tree biomass with biome-specific wood carbon concentrations77 (see Supplementary Table 5).
The Walker et al.2 map represents woody aboveground carbon stocks for the year 2016 and was created by combining field measurements using airborne and spaceborne (NASA ICESat Geoscience Laser Altimeter System; GLAS) lidar data to yield spatially explicit estimates of aboveground biomass density at the GLAS footprint (about 60-m diameter) scale. Regression models were then used to relate the GLAS-based estimates of aboveground biomass to satellite imagery by the Moderate Resolution Imaging Spectroradiometer (MODIS), ultimately allowing to generate spatially explicit estimates of global aboveground biomass density at a resolution of approximately 500 m. The map was aggregated from 500-m to 1-km2 spatial resolution to match the resolution of the covariates and came with an uncertainty layer that accounts for the spatially modelled error, representing the 95% quantile intervals generated by quantile regression forests2.
The harmonized map8 represents aboveground woody carbon stocks for the year 2010 and was based on the GlobBiomass102 map and refined using remotely sensed data for Africa103 (see ref. 8 for details). The map was aggregated from 300-m to 1-km2 spatial resolution to match the resolution of the covariates and came with an uncertainty layer that represents the uncertainty associated with the harmonization correction8.
Geospatial modelling of tree carbon potential
To map the tree carbon potential in the hypothetical absence of humans, we developed four data-driven modelling approaches, with two sets of models developed from ground-sourced data (GS1 and GS2) and two from satellite-derived data (SD1 and SD2).
GS models
After training and parameterizing the GS model of current tree carbon density using equation (3), we estimated the potential tree carbon density in forests that could exist in the absence of human disturbance by modifying this equation setting human-disturbance variables to zero and replacing existing canopy cover with potential canopy cover (GS1):
in which \({\mathop{{\rm{V}}{\rm{a}}{\rm{r}}}\limits^{\longrightarrow }}^{{\rm{Env}}}\) are the environmental variables, \({\mathop{{\rm{V}}{\rm{a}}{\rm{r}}}\limits^{\longrightarrow }}^{{\rm{zeroHuman}}}\) are the scaled human-disturbance variables set to zero and \({\mathop{{\rm{V}}{\rm{a}}{\rm{r}}}\limits^{\longrightarrow }}^{{\rm{CanopyCover}}}\) is the current canopy cover95, which was replaced by potential canopy cover3 after model training for the prediction of the total carbon potential. This allowed us to train the model including information on current (2010) forest canopy cover95 and then to predict the tree carbon potential inside the potential canopy cover by replacing current canopy cover with the ‘natural’ canopy cover expected in the absence of humans3.
For the second GS model of potential tree carbon density (GS2), we included only data from regions with minimal human disturbance and used the 40 environmental covariates and canopy cover as predictors:
in which \({\mathop{{\rm{V}}{\rm{a}}{\rm{r}}}\limits^{\longrightarrow }}^{{\rm{Env}}}\) are the environmental variables and \({\mathop{{\rm{V}}{\rm{a}}{\rm{r}}}\limits^{\longrightarrow }}^{{\rm{CanopyCover}}}\) is the current canopy cover95, which was replaced by potential canopy cover3 after model training.
The GS2 model differs from the GS1 model in a reduced number of observations (only pixels with minimal human disturbance) and a reduced number of predictors (no human-disturbance variables). Regions with minimal human disturbance were defined as pixels located in: (1) a protected area, that is, strict nature reserve or wilderness area94; (2) intact forest, that is, contiguous forest with no remotely detected signs of human activity and a minimum area of 500 km2 (ref. 26); and/or (3) pixels in which human modification is <1% following ref. 91. To minimize the influence of uneven distribution of observations and spatial autocorrelation on model training, we applied bootstrapped spatial subsampling (100 iterations), similar to the GS1 models, whereby—for each subsample—we randomly sampled one observation in each 0.25 arcdegree, which resulted in about 4,500 observations for each subsample.
As for the predictions of current tree carbon, for both the GS1 and GS2 models, we added root carbon24 to generate maps representing total living tree carbon potential in the absence of human disturbance.
SD models
The two types of SD model were run with the ESA-CCI18, Walker et al.2 and harmonized maps8 of current woody carbon as input data, resulting in six model combinations (two model types and three input datasets). As for the GS1 model, model structure and parameterization of the first SD model of potential living tree carbon (SD1) followed equation (5). Similarly, as for the GS2 model, the second SD model of potential tree carbon density (SD2) followed equation (6), and we trained the model using only biomass density information from areas with minimal human disturbance inside protected areas (strict nature reserve or wilderness area)94 and/or intact forest landscapes26.
For both the SD1 and SD2 models, we conducted a bootstrap subsampling approach similar to the GS models, whereby about 4,500 sample points were drawn 100 times with replacement. For the SD1 model, observations were drawn randomly, given that the models were built from global maps for which data are distributed equally across all global forest areas. For the SD2 model, we applied spatial subsampling, randomly sampling one observation in each 1-arcdegree grid to account for the uneven distribution of areas with minimal human disturbance across the globe. For each subsample, we ran 48 discrete parameter sets covering the total grid space of 700 possible parameter combinations and kept the parameter set with the highest coefficient of determination (R2) based on tenfold cross-validation. To obtain the final predictions, we averaged the predictions from the 100 random-forest models.
To test for spatial autocorrelation in model residuals, we calculated the Moran’s I index of the residuals from generalized additive models at different spatial scales (0–1,000 km) and, for each model, found spatial autocorrelation at distances of up to 550–900 km (Supplementary Fig. 15e–j). To test for the effect of spatial autocorrelation on model validation statistics, we then ran LOO-CV models for each of the 100 bootstrapped subsamples, using the respective autocorrelation distances as buffer radii and the hyperparameter settings of the best-performing random-forest model based on random tenfold cross-validation (Supplementary Table 1).
Adding dead wood, litter and soil carbon to scale living tree carbon to total ecosystem carbon
Dead wood and litter biomass
To account for forest carbon stored in dead wood and litter, we obtained forest-type-level carbon ratios from previous studies19,104. Means and confidence ranges of the ratios between dead wood and litter carbon and living tree carbon for tropical, temperate and boreal forests were calculated from forest-type estimates of total living biomass, dead wood and litter from Table S3 in ref. 19. Means and confidence ranges for dryland forests were calculated from Table 1 in ref. 104, using all sites for which data on plant aboveground and belowground biomass and litter was available. The ratios between dead wood and litter carbon and living tree carbon were 22% (95% confidence range = 15–33%), 33% (30–37%), 80% (68–94%) and 21% (2–40%) for tropical, temperate, boreal and dryland forests, respectively. We then multiplied pixel-level living tree carbon values by these percentages to estimate the means and confidence bounds of dead wood and litter carbon for each pixel (Table 1).
Soil carbon
Using the soil potential map ref. 23, which represents the effects of anthropogenic land-use and land-cover changes on soil organic carbon in the top 2 m (ref. 23) over the past 12,000 years, we extracted estimates of soil carbon potential in the absence of humans (difference between soil carbon 10,000 BC and current soil carbon) for all pixels that would naturally support trees (potential canopy cover3 ≥ 10%; Table 1). Associated spatial-prediction uncertainties (absolute errors) were calculated by fitting a spatial-prediction model to the prediction residuals of the cross-validated original model and applying this error model over the whole area of interest23.
Model uncertainty
For each of the GS and SD models, the 100 bootstrapped models of aboveground tree carbon potential were used to calculate per-pixel coefficient-of-variation values (standard deviation divided by the mean predicted value) as a measure of sampling uncertainty (hereafter referred to as bootstrap prediction uncertainty; Supplementary Figs. 1 and 2). Using the bootstrapped models, we also calculated 95% confidence ranges of estimates, allowing us to represent uncertainty ranges for each aboveground carbon model. To represent the uncertainty in canopy cover of the forest inventory plots, we ran the GS1 and GS2 models for both the upper and lower canopy cover estimates. To represent data uncertainty of the SD models, we ran the SD1 and SD2 models using three different input datasets (ESA-CCI18, Walker et al.2 and harmonized biomass maps8). Uncertainty in belowground tree carbon was derived by multiplying the upper and lower confidence ranges of aboveground tree carbon values with the upper and lower confidence ranges of spatially explicit root mass fractions24, thus representing uncertainties in both root mass fraction and aboveground biomass. Using the entire confidence range of total (aboveground and belowground) living tree carbon, including sampling and data uncertainty, we then calculated the uncertainty in dead wood and litter biomass by multiplying the upper and lower confidence ranges of total living tree carbon values with the upper and lower confidence ranges of the forest-type-specific ratios between dead wood and litter carbon and living tree carbon (see ‘Dead wood and litter biomass’ section). Dead wood and litter biomass uncertainty was thus the result of uncertainties in both dead wood and litter-to-tree biomass ratios and tree biomass. Spatially explicit uncertainties in soil carbon potential were derived from maps of absolute errors in organic carbon density at 0–200 cm soil depth provided in ref. 23. Propagation of uncertainty was done by summing all individual uncertainties and assuming that they are uncorrelated.
To quantify the relative contribution of the different sources of uncertainty to the overall uncertainty in our models, we divided the absolute uncertainty of each uncertainty type by the sum of all uncertainties (Fig. 4). This partitioning allows for relative comparison in uncertainty among sources, but otherwise does not necessarily reflect total model uncertainty owing to overlap and correlation across sources of uncertainty.
Carbon potential partitioning
On the basis of our carbon models, we could generate estimates of (1) the relative contribution of forest degradation (that is, reduced tree carbon within the existing canopy cover) to the difference between current and potential carbon stocks (hereafter referred to as conservation potential) and (2) the relative contribution of deforestation (that is, declines in canopy cover owing to land-use change in areas that would naturally support trees) to the difference between current and potential carbon stocks (hereafter referred to as restoration potential). Specifically, to estimate the relative contribution of forest degradation (conservation potential) and deforestation (restoration potential) to the difference between current and potential carbon stocks, we first attributed the proportional amount of the extra carbon predicted by our model to the extra canopy cover expected in the absence of humans. For example, for a pixel in which potential canopy cover is twice as high as current canopy cover and for which the predicted potential carbon is also twice as high as current carbon, the extra carbon is attributed only to the difference in canopy cover (restoration potential). For pixels in which the potential increase in tree carbon exceeded the proportional increase in canopy cover, the carbon potential fraction exceeding the proportional increase in canopy cover was equally distributed across the total potential canopy cover of the pixel. For pixels in which potential canopy cover was the same as current canopy cover, we attributed the difference between current and potential tree carbon stocks to forest degradation (conservation potential).
Throughout the text, we refer to conservation potential as the difference between current and potential carbon in existing forests, which was computed by subtracting the carbon stored at present inside existing forests from the expected carbon in these forests in the absence of human disturbance. We refer to restoration potential as the difference between current and potential carbon outside existing forests, which was estimated as the expected carbon in non-forest areas that would naturally support trees in the absence of human disturbances3. Finally, the total difference between current and potential carbon refers to the sum of the conservation and restoration potentials (Figs. 3 and 5).
To estimate the existing and potential carbon within biomes (Supplementary Table 2), forest classes (tropical, temperate, boreal and dryland; Supplementary Table 3) and countries (Fig. 5e), we used the World Wide Fund for Nature (WWF) biome definitions71 and country boundaries from the world boundary map105. Forests were classified into four broad categories (tropical, temperate, boreal and dryland)71. Tropical forest includes six biomes: tropical and subtropical moist broadleaf forest, tropical and subtropical dry broadleaf forest, tropical and subtropical coniferous forest, tropical and subtropical grassland, savannah and shrubland, flooded grassland and savannah, and mangroves; temperate forest includes four biomes: temperate broadleaf and mixed forest, conifer forest, temperate grassland, savannah and shrubland, and montane grassland and shrubland; boreal forest includes two biomes: boreal forest/taiga and tundra; dryland refers to the two biomes Mediterranean forest, woodland and scrub, and desert and xeric shrubland.
To partition potential carbon stocks into different land-cover types, we integrated four land-cover maps88,89,90,106, providing information on the relative area of a pixel that is covered by urban area, cropland, permanent pasture, rangeland, urban area, forest, water body and ice and snow. The difference between current and potential tree carbon stocks predicted by our models was then allocated to the land-cover types urban area, cropland, permanent pasture, rangeland, urban area and forest in proportion to their relative pixel coverage. Low-human-pressure land was defined as the proportion of a non-forest pixel (<10% canopy cover) that could not be attributed to pasture, rangeland, cropland, urban area, water body or ice and snow. All areas in forest pixels that could not be attributed to pasture, rangeland, cropland, urban area, water body or ice and snow were attributed to forest. Global information on forest plantations came from ref. 28 and we only considered plantations if they covered more than 10% of the canopy area in a pixel.
Meta-analysis of previous studies on the global carbon potential
To gain insight into the forest carbon potential estimated by previous studies, we reviewed publications that applied diverse approaches to quantify the potential carbon storage capacity of global forests. These studies fall into two types of estimate. The first type included studies reporting the total carbon that could be stored in global forests in the absence of human activities (Fig. 3b). The second type encompassed studies reporting the extra potential carbon that could be stored in the global forests, that is, the difference between current and potential carbon stocks (Fig. 3d). In total, we found 20 estimates of the total carbon potential and nine estimates of the difference between current and potential carbon stocks. These estimates were derived from four different approaches: inventory-based empirical estimates, mechanistic models, ensemble models and data-driven models. Inventory-based estimates comprise studies that estimated the global carbon potential from maximum forest carbon densities observed in climate zones or ecoregions based on inventory data1,55,58. Mechanistic-model estimates included studies that used mechanistic models, such as Earth system models, to estimate the carbon potential of global forests64,67. Ensemble-model estimates consisted of studies that used a variety of existing biomass maps to estimate the global carbon potential from maximum forest carbon densities in climate zones or ecoregions4. Last, the data-driven model category encompassed studies that used extensive global carbon density observations to train global models based on environmental covariates2. References to the studies included in this meta-analysis are shown in the legend of Fig. 3 and Supplementary Table 7.
All analyses were conducted in Google Earth Engine96 and R (v. 3.6.3)107. All figures were created in R (v. 3.6.3)107.
Data availability
Data and code are available at GitHub: https://doi.org/10.5281/zenodo.10021968.
References
Pan, Y., Birdsey, R. A., Phillips, O. L. & Jackson, R. B. The structure, distribution, and biomass of the world’s forests. Annu. Rev. Ecol. Evol. Syst. 44, 593–622 (2013).
Walker, W. et al. The global potential for increased storage of carbon on land. Proc. Natl Acad. Sci. 119, e2111312119 (2022).
Bastin, J. F. et al. The global tree restoration potential. Science 364, 76–79 (2019).
Erb, K.-H. et al. Unexpectedly large impact of forest management and grazing on global vegetation biomass. Nature 553, 73–76 (2018).
Roebroek, C. T. J., Duveiller, G., Seneviratne, S. I., Davin, E. L. & Cescatt, A. Releasing global forests from human management: How much more carbon could be stored? Science 380, 749–753 (2023).
Liang, J. et al. Positive biodiversity-productivity relationship predominant in global forests. Science 354, aaf8957 (2016).
Araza, A. et al. A comprehensive framework for assessing the accuracy and uncertainty of global above-ground biomass maps. Remote Sens. Environ. 272, 112917 (2022).
Spawn, S. A., Sullivan, C. C., Lark, T. J. & Gibbs, H. K. Harmonized global maps of above and belowground biomass carbon density in the year 2010. Sci. Data 7, 112 (2020).
Lewis, S. L., Wheeler, C. E., Mitchard, E. T. A. & Koch, A. Restoring natural forests is the best way to remove atmospheric carbon. Nature 568, 25–28 (2019).
Pecl, G. T. et al. Biodiversity redistribution under climate change: impacts on ecosystems and human well-being. Science 355, eaai9214 (2017).
Intergovernmental Panel on Climate Change (IPCC). Global Warming of 1.5°C. An IPCC Special Report on the Impacts of Global Warming of 1.5°C Above Pre-industrial Levels and Related Global Greenhouse Gas Emission Pathways, in the Context of Strengthening the Global Response to the Threat of Climate Change (Cambridge Univ. Press, 2018).
Food and Agriculture Organization of the United Nations (FAO). In Brief to The State of the World’s Forests 2022. Forest Pathways for Green Recovery and Building Inclusive, Resilient and Sustainable Economies (FAO, 2022).
Crowther, T. W. et al. Mapping tree density at a global scale. Nature 525, 201–205 (2015).
Olagunju, T. E. Impacts of human-induced deforestation, forest degradation and fragmentation on food security. N. Y. Sci. J. 8, 4–16 (2015).
Friedlingstein, P. et al. Global carbon budget 2020. Earth Syst. Sci. Data 12, 3269–3340 (2020).
Mrema, E. M. et al. Ten years to restore a planet. One Earth 3, 647–652 (2020).
Convention on Biological Diversity (CBD). Kunming-Montreal Global Biodiversity Framework (UN Environment Programme, 2022).
26th UN Climate Change Conference of the Parties (COP26). Glasgow Leaders’ Declaration on Forests and Land Use (United Nations Climate Change, 2021).
Pan, Y. et al. A large and persistent carbon sink in the world’s forests. Science 333, 988–993 (2011).
Lewis, S. L., Mitchard, E. T. A., Prentice, C., Maslin, M. & Poulter, B. Comment on “The global tree restoration potential”. Science 366, eaaz0388 (2019).
Veldman, J. W. et al. Comment on “The global tree restoration potential”. Science 366, eaay7976 (2019).
Scott, J. M. et al. Nature reserves: do they capture the full range of America’s biological diversity? Ecol. Appl. 11, 999–1007 (2001).
Sanderman, J., Hengl, T. & Fiske, G. J. Soil carbon debt of 12,000 years of human land use. Proc. Natl Acad. Sci. 114, 9575–9580 (2017).
Ma, H. et al. The global distribution and environmental drivers of aboveground versus belowground plant biomass. Nat. Ecol. Evol. 5, 1110–1122 (2021).
Avitabile, V. et al. An integrated pan-tropical biomass map using multiple reference datasets. Glob. Change Biol. 22, 1406–1420 (2016).
Potapov, P. et al. The last frontiers of wilderness: tracking loss of intact forest landscapes from 2000 to 2013. Sci. Adv. 3, e1600821 (2017).
Skytt, T., Englund, G. & Jonsson, B. Climate mitigation forestry—temporal trade-offs. Environ. Res. Lett. 16, 114037 (2021).
Du, Z. et al. A global map of planting years of plantations. Sci. Data 9, 141 (2022).
Xu, L. et al. Changes in global terrestrial live biomass over the 21st century. Sci. Adv. 7, eabe9829 (2021).
Portmann, R. et al. Global forestation and deforestation affect remote climate via adjusted atmosphere and ocean circulation. Nat. Commun. 13, 5569 (2022).
Rohatyn, S., Yakir, D., Rotenberg, E. & Carmel, Y. Limited climate change mitigation potential through forestation of the vast dryland regions. Science 377, 1436–1439 (2022).
Alkama, R. & Cescatti, A. Biophysical climate impacts of recent changes in global forest cover. Science 351, 600–604 (2016).
Nabuurs, G.-J. et al. in IPCC, 2022: Climate Change 2022: Mitigation of Climate Change. Contribution of Working Group III to the Sixth Assessment Report of the Intergovernmental Panel on Climate Change (eds Shukla, P. R. et al.) Ch. 7 (Cambridge Univ. Press, 2023).
Cassidy, E. S., West, P. C., Gerber, J. S. & Foley, J. A. Redefining agricultural yields: from tonnes to people nourished per hectare. Environ. Res. Lett. 8, 034015 (2013).
Schiermeir, Q. Eat less meat: UN climate-change panel tackles diets. Nature 572, 291–292 (2019).
Hayek, M. N., Harwatt, H., Ripple, W. J. & Mueller, N. D. The carbon opportunity cost of animal-sourced food production on land. Nat. Sustain. 4, 21–24 (2021).
Dubayah, R. O. et al. GEDI L4A Footprint Level Aboveground Biomass Density, Version 1. https://doi.org/10.3334/ORNLDAAC/1907 (ORNL DAAC, 2021).
de Lima, R. A. F. et al. Making forest data fair and open. Nat. Ecol. Evol. 6, 656–658 (2022).
Liang, J. & Gamarra, J. G. P. The importance of sharing global forest data in a world of crises. Sci. Data 7, 424 (2020).
Staver, A. C., Archibald, S. & Levin, S. A. The global extent and determinants of savanna and forest as alternative biome states. Science 334, 230–232 (2011).
McRoberts, R. E. et al. Local validation of global biomass maps. Int. J. Appl. Earth Obs. Geoinf. 83, 101931 (2019).
Austin, K. G. et al. The economic costs of planting, preserving, and managing the world’s forests to mitigate climate change. Nat. Commun. 11, 5946 (2020).
Cook-Patton, S. C. et al. Mapping carbon accumulation potential from global natural forest regrowth. Nature 585, 545–550 (2020).
Aleixo, I. et al. Amazonian rainforest tree mortality driven by climate and functional traits. Nat. Clim. Change 9, 384–388 (2019).
Pellegrini, A. F. A. et al. Fire frequency drives decadal changes in soil carbon and nitrogen and ecosystem productivity. Nature 553, 194–198 (2018).
Zhu, Z. et al. Greening of the Earth and its drivers. Nat. Clim. Change 6, 791–795 (2016).
Wiebel, H., Moss, K. & Neagle, E. From Pledges to Action: What’s Next for COP26 Corporate Commitments. World Resources Institute https://www.wri.org/insights/pledges-action-whats-next-cop26-corporate-commitments?auHash=tpyB7H-JVwZWeGWd-_lP2K9Xs0ZcTfHmlcAFGllQ5DM (2021).
26th UN Climate Change Conference of the Parties (COP26). Financial Sector Commitment Letter on Eliminating Commodity-driven Deforestation (United Nations Climate Change, 2021).
Veryard, R. et al. Positive effects of tree diversity on tropical forest restoration in a field-scale experiment. Sci. Adv. 9, eadf0938 (2023).
Philipson, C. D. et al. Active restoration accelerates the carbon recovery of human-modified tropical forests. Science. 369, 838–841 (2020).
Lambin, E. F. & Meyfroidt, P. Global land use change, economic globalization, and the looming land scarcity. Proc. Natl Acad. Sci. USA. 108, 3465–3472 (2011).
Crowther, T. W. et al. Restor: transparency and connectivity for the global environmental movement. One Earth 5, 476–481 (2022).
Roy, J., Mooney, H. A. & Saugier, B. Terrestrial Global Productivity (Elsevier, 2001).
Siegenthaler, U. & Sarmiento, J. L. Atmospheric carbon dioxide and the ocean. Nature 365, 119–125 (1993).
Bazilevich, N. I., Rodin, L. Y. & Rozov, N. N. Geographical aspects of biological productivity. Sov. Geogr. 12, 293–317 (1971).
Olson, J. S., Watts, J. A. & Allison, L. J. Carbon in Live Vegetation of Major World Ecosystems (Oak Ridge National Laboratory, 1983).
Ruesch, A. & Gibbs, H. K. New IPCC Tier-1 global biomass carbon map for the year 2000 (U.S. Department of Energy, 2008).
Ajtay, G. L. Terrestrial primary production and phytomass. Glob. Carbon cycle 129–181 (1979).
Food and Agriculture Organization of the United Nations (FAO). Global Forest Resources Assessment 2010 (FAO, 2010).
Adams, J. M., Faure, H., Faure-Denard, L., McGlade, J. M. & Woodward, F. I. Increases in terrestrial carbon storage from the Last Glacial Maximum to the present. Nature 348, 711–714 (1990).
West, P. C. et al. Trading carbon for food: global comparison of carbon stocks vs. crop yields on agricultural land. Proc. Natl Acad. Sci. 107, 19645–19648 (2010).
Kaplan, J. O. et al. Holocene carbon emissions as a result of anthropogenic land cover change. Holocene 21, 775–791 (2011).
Shevliakova, E. et al. Carbon cycling under 300 years of land use change: importance of the secondary vegetation sink. Glob. Biogeochem. Cycles 23, GB2022 (2009).
Hurtt, G. C. et al. Harmonization of land-use scenarios for the period 1500–2100: 600 years of global gridded annual land-use transitions, wood harvest, and resulting secondary lands. Clim. Change 109, 117–161 (2011).
Krinner, G. et al. A dynamic global vegetation model for studies of the coupled atmosphere‐biosphere system. Glob. Biogeochem. Cycles 19, GB1015 (2005).
Sitch, S. et al. Evaluation of ecosystem dynamics, plant geography and terrestrial carbon cycling in the LPJ dynamic global vegetation model. Glob. Change Biol. 9, 161–185 (2003).
Prentice, I. C., Harrison, S. P. & Bartlein, P. J. Global vegetation and terrestrial carbon cycle changes after the last ice age. New Phytol. 189, 988–998 (2011).
Leys, C., Ley, C., Klein, O., Bernard, P. & Licata, L. Detecting outliers: do not use standard deviation around the mean, use absolute deviation around the median. J. Exp. Soc. Psychol. 49, 764–766 (2013).
Henry, M. et al. GlobAllomeTree: international platform for tree allometric equations to support volume, biomass and carbon assessment. Iforest 6, 326–330 (2013).
Jenkins, J. C., Chojnacky, D. C., Heath, L. S. & Birdsey, R. A. National-scale biomass estimators for United States tree species. For. Sci. 49, 12–35 (2003).
Olson, D. M. et al. Terrestrial ecoregions of the world: a new map of life on Earth: a new global map of terrestrial ecoregions provides an innovative tool for conserving biodiversity. Bioscience 51, 933–938 (2001).
Chave, J. et al. Improved allometric models to estimate the aboveground biomass of tropical trees. Glob. Change Biol. 20, 3177–3190 (2014).
Réjou-Méchain, M., Tanguy, A., Piponiot, C., Chave, J. & Hérault, B. BIOMASS: an R package for estimating above-ground biomass and its uncertainty in tropical forests. Methods Ecol. Evol. 8, 1163–1167 (2017).
Chave, J. et al. Towards a worldwide wood economics spectrum. Ecol. Lett. 12, 351–366 (2009).
Falster, D. S. et al. BAAD: a Biomass And Allometry Database for woody plants. Ecology 96, 1445 (2015).
Boyle, B. et al. The Taxonomic Name Resolution Service: an online tool for automated standardization of plant names. BMC Bioinform. 14, 16 (2013).
Martin, A. R., Doraisami, M. & Thomas, S. C. Global patterns in wood carbon concentration across the world’s trees and forests. Nat. Geosci. 11, 915–920 (2018).
Keith, H., Mackey, B. G. & Lindenmayer, D. B. Re-evaluation of forest biomass carbon stocks and lessons from the world’s most carbon-dense forests. Proc. Natl Acad. Sci. 106, 11635–11640 (2009).
Li, S. et al. Deep learning enables image-based tree counting, crown segmentation, and height prediction at national scale. PNAS Nexus 2, pgad076 (2023).
Karger, D. N. et al. Climatologies at high resolution for the earth’s land surface areas. Sci. Data 4, 170122 (2017).
Amatulli, G. et al. A suite of global, cross-scale topographic variables for environmental and biodiversity modeling. Sci. Data 5, 180040 (2018).
Wilson, A. M. & Jetz, W. Remotely sensed high-resolution global cloud dynamics for predicting ecosystem and biodiversity distributions. PLoS Biol. 14, e1002415 (2016).
Fan, Y., Li, H. & Miguez-Macho, G. Global patterns of groundwater table depth. Science 339, 940–943 (2013).
Fick, S. E. & Hijmans, R. J. WorldClim 2: new 1-km spatial resolution climate surfaces for global land areas. Int. J. Climatol. 37, 4302–4315 (2017).
Shangguan, W., Hengl, T., de Jesus, J. M., Yuan, H. & Dai, Y. Mapping the global depth to bedrock for land surface modeling. J. Adv. Model. Earth Syst. 9, 65–88 (2017).
Trabucco, A. & Zomer, R. J. Global Soil Water Balance Geospatial Database. (CGIAR Consortium for Spatial Information, 2010); https://csidotinfo.wordpress.com/data/global-high-resolution-soil-water-balance/.
Zomer, R. J., Trabucco, A., Bossio, D. A. & Verchot, L. V. Climate change mitigation: a spatial analysis of global land suitability for clean development mechanism afforestation and reforestation. Agric. Ecosyst. Environ. 126, 67–80 (2008).
Tuanmu, M.-N. & Jetz, W. A global 1-km consensus land-cover product for biodiversity and ecosystem modelling. Glob. Ecol. Biogeogr. 23, 1031–1045 (2014).
Klein Goldewijk, K., Beusen, A. & Janssen, P. Long-term dynamic modeling of global population and built-up area in a spatially explicit way: HYDE 3.1. Holocene 20, 565–573 (2010).
Klein Goldewijk, K., Beusen, A., Van Drecht, G. & De Vos, M. The HYDE 3.1 spatially explicit database of human-induced global land-use change over the past 12,000 years. Glob. Ecol. Biogeogr. 20, 73–86 (2011).
Kennedy, C. M., Oakleaf, J. R., Theobald, D. M., Baruch-Mordo, S. & Kiesecker, J. Managing the middle: a shift in conservation priorities based on the global human modification gradient. Glob. Change Biol. 25, 811–826 (2019).
United Nations Environment Programme World Conservation Monitoring Centre (UNEP-WCMC), International Union for Conservation of Nature (IUCN) World Commission on Protected Areas (WCPA). Protected Planet: the World Database on Protected Areas (WDPA). https://www.protectedplanet.net/en (2011).
United Nations Environment Programme World Conservation Monitoring Centre (UNEP-WCMC), International Union for Conservation of Nature (IUCN) World Commission on Protected Areas (WCPA). Protected Planet: the World Database on Protected Areas (WDPA) https://www.protectedplanet.net/en (2018).
Jones, K. R. et al. One-third of global protected land is under intense human pressure. Science 360, 788–791 (2018).
Hansen, M. C. et al. High-resolution global maps of 21st-century forest cover change. Science 342, 850–853 (2013).
Gorelick, N. et al. Google Earth Engine: planetary-scale geospatial analysis for everyone. Remote Sens. Environ. 202, 18–27 (2017).
Strobl, C., Boulesteix, A. L., Kneib, T., Augustin, T. & Zeileis, A. Conditional variable importance for random forests. BMC Bioinform. 9, 307 (2008).
Ploton, P. et al. Spatial validation reveals poor predictive performance of large-scale ecological mapping models. Nat. Commun. 11, 4540 (2020).
Sagi, O. & Rokach, L. Ensemble learning: a survey. Wiley Interdiscip. Rev. Data Min. Knowl. Discov. 8, e1249 (2018).
van den Hoogen, J. et al. Soil nematode abundance and functional group composition at a global scale. Nature 572, 194–198 (2019).
Santoro, M. & Cartus, O. ESA Biomass Climate Change Initiative (Biomass_cci): Global datasets of forest above-ground biomass for the years 2010, 2017 and 2018, v3. NERC EDS Centre for Environmental Data Analysis. https://doi.org/10.5285/5f331c418e9f4935b8eb1b836f8a91b8 (2021).
Santoro, M. GlobBiomass—global datasets of forest biomass. PANGAEA. https://doi.org/10.1594/PANGAEA.894711 (2018).
Bouvet, A. et al. An above-ground biomass map of African savannahs and woodlands at 25 m resolution derived from ALOS PALSAR. Remote Sens. Environ. 206, 156–173 (2018).
Grace, J., Jose, J. S., Meir, P., Miranda, H. S. & Montes, R. A. Productivity and carbon fluxes of tropical savannas. J. Biogeogr. 33, 387–400 (2006).
Sandvik, B. World Borders Dataset. Thematic Mapping API. https://thematicmapping.org/downloads/world_borders.php (2009).
Tuanmu, M.-N. & Jetz, W. A global, remote sensing-based characterization of terrestrial habitat heterogeneity for biodiversity and ecosystem modelling. Glob. Ecol. Biogeogr. 24, 1329–1339 (2015).
R Core Team. R: A Language and Environment for Statistical Computing. http://www.R-project.org/ (R Foundation for Statistical Computing, 2020).
Acknowledgements
We sincerely acknowledge S. Lewis and D. S. Maynard for their valuable suggestions and contributions to this project. This work was supported by grants to L. Mo from the China Scholarship Council, C.M.Z. from the SNF Ambizione Fellowship programme (#PZ00P3_193646) and T.W.C. from DOB Ecology and the Bernina Foundation. We thank RESTOR (www.restor.eco) for providing data and Google Earth Engine for analytical support. This study was in part supported by the ESA Climate Change Initiative Biomass project funded by the European Space Agency (4000123662/18/I-NB) and the Open-Earth-Monitor Project funded by the European Union. The GEO-TREES initiative (https://geo-trees.org/) contributed plot data to this study, supported by the European Space Agency, IIASA, RAINFOR, AfriTRON, ForestPlots.net, ForestGEO, Smithsonian Tropical Research Institute, TmFO, Universite de Toulouse, University of Leeds, UCL and CIRAD. The French National Forest Inventory data were downloaded by the Global Forest Biodiversity initiative (GFBI) at https://inventaire-forestier.ign.fr/dataifn/; the Italian Forest Inventory data were downloaded by the GFBI at https://inventarioforestale.org/. O. Bouriaud acknowledges funding from the Romanian National Council for Higher Education Funding, CNFIS, project number CNFIS-FDI-2023-F-0579. J.-C.S. considers this work a contribution to Center for Ecological Dynamics in a Novel Biosphere (ECONOVO), funded by the Danish National Research Foundation (grant DNRF173) and his VILLUM Investigator project ‘Biodiversity Dynamics in a Changing World’, funded by VILLUM FONDEN (grant 16549). ForestPlots.net and RAINFOR contributions led by O.L.P. were supported by several sources, including the Royal Society (GCRF International Collaboration Award ICA\R1\180100), the European Research Council (Advanced Grant 291585), the UK Natural Environment Research Council (NE/B504630/1, NE/D010306/1, NE/G012067/1, NE/D005590/1, NE/I028122/1, NE/S011811/1) and the Gordon and Betty Moore Foundation. The exploratory plots of FunDivEUROPE were established through funding from the European Union Seventh Framework Programme FP7/2007-2013 under grant 265171. T.M.F. was supported by a Czech Science Foundation Standard Grant (21-06446 S). We thank the FCT - Portuguese Foundation for Science and Technology, project UIDB/04033/2020 and ICNF-Instituto da Conservação da Natureza, Portugal, National Forest Inventory for support. This study used GFBI plot data originally collected in Brazil with funding by Conselho Nacional de Desenvolvimento Científico e Tecnológico (CNPq) (project 520053/1998-2). We are grateful to all the ministries and agencies from the Government of Spain that supported the collection, compilation and coordination of forest inventory data, also including the Spanish Forest Inventories. S.d.M. was supported by the Serra Húnter fellowship provided by the Government of Catalonia (Generalitat de Catalunya). C. Ammer and P. Schall thank the Deutsche Forschungsgemeinschaft (DFG) Priority Program 1374 Biodiversity Exploratories. We acknowledge the use of data drawn from the Natural Forest plot data collected between January 2009 and March 2014 by the LUCAS programme for the New Zealand Ministry for the Environment. Data were sourced through the NZ National Vegetation Survey (NVS) Databank. Data from T.R.F. was supported by NERC (NE/W001691/1, NE/N011570/1, NE/R017980/1).
Funding
Open access funding provided by Swiss Federal Institute of Technology Zurich.
Author information
Authors and Affiliations
Contributions
L. Mo, C.M.Z. and T.W.C. conceived, developed and wrote the paper. L. Mo and C.M.Z. performed the analyses, with assistance from J.v.d.H., L. Mirzagholi, D.R., A.A. and M.H. S.S.R., P.B.R., J.L., S.d.M., M.H., C. Averill, O.L.P., J.G.P.G. and G.-J.N. provided conceptual and/or editorial input to improve the manuscript. I.H., M.A., Y.C.A.Y., G.A., A.M.A.Z., B.V.A., E.A.-D., P.A.-L., L.F.A., I.A., C. Ammer, C.A.-F., A.A., L.A., V.A., G.A.A., T.R.B., R. Bałazy, O. Banki, J.G.B., M.L.B., J.-F.B., L.B., P. Birnbaum, R. Bitariho, P. Boeckx, F. Bongers, O. Bouriaud, P.H.S.B., S.B., F.Q.B., R. Brienen, E.N.B., H.B., F. Bussotti, R.C.G., R.G.C., G.C., R.L.C., H.Y.C.C., C. Chisholm, H.C., E.C., C. Clark, D.C., G.D.C., D.A.C., F.C.V., J.J.C.-R., P.M.C., J.R.C., S.D., A.L.d.G., M.D., G.D., B.D., I.D., J.D., A.D., N.L.E.O., B.J.E., T.J.E., A.B.F., T.M.F., T.R.F., L.V.F., L. Finér, M.F., C.F., L. Frizzera, D.G., H.B.G., D.J.H., A. Hector, A. Hemp, G.H., B.H., J.L.H., A. Hillers, E.N.H.C., C.H., T.I., N.I., A.M.J., B.J., V.K.J., C.A.J., T.J., I.J., V.K., K. Kartawinata, E.K., D. Kenfack, D.K.K., S.K.-R., G.K., M.L.K., T.J.K., H.S.K., K. Kitayama, M.K., H.K., F.K., D. Kucher, D.L., M.L., H.L., N.V.L., B.S. Maitner, Y.M., E.M., B.S. Marimon, B.H.M.-J., A.R.M., E.H.M., J.A.M., O.M.-C., C. Mendoza, I.M.-P., S.M., C. Merow, A.M.M., V.S.M., S.A.M., P.M., M.G.N.-M., D.N., V.J.N., R.V.N., M.R.N., P.A.N., J.O., P.O., E.O.-M., Y.P., A.P., A.P.-G., E.I.P., M. Park, M. Parren, N. Parthasarathy, P.L.P., S.P., N. Picard, M.T.F.P., D.P., N.C.A.P., A.D.P., J.R.P., H.P., F.R.A., Z.R.-C., M.R., S.G.R., A.R., F.R., E.R., P. Saikia, C.S.-E., P. Saner, P. Schall, M.-J.S., D. Schepaschenko, M.S.-L., B. Schmid, J. Schöngart, E.B.S., V.S., J.M.S.-D., D. Sheil, A.Z.S., J.E.S.-E., M. Silveira, J. Singh, P. Sist, F.S., B. Sonké, A.F.S., K.J.S., J.-C.S., M. Svoboda, B. Swanepoel, N. Targhetta, N. Tchebakova, H.t.S., R.T., E.T., P.M.U., V.A.U., R.V., F.V., F.v.d.P., T.V.D., M.E.v.N., R.M.V., H. Verbeeck, H. Viana, A.C.V., S.V., K.v.G., H.-F.W., J.V.W., G.D.A.W., S.K.W., F.W., H.W., V.W., R.Z., T.Z.-N., C.Z., X.Z., M.Z., Z.-X.Z. and I.C.Z.-B. provided data for the analysis. All authors reviewed and approved the manuscript.
Corresponding authors
Ethics declarations
Competing interests
The authors declare the following competing interests: T.W.C. serves as the chair of the UN Decade on Ecosystem Restoration, the chair of Restor.eco and he is an advisor to 1T.org. All are unpaid positions that aim to promote the equitable conservation and restoration of nature. R.L.C. is an advisor to 1T.org. J.-C.S. serves pro bono in the supervisory board for Rewilding Europe (non-governmental organisation), which is operating several interconnected initiatives to help make Europe a wilder place. P.H.S.B. is partner at Re.green, a company dedicated to restoring native ecosystems. S.A.M. at present serves as the executive director of BioCarbon International, a global think tank dedicated to achieving carbon neutrality through nature-based solutions. The position S.A.M. holds is voluntary and has no relation with the findings of the study.
Peer review
Peer review information
Nature thanks the anonymous reviewers for their contribution to the peer review of this work.
Additional information
Publisher’s note Springer Nature remains neutral with regard to jurisdictional claims in published maps and institutional affiliations.
Supplementary information
Supplementary Information
Supplementary Figs. 1–17, Supplementary Tables 1–7 and Supplementary References.
Rights and permissions
Open Access This article is licensed under a Creative Commons Attribution 4.0 International License, which permits use, sharing, adaptation, distribution and reproduction in any medium or format, as long as you give appropriate credit to the original author(s) and the source, provide a link to the Creative Commons licence, and indicate if changes were made. The images or other third party material in this article are included in the article’s Creative Commons licence, unless indicated otherwise in a credit line to the material. If material is not included in the article’s Creative Commons licence and your intended use is not permitted by statutory regulation or exceeds the permitted use, you will need to obtain permission directly from the copyright holder. To view a copy of this licence, visit http://creativecommons.org/licenses/by/4.0/.
About this article

Cite this article
Mo, L., Zohner, C.M., Reich, P.B. et al. Integrated global assessment of the natural forest carbon potential. Nature 624, 92–101 (2023). https://doi.org/10.1038/s41586-023-06723-z
Received:
Accepted:
Published:
Issue Date:
DOI: https://doi.org/10.1038/s41586-023-06723-z
This article is cited by
-
Enhanced future vegetation growth with elevated carbon dioxide concentrations could increase fire activity
Communications Earth & Environment (2024)
-
Shaping and enhancing resilient forests for a resilient society
Ambio (2024)
Comments
By submitting a comment you agree to abide by our Terms and Community Guidelines. If you find something abusive or that does not comply with our terms or guidelines please flag it as inappropriate.
