


Eating a variety of foods in early childhood is particularly well recognised as being important for optimal nutritional status across the life course(1–Reference Herman, Baer and Adams3). According to the United Nations FAO, food variety refers to the consumption of a mixture of foods from a range of food groups(4). The FAO global dietary guidelines recommend that people should eat a wide variety of food for a balanced diet and, as such, introduced the food diversity score (FDS). The FDS assesses the diet of people at the local level, whereby diversity in the number of food groups can be used as an indicator to assess the nutritional quality of the whole diet and has been promoting the assessment of household and individual dietary diversity worldwide(4,5) .
In previous studies, a dietary plan with practical food amount based on a variety of foods within preschool children’s energy requirements was proposed(Reference More and Emmett6,Reference Richter, Daelmans and Lombardi7) . However, many young children develop unbalanced diets due to picky eating, among other habits(Reference Black, Walker and Fernald8,Reference Sandvik, Ek and Eli9) . The National Nutrition Survey on Preschool Children (NNSPC) conducted in Japan reported that approximately 80 % of parents expressed frequent concerns about the dietary habits of their children(10). Studies have particularly linked limited dietary variety to low intakes of fruits and vegetables and high intakes of unhealthy processed food(Reference Helland, Bere and Øverby11,Reference Fernandez, Kasper and Miller12) , with possible consequences including obesity(Reference Fernandez, Kasper and Miller12).
Preschool children’s dietary behaviours and diet quality are associated with home environment and parental behaviours(Reference Spurrier, Magarey and Golley13,Reference Romanos-Nanclares, Zazpe and Santiago14) . Many parents recognise the need to be aware of and closely manage their children’s diet to ensure food diversity, including contents of foods and snacks (e.g., nutritional balance, flavouring and seasoning, and amount of food), mealtime practice (e.g., regular mealtimes and chewing well) and parent–child communication (e.g., cooking meals with children and eating together)(10). Previous research has related parents and children cooking meals together to higher food diversity of children’s diets(Reference Ishikawa, Eto and Miyoshi15). However, few academic studies have comprehensively examined how parental care behaviours are related to children’s food diversity.
Therefore, the aim of the current study was to identify the relationship between preschool children’s food diversity and their parents’ care behaviours with regard to their diet including contents of foods and snacks, mealtime practice and parent–child communication.
Methods
Data for the study were retrieved from the NNSPC, which was conducted on September 2015 by the Ministry of Health, Labour and Welfare (MHLW) in Japan(10). The NNSPC aims to obtain basic data for promoting breast-feeding and improving the eating habits of infants and preschool children by understanding the actual conditions of nutrition and diet of infants and preschoolers across the nation. This survey is conducted every 10 years. The survey method and items were examined by establishing an expert study group in the MHLW.
Study population and procedure
Figure 1 shows the study population and procedure. Children aged ≤6 years as of 31 May 2015 were randomly selected from households among 1106 districts for the Comprehensive Survey of Living Conditions, conducted by the MHLW. Three districts affected by heavy rain in September 2015 were excluded from the survey target area. First, the MHLW explained the survey method to the prefectures. Subsequently, the prefectural public health centre employed investigators to visit the households selected for this survey. The investigators asked the children’s mothers (or caregivers) to complete a questionnaire, which was collected at a later date. In total, 2992 households with 3936 children aged ≤6 years participated in the survey. The response rate of the survey was 56·8 %. The questionnaires associated with sixty-five children were excluded because information on age was not available. Finally, 3871 questionnaires were collected for analysis(10). A database was prepared by the Maternal and Child Health Division, Department of Equal Employment and Children’s Family, MHLW.

Fig. 1 Study population and procedure diagram of the current study
The NNSPC has two types of questionnaires, one of which is restricted to infants aged <2 years and the other of which encompasses children aged 2–6 years. Data obtained from the latter questionnaire were used in the current study. In total, 2143 persons responded to all items consistent with the purpose of the current study.
Measurement
Children’s dietary patterns in relation to the eight food groups (grains, fish, meat, eggs, soyabeans/soya products, vegetables, fruit and milk) were evaluated as objective variables, as well as their intake of processed foods, whereby four items (sweetened beverages, confectioneries, instant noodles and fast food) were investigated. The survey inquired how often the children consumed foods in each group (≥2 times/d, once a day, 4–6 d/week, 1–3 d/week or less than once a week or rarely)(10,Reference Kamata, Kurasawa and Tohmata16) . The FAO’s FDS was applied to assess the nutritional quality of the whole diet(5).
Thirteen items assessed parents’ care behaviour in relation to children’s diets based on previous studies, which confirm their validity and reliability, with professional support to provide nutrition consultation. We posed the question ‘Are you (parent) careful about your child’s diet?’ with regard to the following thirteen items: (1) food : seven items comprising nutritional balance, flavouring and seasoning, size or softness, assorted arrangements and colours (colour and placement of the cooked foods on the plate), amount and snack (contents, amount)(Reference Yee, Lwin and Ho17–Reference Russell, Worsley and Liem20); (2) mealtime practice: three items comprising regular mealtimes, chewing well, table manners(Reference Yee, Lwin and Ho17,Reference Metcalfe and Fiese21) and (3) parent–child communication: three items comprising enjoyment of eating, eating together, cooking together(Reference Yee, Lwin and Ho17,Reference Blaine, Kachurak and Davison18) . Of the thirteen items related to parental care emphasised in the current study, five items (nutrition balance, amount, regular mealtimes, table manners and eating together) were researched in both the 2005 and 2015 surveys, and eight other items were newly added in the 2015 survey. Each item was scored based on ‘yes’ or ‘no’ responses.
Explanatory variables related to parents included their relationships with their children, age of mother, current employment status of mother, household structure (i.e., presence of other children, grandparents and others), subjective economic status, leisure time (i.e., affluent, somewhat, neither, not so much, unable to afford at all), the place where the child spends time during the day (i.e., nursery school, kindergarten, centres for early childhood education and care, grandparents and relatives, or none of the above) and lifestyle regarding eating breakfast with parents. In addition, data concerning children’s age; height; weight; nutritional status (degree of obesity); food allergies; tooth decay and time spent on TV, video and games were obtained.
Nutritional status of children
The nutritional status of children was determined based on body weight and height. The degree of obesity (%) was calculated using the following formula: self-reported body weight (g) − standard body weight (g) for height/standard body weight (g) for height × 100. The judgement criteria for the degree of obesity were ‘obese’ (≥30 %), ‘overweight’ (20–30 %), ‘tendency to be overweight’ (15–20 %), ‘standard’ (−15 to +15 %), ‘tendency to be underweight’ (< 15 % to < 20 %) and ‘underweight’ (< 20 %). The standard body weight was calculated using the formula of standard body weight for height in Japanese children(22,Reference Kato, Takimoto and Yokoyama23) . The formula does not consider age because the standard body weight for height curves was almost identical for children aged 1–6 years(24).
Height and weight were self-reported questions because there is a rule that the same item should not be surveyed repeatedly to the people by different surveys according to the regulations of the MHLW. As the height and weight of children are surveyed by the National Growth Survey on Preschool Children in 2010(24), these data were not measured in the NNSPC and were asked in a self-reported method. However, in Japan, many parents measure the physique of an infant or preschool child at home; it is also often measured at day care centres and kindergartens. Therefore, it might be considered that several measured values were described in the survey.
Statistical analysis
The FDS of children comprised the total number of eight food groups being consumed at least once a day(4,10,Reference Wang, van der Horst and Jacquier19) . The FDS was one point if consumption occurred once or more per day or zero points if less than that. There were eight types of foods; thus, the maximum score was eight points. Once the FDS distribution was identified, the FDS was divided into two groups according to medians: (1) three or fewer points and (2) four or more points(4). The processed food score was calculated according to the total number of four food items (sweetened beverages, confectioneries, instant noodles and fast food) being consumed at least once a day(4). As in the case of FDS, the processed food score was calculated as a score of one point if the food type was consumed at least once a day or zero points if less than that. There were four types of foods; thus, the maximum score was four points.
The sex of the parent who answered the questionnaire, age and socio-economic status as well as children’s sex; nutritional status; food allergies; tooth decay and time spent on TV, video and games were compared between the two FDS groups. Furthermore, the total value calculated from the thirteen items of the parent’s care behaviour in children’s diets was compared between the two FDS groups.
Multiple regression analysis analysed relationships between FDS scores and several variables, including the total value of the parent’s care behaviours in children’s diets; subjective socio-economic status; food allergies; tooth decay and time spent on TV, video and games, as well as the child’s age and mother’s age. The continuous variables included the total value of the parent’s care behaviours in children’s diets, the child’s age and the mother’s age. The nominal variables such as subjective socio-economic status; food allergies; tooth decay and time spent on TV, video and games were converted to an ordinal scale.
Next, we used logistic regression to specifically analyse the relationship between the variables and the higher FDS group. Multivariate analysis was performed for each of the thirteen items measuring parental care in relation to children’s diets using a logistic regression model that adjusted for the parent’s relationship with the child, child’s sex, employment status of the mother and household structure (model 1).
Additional multivariate analysis was performed for each of the thirteen items measuring parental care in relation to children’s diets using a logistic regression model that adjusted for the parent’s relationship with the child, child’s sex, employment status of the mother, household structure, subjective economic status, leisure time and place where the child spends time during the day (model 2).
All statistical analyses were performed using SAS software, version 9·4 (SAS Institute, Inc.). A probability (P) value of <0·05 was considered statistically significant.
Results
Figure 2 shows the children’s FDS distribution. Scores ranged from 0 to 8 points, and there was a normal distribution with a median of four points. The median was divided into two groups: ≥4 points (n 1151) and ≤3 points (n 992).

Fig. 2 Distribution of food diversity score in children
Table 1 compares the characteristics of mother’s age (P = 0·001) and employment status, family members living together, subjective economic status and leisure time, and the places where children spend the day according to FDS group. The mean age of mother (36·3 years) in the ‘higher FDS’ group was 1 year older than those in the ‘lower FDG’ group (35·5 years) (P = 0·001). The subjective economic status of the ‘higher FDS’ group was better than that of the ‘lower FDS’ group (P < 0·0001). In addition, children of the higher FDS group were more likely to be in nursery school (P = 0·041), whereas children of the lower FDS group were more commonly in kindergarten (P = 0·034). A higher proportion of parents in the lower FDS group tended to skip breakfast (P = 0·0002). There were no significant differences in the other variables between the two groups.
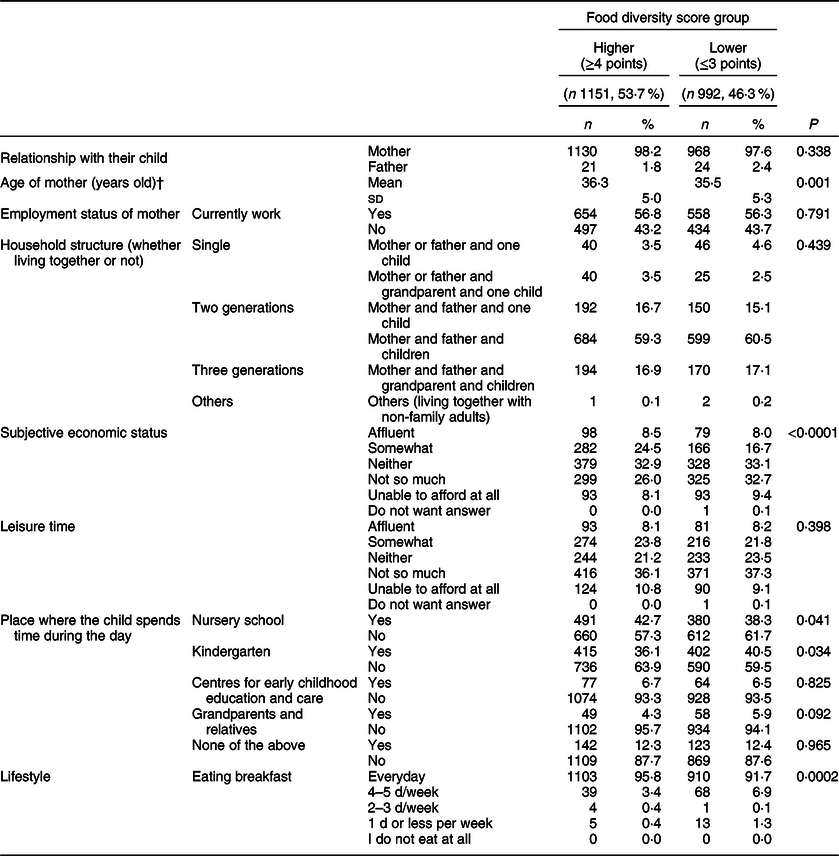
Table 2 compares the children’s age; sex; nutritional status; food allergies; tooth decay and time spent on TV, video or games between the two FDS groups. The nutritional status did not point to a significant relationship with FDS. In total, 92·1 and 93·6 % of children in the higher and lower FDS groups, respectively, were included in the standard range for Japanese children. The children in the lower FDS group had more tooth decay (P = 0·006), whereas those in the higher FDS group had spent < 2 h/d on TV, video or games during the weekdays (P = 0·005) and weekends (P = 0·002).
Table 2 Child health and lifestyle situation by food diversity group*
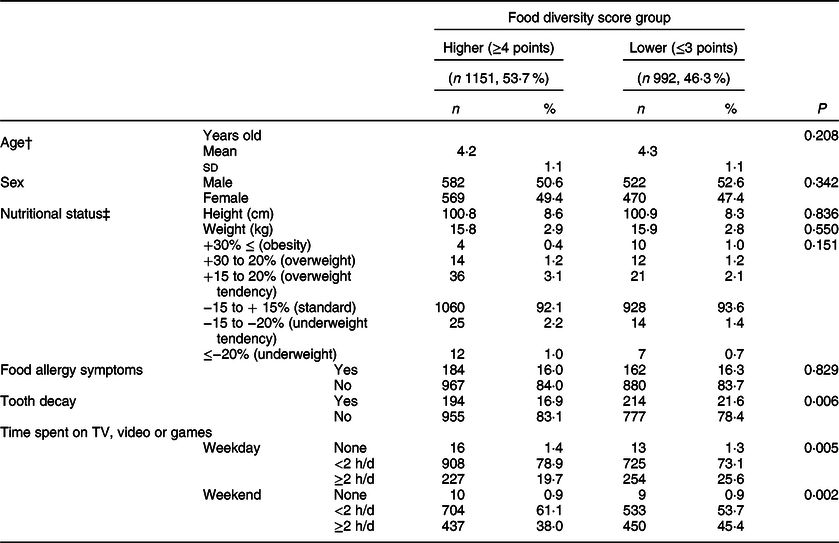
* χ 2 test.
† : t test.
‡ The standard body weight for height in Japanese children.
Table 3 presents differences in food intake between two FDS groups. The higher FDS group had higher frequencies of grains, fish, meat, eggs, soyabeans/soya products, vegetables, fruits and milk intake than the lower FDS group but less frequencies of instant noodle and fast-food intake.
Table 3 Food intakes by food diversity group
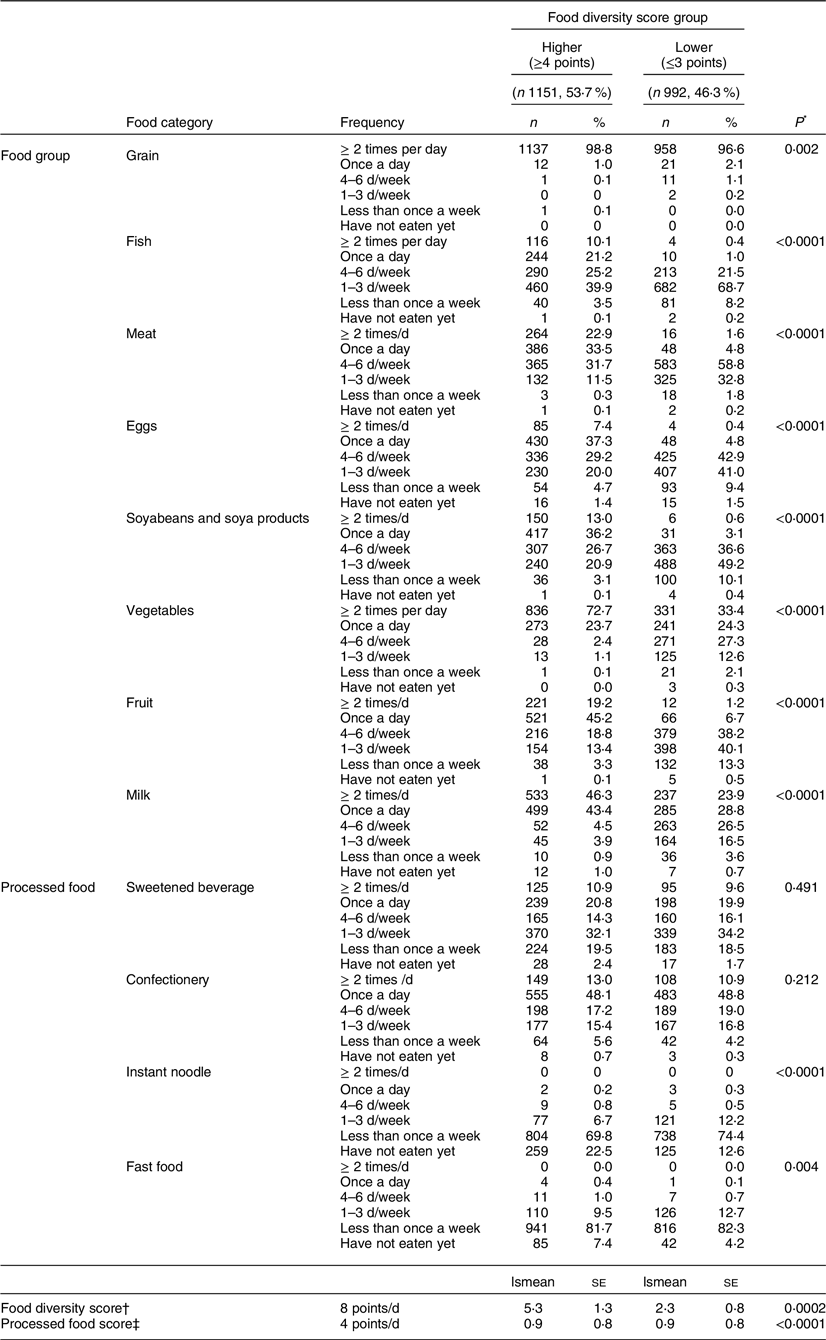
* χ 2 test.
† ANCOVA. Food diversity score: the total number of eight food groups (grain, fish, meat, eggs, soyabeans and soya products, vegetables, fruit and milk) eaten at least once a day.
‡ Adjusted relationship for the child, sex of child, employment status of mother, family living together, subjective economic status and leisure time, caregiver of the child during the day. Processed food score: the total number of four food items (sweetened beverage, confectionery, instant noodle and fast food) eaten at least once a day.
Table 4 compares the proportion of parental care in relation to children’s diets (thirteen items) between the two FDS groups. In the higher FDS group, the proportion of parents who reported being careful with respect to nutritional balance (P < 0·001), flavouring and seasoning (P = 0·004), assorted arrangement and colours (P = 0·002), contents of snack (P < 0·001), amount of snack (P = 0·015), regular mealtimes (P < 0·001), chewing well (P = 0·002), enjoying eating (P = 0·032) and eating together (P = 0·030) were significantly higher than in the lower FDS group.
Table 4 Parent’s care on diet of child by food diversity group
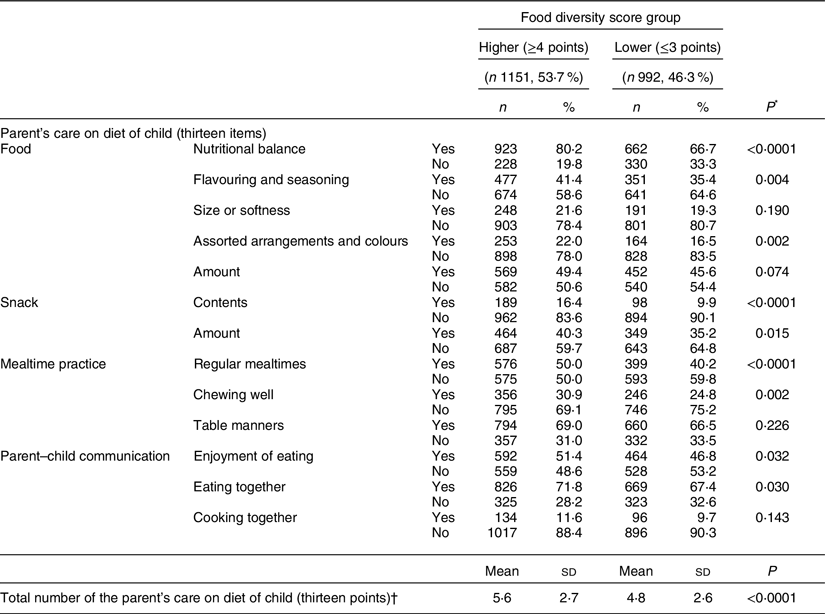
* χ 2 test.
† t test.
Table 5 shows the results of the multiple regression analysis of factors related to FDS. Parental care behaviours concerning children’s diets were strongly associated with children’s FDS. The total number of the items of parental care of children’s diets (P < 0·001) and mother’s age (P = 0·01) were positively associated with FDS, whereas subjective economic status (P = 0·003) and TV, video or games during the weekdays (P = 0·01) were negatively associated with FDS.
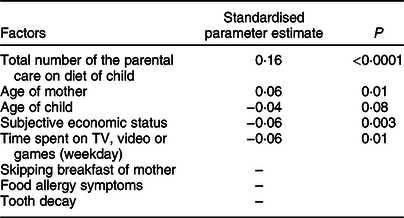
P: selected by stepwise method.
* Factors related to FDS: total number of the parent’s care on diet of children, subjective economic status, food allergies, tooth decay, time spent on TV, video or game, child’s age and mother’s age.
† Continuous variable: total number of the parent’s care on diet of children, child’s age and mother’s age.
‡ Nominal variable (ordinal scale): subjective economic status (1: affluent, somewhat, 2: neither, 3: not so much, unable to afford at all, do not want answer), food allergies symptoms (1: yes, 2: no), tooth decay, (1: yes, 2: no) and time spent on TV, video or game (1: none, 2:< 2 h/d, 3:≥ 2 h/d).
Table 6 shows the results of the associations between ‘parental care of children’s diets’ and ‘FDS group’ using stepwise multivariate analysis.
Table 6 Relationship between food diversity and parent’s care on diet of child (n 2143)*
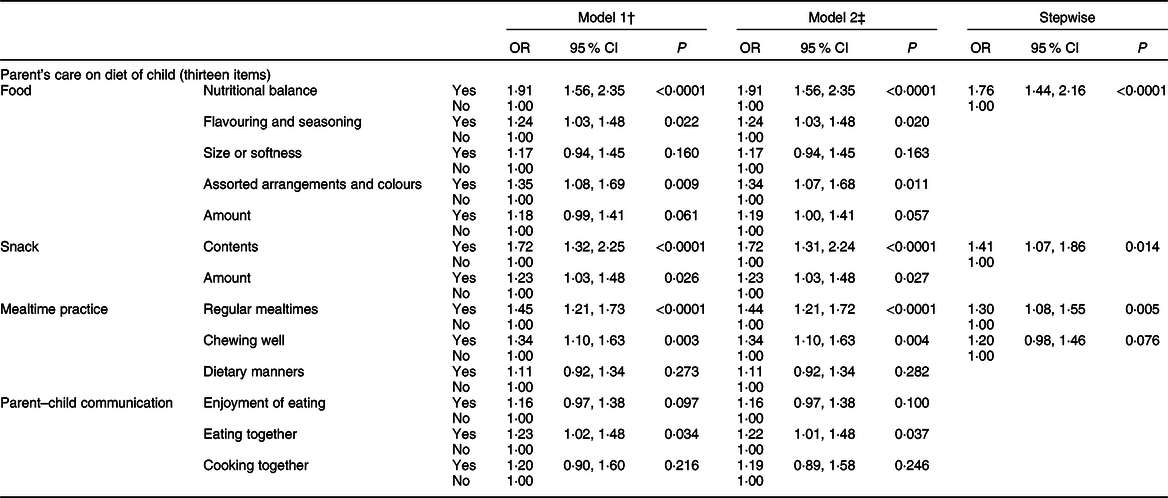
* Food diversity score (0: ≤ 3 points; 1: ≥ 4 points).
† Model 1: adjusted for the relationship with the child (mother or father), child’s sex, employment status of parent (yes or no) and family members in the household (other children, grandparents and others).
‡ Model 2: adjusted for the relationship with the child (mother or father), child’s sex, employment status of parent (yes or no), family living together (other children, grandparents and others), subjective economic status (affluent, somewhat, neither, not so much or unable to afford at all), leisure time (affluent, somewhat, neither, not so much, unable to afford at all) and place where the child spends time during the day (nursery school, kindergarten, centre for early childhood education and care, with grandparents, with relatives, staying at home).
A number of model 1 variables were identified as predictors for FDS. Five of seven factors in the food category were positively and significantly associated with FDS: nutritional balance (OR = 1·91; 95 % CI 1·56, 2·35; P < 0·001); flavouring and seasoning (OR = 1·24; 95 % CI 1·03, 1·48; P = 0·022) and assorted arrange and colours (OR = 1·35; 95 % CI 1·08, 1·69; P = 0·009). The content and amount of snack category were positively and significantly associated with FDS; contents (OR = 1·72; 95 % CI 1·32, 2·25; P < 0·001) and amount (OR = 1·23; 95 % CI 1·03, 1·48; P = 0·026). Two of the three factors in the ‘mealtime practice’ category were positively associated with FDS, namely regular mealtimes (OR = 1·45; 95 % CI 1·21, 1·73; P < .0·001) and chewing well (OR = 1·34; 95 % CI 1·10, 1·63; P = 0·003). With regard to the parent–child communication category, only eating together (OR = 1·23; 95 % CI 1·02, 1·48; P = 0·034) was significantly associated with FDS.
The model 2 analysis confirmed the variables associated with FDS. For ‘food’, the same results as those identified for model 1 above were achieved for nutritional balance (OR = 1·91; 95 % CI 1·56, 2·35; P < 0 0001) and flavouring and seasoning (OR = 1·24; 95 % CI 1·03, 1·48; P = 0·020). However, slightly different yet still significant results were found related to assorted arrangements and colours (OR = 1·34; 95 % CI 1·07, 1·68; P = 0·011). Furthermore, snack contents and snack amounts were associated with FDS (OR = 1·72; 95 % CI 1·31, 2·24; P < 0·001; OR = 1·23; 95 % CI 1·03, 1·48; P = 0·027, respectively). Similarly, for the ‘mealtime practice’ category, the same results were identified for chewing well (OR = 1·34; 95 % CI 1·10, 1·63; P = 0·004); however, slightly different values were found regarding the association between FDS and regular mealtimes (OR = 1·44; 95 % CI 1·21, 1·72; P < 0 0·001). In the parent–child communication category, eating together (OR = 1·22; 95 % CI 1·01, 1·48; P = 0·037) was again the only factor significantly associated with FDS.
The results of the stepwise analysis identified several predictors for FDS, including nutritional balance of food (OR = 1·76; 95 % CI 1·44, 2·16; P < 0·001), snack contents (OR = 1·41; 95 % CI 1·07, 1·86; P = 0·0014) and regular mealtimes (OR = 1·30; 95 % CI 1·08, 1·55; P = 0·005).
Discussion
The current study identified that lower food diversity was associated with a higher likelihood that parents skipped breakfast and greater consumption of processed or fast foods, as well as more time spent per day on TV, video or games. Furthermore, the higher FDS group was associated with greater parental care about the contents of children’s diets and qualitative aspects of eating, such as regular mealtimes and eating together
In Japan, where the social trend of people owning and spending time on smart phones or tablet PC has been increasing, it has been reported that a mother’s unhealthy lifestyle correlates strongly with prolonged screen time among school-aged children(Reference Yamada, Sekine and Tatsuse25). A European longitudinal study targeted 2–9-year-old children and indicated the effects of TV viewing and other screen activities for young children, both on their consumption of sugary drinks and an increase in BMI(Reference Olafsdottir, Berg and Eiben26). In Japan as well, it would be necessary to study the effect of screen time during early childhood on the children’s food and snack intake.
In Japan’s NNSPC, the proportion of parental participants who ensured the nutritional balance of foods (72·0 %) was higher than those who were careful about snack contents (12·4 %) and having regular mealtimes (45·0 %). The effects of meal timing and frequency on children’s health have been a research topic for many years, and changing the behaviour of parents and children who do not have regular mealtimes is a complex issue. Previous study findings have indicated a close relationship between children’s mealtimes and their parents’ working times and other lifestyle elements(Reference Bekelman, Bellows and Clark27).
It may be possible to change parents’ behaviour and increase dietary diversity by providing nutritional guidance on the contents of foods and snacks consumed both in and outside out of the home(Reference Moreira, Severo and Oliveira28). In addition, to combat picky eating habits, it is important to promote interventions that support skills for food choice and preparation(Reference Muehlhoff, Wijesinha-Bettoni and Westaway29) and food environments that change the diet quality at home(Reference Ishikawa, Eto and Miyoshi15,Reference Robson, Ziegler and McCullough30,Reference Ishikawa, Eto and Haraikawa31) . According to Helland et al., behaviours that can improve food diversity in early childhood include modelling, responsive feeding, repeated exposure and enjoyable meals(Reference Helland, Bere and Øverby11).
According to the results of the NNSPC, 41·9 % of 2–3-year-old and 28·9 % of 5-year-old and above children consume sweetened beverages and confectionaries twice a day or more, as snacks. The proportion of those who did not have a fixed snack time was 43·7 %(10). As such, early childhood nutritional education should include information on both snack contents and timing.
In addition, to broaden the food diversity of children, it is important to consider the content of snacks. Prior research has identified fruits, milk and dairy products among the top ten most frequently eaten foods and beverages consumed as snacks by children in Australia, China, Mexico and the USA; however, confectionery, cookies, candy, ice creams and cakes are also seen among the top ten snacks. These undermine the nutritional benefits of healthier foods and contribute to poor dental health(Reference Wang, van der Horst and Jacquier19). Some dental investigations of preschool children suggest a significant relationship between snack items (e.g., sweet buns) and caries(Reference Goto, Yamamoto and Saito32–Reference Watanabe, Wang and Ijichi34).
Evidence of the effects of snacks on health status, especially in children, is still weak. The lack of consistent evidence related to this issue may be partly due to a non-standardised definition of snack contents(Reference Younginer, Blake and Davison35). In the future, researchers should investigate snack contents and amounts within the early childhood population in Japan to inform public policy for healthy snacks in this age group.
There were several limitations to the current study that should be addressed. First, the response rate of the survey was only 56.8 %. We relied on the 2015 database of the NNSPC conducted by the MHLW. In that investigation, 3871 questionnaires were collected from 3936 children; however, only 2143 participants responded to all of the survey items. The most unanswered items concerned height, weight and subjective economic status. It may have been difficult for some parents to subjectively gauge their economic status. However, the height and weight might be measurable at homes, daycare centres or kindergartens.
Second, the items related to the effects of the food habits of parents on the food diversity of children are limited in the NNSPC. Parental habits may influence the food diversity of the children and parents(Reference Spurrier, Magarey and Golley13,Reference Romanos-Nanclares, Zazpe and Santiago14,Reference Yee, Lwin and Ho17,Reference Metcalfe and Fiese21,Reference Ishikawa, Eto and Haraikawa31) . Furthermore, information regarding socio-economic status was self-reported. Analysing the actual situation through socio-economic status is necessary for the survey rather than relying on self-reported information. In the future, therefore, cross-referencing the data from the NNSPC with those of other national surveys that measure actual socio-economic status (e.g., Comprehensive Survey of Living Conditions) may be necessary for analysis.
Conclusion
The current study assessed relationships between young children’s dietary diversity and parental care behaviours regarding foods and found that parental care was a predictor of greater food diversity. Children’s diets are strongly based on parents’ care concerning the contents of children’s foods and snacks and regular mealtimes. The results of the current study can be used to inform efforts to develop and implement nutritional guidance education for parents and nutrition staff, including school meal providers.
Availability of data and materials
Permission for the use of the dataset in the current study was obtained from the MHLW, Japan. All data belong to the MHLW, and the database cannot be used for other studies.
Acknowledgements
Financial support: This work was supported by the Health and Labour Sciences Research Grant in 2018 for the ‘Development of a food, nutrition, and dietary guide for healthy development in early childhood’ (H29 Sukoyaka Ippan-003). The funders had no role in study design, data collection/analysis, decision to publish or preparation of the manuscript. Conflict of interest: The authors declare that there is no conflict of interest. Authorship: M.I. designed the research and wrote the manuscript, and T.Y. provided statistical analysis support. K.E., M.H., T.Y. and N.Y. contributed to interpreting the data and revising the manuscript for scientific clarity. All authors have read and approved the final manuscript. Ethics of human subject participation: The present study is based on anonymised data available in the Ministry of Health, Labour and Welfare, Japan. The current study was conducted according to the guidelines laid down in the Declaration of Helsinki and all procedures involving research study participants were approved by the Ethics Committee of the National Institute of Public Health, Wako, Saitama, Japan (NIPH-TRN#12021, February 1, 2018).


 Open access