


In Europe, unhealthy diets, including overconsumption, contribute to a substantial rise in the incidence of obesity and non-communicable diseases, including CHD, type 2 diabetes and cancer(Reference Forouzanfar, Alexander and Anderson1). Diets not only impact human health but also the environment(Reference Vermeulen, Campbell and Ingram2–Reference Steinfeld, Gerber and Wassenaar4). Hence, there is an urgent need to shift towards healthier and environmentally sustainable diets. Such diets would fulfil nutritional requirements, reduce overall disease risk and can be produced within planetary boundaries. In order to find the best balance between the health and environmental dimensions of a diet, mathematical modelling and optimisation techniques are often employed(Reference Buttriss, Briend and Darmon5–Reference Ferrari, Benvenuti and Rossi7).
Various models have been developed to optimise diets using individual-level data from specific countries and with specified objectives for health and the environment(Reference Dantzig8,Reference van Dooren9) . Generally, these diet models have taken the form of linear programming and started from a set of food items from dietary surveys with the goal of composing a total diet that satisfies a predefined set of norms for nutritional requirements and environmental footprints. As these models are based on single and unrelated food items, additional constraints are needed to account for cultural acceptance and dietary preferences of the optimised diet(Reference Gazan, Brouzes and Vieux6,Reference Mertens, van’t Veer and Hiddink10) . Examples include the minimum and maximum amount of foods consumed; the associations among foods in meals, such as breakfast cereal and milk and bread and jam and the popularity of foods by minimising deviations from the observed average diet(Reference Smith11).
Recently, Kanellopoulos et al. (2020)(Reference Kanellopoulos, Gerdessen and Ivancic12) presented Data Envelopment Analysis (DEA) as a benchmarking approach that models new diets as a linear combination of observed diets, which implicitly maintains the basic interrelationships among food items in the diet of the study population. Such an approach allows diets from different countries to be modelled in a comparable way and accounts for cultural acceptance and dietary preferences without specifying additional constraints for each country. The present study applies this benchmarking approach to individual-level food consumption data from four European countries, i.e. Denmark, Czech Republic, Italy and France. For men and women in each country, trade-offs are addressed between nutrient quality, environmental impact and dietary preferences. By providing solutions within the range of existing diets, such benchmark models could be useful to guide policies towards healthier and more environmentally sustainable diets that are culturally acceptable for each country and contribute to health and environmental sustainability goals at both the national and European level.
Methods
Study population and food intake data
Food consumption data for the adult population, aged 18–64 years, were obtained from nationally representative dietary surveys in four countries: including DANSDA (2005–2008) in Denmark, based on 7-d diet records on consecutive days(Reference Pedersen, Fagt and Groth13); SISP04 (2003–2004) in the Czech Republic, based on two 24-hour recalls spaced over 3–5 months(Reference Ruprich, Dofkova and Rehurkova14); INRAN-SCAI (2005–2006) in Italy, based on 3-d diet records on consecutive days(Reference Leclercq, Arcella and Piccinelli15) and INCA-2 Study (2006–2007) in France, based on 7-d diet records on consecutive days(16). In order to enable fair cross-country comparisons, we sampled two non-consecutive days for each country(Reference Mertens, Kuijsten and Dofkova17).
Food intakes were classified for each country according to the FoodEx2 classification developed by the European Food Safety Authority(18,19) . Nutrient composition of the consumed foods was estimated using country-specific food composition databases(20–26). As explained in our previous publication(Reference Mertens, Kuijsten and van Zanten27), estimates of greenhouse gas emission (GHGE, in kgCO2equivalents (kgCO2eq)/kg food as eaten) were first obtained from a standardised life-cycle assessment database of GHGE values (SHARP-Indicator Database(Reference Mertens, Kaptijn and Kuijsten28)). GHGE was then assigned to each of the 944 FoodEx2-codes that were consumed in the four countries.
Quantities of foods were calculated for each individual using the mean of 2 d and were expressed per 10·460 MJ (2500 kcal) for men and per 8·368 MJ (2000 kcal) for women(Reference Willett, Howe and Kushi29). In this way, we accounted for the observed variation in the amounts of foods consumed for different levels of reported energy intake, while maintaining the composition of the diet. Under- and over-reporters were excluded using the Goldberg equation(Reference Goldberg, Black and Jebb30) as adopted by Black(Reference Black31), i.e. cut-off value of 0·96 and 2·49 for a ratio of reported to energy requirement. The present study was conducted on a final sample of diets of 1385 adults in Denmark, 1386 adults in the Czech Republic, 1978 adults in Italy and 1713 adults in France.
The benchmark diet model
As described by Kanellopoulos et al.(Reference Kanellopoulos, Gerdessen and Ivancic12), the DEA model was used for modelling diets based on nutritional benchmarking that starts from observed diets in a population sample. Differently from Kanellopoulos(Reference Kanellopoulos, Gerdessen and Ivancic12), we specified food groups rather than nutrient intakes as dietary components to in- or decrease in order to arrive at a healthier diet. Thus, the present DEA model uses food-based dietary guidelines (FBDG, see Table 1) as an a priori defined set of guidelines that accounts for the integrated evidence on diet-related disease risk and nutritional adequacy. For each of the observed diets, the model identifies a number of peers with a so-called efficient diet that performs better with respect to the FBDG, i.e. basically with a higher ratio of ‘dietary components to increase’ to ‘dietary components to decrease’. This identification of efficient diets was solved in two stages(Reference Kanellopoulos, Gerdessen and Ivancic12,Reference Cooper, Seiford and Kaoru32) , using Xpress-IVE release 1·24. Subsequently, for each subject healthier diets are calculated as a linear combination of the efficient diets of his/her peers. In this modelling step, these ‘healthier’ linear combinations were constructed in a way to remain as close as possible to the observed diet (MaxP, most preferable), are the healthiest (maxH, highest nutrient density score) or the most environmentally sustainable (MaxS, lowest GHGE). Diets were modelled for each country and for men and women separately.
Table 1 Dietary components to identify existing healthier diets while benchmarking diets, including capping values if necessary*
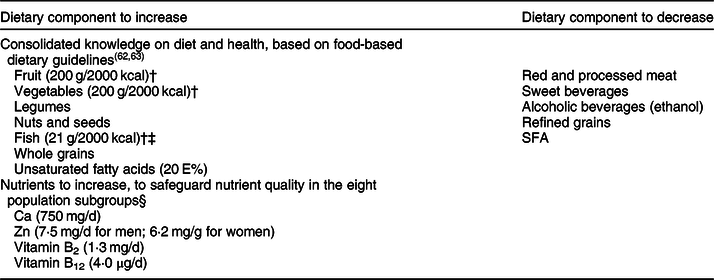
* Capping values for food groups were based on an inventory of current food-based dietary guidelines of European countries(Reference Mertens, Kuijsten and Dofkova17), for nutrients were obtained from European Food Safety Authority using average requirement, and adequate intake, if average requirement cannot be set(64).
† To convert kcal to kJ multiply it by 4·184.
‡ Amount of fish consumed on an intake day cannot be representative for a usual day due to toxicological risks(65); therefore, high intake amounts of above 64 g/d were replaced by the lowest observed non-zero intake divided by two to put high intakes at a disadvantage while benchmarking diets.
§ Nutrients to be safeguarded, i.e. nutrients were to be safeguarded when modelled nutrient intake, as calculated using the DEA model based on food-based dietary guidelines variables, was lower than the observed intake and <125% of the reference value for that nutrient. This criterion was added because of the data on Czech women; and did not affect the modelling results for other population groups.
Model variables and identification of efficient diets
The energy-standardised survey data were used as the set of observed diets from which efficient diets were identified. For the variable selection, foods were classified into food groups that correspond to health-based FBDG based on available scientific evidence for diets to reduce non-communicable disease risk factors in the four countries(Reference Mertens, Kuijsten and Dofkova17). Instead of oils, we included unsaturated fats to increase and saturated fats to decrease. For alcoholic drinks, we used calculated ethanol intake. After including these FBDG-based variables in the model, we subsequently identified and added nutrients that needed to be safeguarded. These were defined as nutrients for which the modelled mean intake after improving adherence to FBDG was lower than the observed intake and was <125 % of the reference value for that nutrient (Table 1).
For each observed diet and all dietary components included (as mentioned in Table 1), the DEA model compares and weighs the multidimensional ratio of ‘dietary components to increase’ to ‘dietary components to decrease’. As this decision variable is essentially based on ratios, zero intakes are not permitted. Therefore, zero intakes of food groups were replaced by the observed lowest non-zero intake of that food group divided by two(Reference Zhu and Cook33). Similar to the calculation of the Nutrient Rich Diet score(Reference Fulgoni, Keast and Drewnowski34,Reference Drewnowski35) , the amount consumed for certain food groups and nutrient intakes were capped if higher intakes were not considered to provide additional health benefits (Table 1). For example, consuming up to 200 g of fruit per 8·368 MJ (2000 kcal) was considered linearly related to increased benefits, whereas no additional benefits were attributed to consuming >200 g per 8·368 MJ (2000 kcal). For the food groups in which higher intakes above a certain level are considered harmful, such as fish (see Table 1), observed intakes higher than this level were replaced by the lowest observed non-zero intake divided by two. This ensured that these diets are less likely to be included as a benchmark.
Modelled diets and trade-offs
For each inefficient diet in the observed data, an alternative healthier diet was modelled as a linear combination of the existing efficient diets and served as the benchmark for the inefficient diet. However, by taking different linear combinations, more options for dietary improvement were explored, including trade-offs of dietary preferences against nutrient quality and GHGE. All modelled diets had improved adherence to FBDG and had either the least deviation from the observed diet (MaxP, for the most preferred diet), the highest nutrient quality (MaxH, for the healthiest diet) or the lowest GHGE (MaxS, for the most environmentally sustainable diet). Modelled diets were compared with observed diets for dietary preferences, nutrient quality, environmental impact and food and nutrient composition.
In order to characterise dietary preferences, we used the minimum deviation (MINDV) approach(Reference Kanellopoulos, Gerdessen and Ivancic12), which minimises the sum of positive and negative deviations (absolute values) of food group intake from the observed diet. For interpretation purposes, we used a so-called diet similarity index to serve as a simple description of the overall similarity between the observed diet and the alternative healthier diet. For each individual, this diet similarity index was calculated as the summed amount of each food group that remains the same in the modelled diet as compared with the observed diet divided by total diet weight of the observed diet. In order to characterise nutrient quality and environmental impact of the diet, we used NRD15·3(Reference Fulgoni, Keast and Drewnowski34,Reference Drewnowski35) and GHGE, respectively. NRD15·3 is the unweighted sum of percentage daily values for the fifteen nutrients to encourage (protein, MUFA, dietary fibre, Ca, Fe, K, Zn, vitamins A, D, E, C, B1, B2, B12 and folate) minus the sum of percentage maximum recommended values for the three nutrients to limit (saturated fat, added sugar and Na). The NRD15·3 was calculated 10·460 MJ (2500 kcal) for men and 8·368 MJ (2000 kcal) for women and capped at 100 % of the dietary value. Due to the slight between-country differences in the definition of Na and added sugar, the NRD15·3 was not entirely comparable between the countries. Therefore, we expressed the results relative to the observed diet in strata of country and gender and calculated averages by country. The trade-offs were done by first giving full weight to dietary preferences in the MaxP model (i.e. minimum deviation form observed diet) followed by a 10 % stepwise increase of the weight for either nutrient quality or GHGE. After each step, the alternative diet was calculated until full weight was given to either nutrient quality (MaxH) or GHGE (MaxS).
Results
Identification of efficient diets
Table 2 shows the general characteristics of subjects in the study sample and those with efficient diets. The proportion of subjects with an efficient diet ranged from 23 % (Italian women) to 45 % (Czech women). General characteristics were similar to the overall sample for age, educational level and overweight.
Table 2 General characteristics of the study sample and of the subjects with an identified healthier diet *
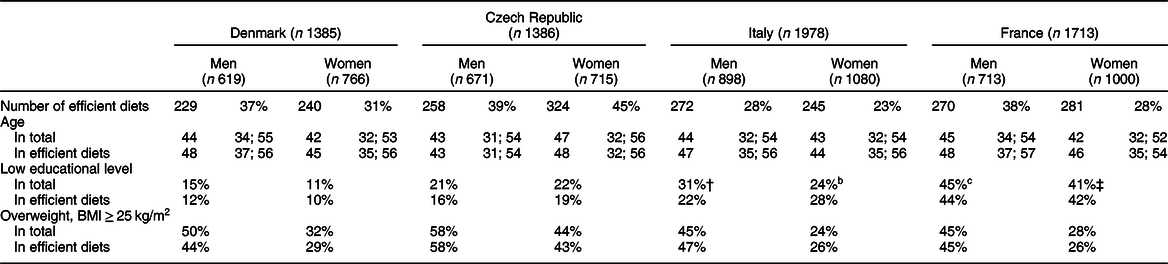
* Values are median and interquartile range and percentage.
† Data available for 851 men and 1028 women.
‡ Data available for 711 men and 999 women.
Trade-off of dietary preferences against nutrient quality and environmental sustainability
Figure 1 shows the trade-off of dietary preferences against nutrient quality (1a) and GHGE of the diet (1b) for all four countries averaged for men and women. Of course, the MaxP diet remained closest to the observed diet (diet similarity index on average 85 %) as compared with the MaxH diet and the MaxS diet (diet similarity index on average 72 and 73 %, respectively). Given the FBDG-based modelling, the MaxP diet had already a 4–9 % higher NRD15·3, whereas GHGE was only 0·5–5 % lower than the observed country-specific diets. For the MaxH diet, nutrient quality was increased at the expense of diet similarity, and the NRD15·3 increased by 11–20 % (Fig. 1a). In this diet, the GHGE was not sensitive to this trade-off except in Denmark in which this lowered to about 10 %. For the trade-off of dietary preferences against GHGE (Fig. 1b), the MaxS diet had a 13–28 % lower GHGE. The NRD15·3 appeared sensitive to this trade-off and subsequently increased by 6–12 %. The shape of the trade-off curves for nutrient quality and GHGE shows that the largest gains occurred in the first part of the curve and were attenuated thereafter. Moreover, the MaxH diet only marginally affected GHGE, and the MaxS diet only reached half the maximum for nutrient quality, therefore indicating a trade-off between these objectives.
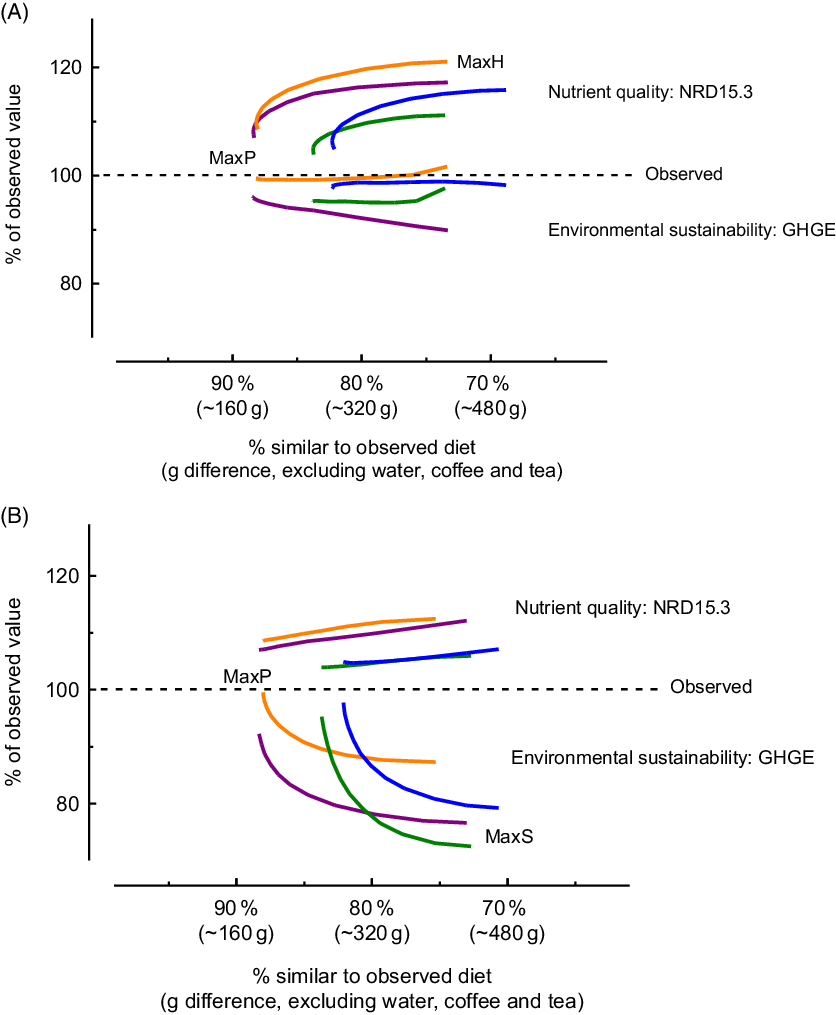
Fig. 1 Trade-offs of dietary preferencesa against nutrient qualityb (A) and environmental sustainability of the dietc (B)d.a Dietary preferences were expressed as the diet similarity index, i.e. weight of foods in the modelled diet that corresponds to the observed diet, as a percentage of the latter (horizontal axis). Total observed food weight (excluding water, coffee and tea) was around 1800 g/2500 kcal for men and around 1450 g/2000 kcal for women, respectively. bNutrient quality was calculated as NRD15·3 and expressed relative to its observed value for each population group (as %; upper part of the vertical axis). Observed NRD15·3 was 938 for Denmark, 812 for Czech Republic, 977 for Italy and 831 for France. c Environmental sustainability of the diet used GHGE as indicator and is expressed relative to its observed value (as %: lower part of the vertical axis). Observed GHGE in kgCO2eq/2000 kcal was 4·85 for Denmark, 4·42 for Czech Republic, 4·88 for Italy and 6·08 for France. d When relaxing dietary preferences, the upper part of the graphs shows the relative changes in nutrient quality (using NRD15·3) of the improved diets and the lower part of the graphs the relative changes in environmental sustainability (using GHGE). Figure 1a depicts the trade-off between dietary preferences and nutrient quality, i.e. maximising NRD15·3 while relaxing the criterion for diet similarity (x-axis). At the left full weight is given to diet similarity (MaxP) and at the right full weight is given to nutrient quality (MaxH), results for NRD15·3 are depicted at the upper part of Figure 1a and for GHGE at the lower part of Figure 1a. In a similar way, Figure 1b depicts the results on NRD15·3 and GHGE when minimising GHGE and relaxing the criterion for dietary preferences, with at the right full weight is given to GHGE (MaxS). To convert kcal to kJ multiply it by 4·184. ![]() , Denmark,
, Denmark, ![]() , Czech Republic,
, Czech Republic, ![]() , Italy,
, Italy, ![]() , France
, France
Food composition of observed and modelled diets
Figure 2 presents the total weight of the diet and the amounts consumed for each main food group for the observed and modelled diets (see also Supplementary Table 1).
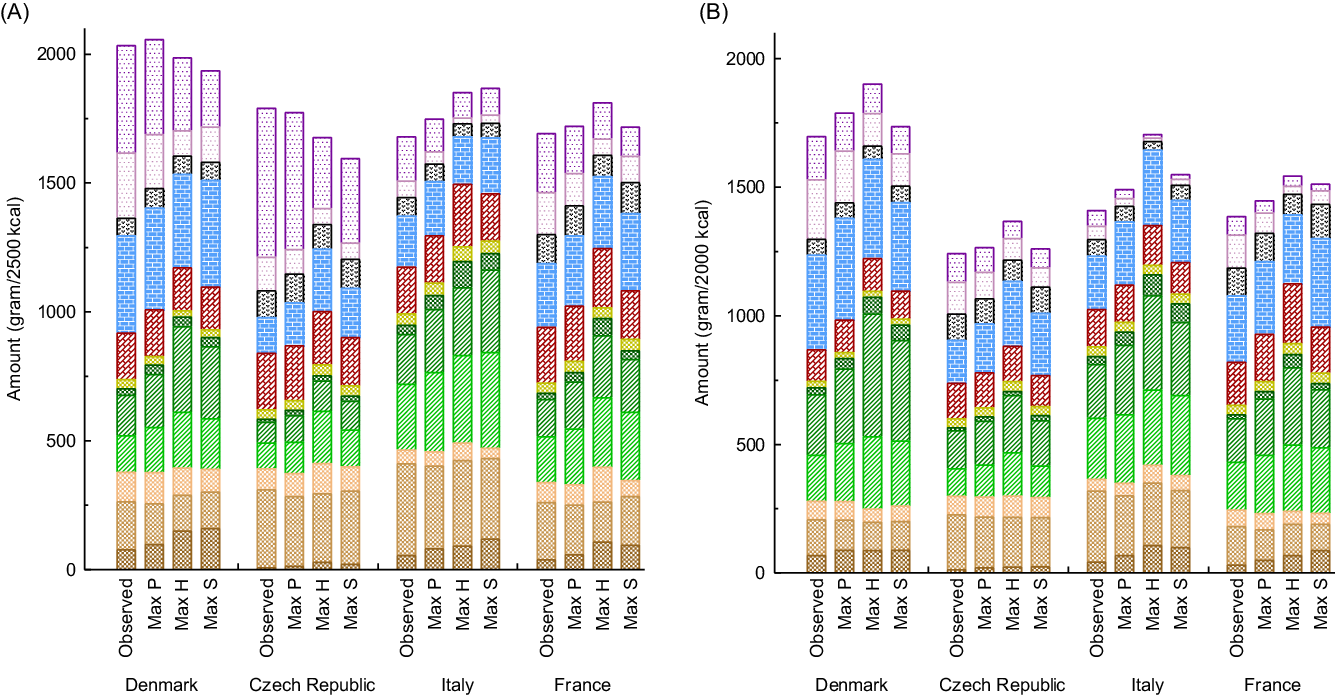
Fig. 2 Mean quantities for main food groups in the observed and modelled dietsa,b. aAll modelled diets improved on the dietary components mentioned in Table 1. MaxP is the most preferred diet based on minimal deviation from the observed diet, MaxH the healthiest diet based on NRD15·3 for nutrient quality and MaxS the most environmentally sustainable diet based on GHGE. bInformation on amount of coffee, tea and water in the diets is not included in the graph. To convert kcal to kJ multiply it by 4·184. ![]() , Alcoholic beverages;
, Alcoholic beverages; ![]() , Sweet beverages;
, Sweet beverages; ![]() , Miscellaneous;
, Miscellaneous; ![]() , Dairy, incl milk and cheese;
, Dairy, incl milk and cheese; ![]() , Meat, fish, eggs;
, Meat, fish, eggs; ![]() , Fats and oils;
, Fats and oils; ![]() , Legumes and nuts and seeds;
, Legumes and nuts and seeds; ![]() , Fruit;
, Fruit; ![]() , Vegetables;
, Vegetables; ![]() , Potatoes;
, Potatoes; ![]() , Refined grains;
, Refined grains; ![]() , Whole grains
, Whole grains
In all countries and for both genders, total weight of foods in the diet (including dairy and excluding coffee, tea, water, sweet and alcoholic beverages) was higher for the modelled diets. For the MaxP diet, this amounted to a higher diet weight of 65–130 g/10·460 MJ (2500 kcal) (6–9 % increase) for men and 60–140 g/8·368 MJ (2000 kcal) (6–11 %) for women. This was followed by the MaxS diet in which diet weight was around 122–288 g/10·460 MJ (2500 kcal) (11–20 %) higher for men and 106–248 g/8·368 MJ (2000 kcal) (11–21 %) higher for women as compared with observed. The MaxH diet had the highest amount of foods, which was around 240–310 g/10·460 MJ (2500 kcal) (18–24 %) higher for men and 211–380 g/8·368 MJ (2000 kcal) (20–29 %) higher for women as compared with the observed diet. For drinks (excluding water, coffee and tea), all models showed that sweetened and alcoholic beverages had to be substantially reduced, especially for the MaxH and MaxS diets among men (43–52 % reduction).
Despite the higher food consumption, the proportion of animal-sourced foods remained similar to the observed diets for all modelled diets. In particular, approximately 35 % of total weight (including dairy and excluding water, coffee and tea) is animal sourced. However, there were shifts within the animal- and plant-sourced food groups with, as expected, most marked shifts for the food groups that are included in the FBDG and thus used by the model for selecting efficient diets. The total amount of animal-sourced foods was higher in most modelled diets, except for MaxH in Danish men and MaxS in Danish women (Fig. 3). The amount of meat from beef and pork was, however, lower in all modelled diets. The amount of poultry remained roughly similar, but amounts of fish, eggs and total dairy were higher in most of the modelled diets. Total dairy products (including cheese) were not entered in the model and amounts decreased or increased slightly (−8 to +74 %) depending on the objectives of the model and population subgroup. Taken together, for the MaxP diet, animal-sourced foods were on average 25 g higher for men (+5 %) and 40 g higher for women (+8 %) as compared with animal-sourced foods in the observed diet. Amounts were even higher for the MaxH diet for men (up to 60 g (+16 %), except for Danish men) and for the MaxS diet for Czech and French women (up to 79 g (+21 %)).
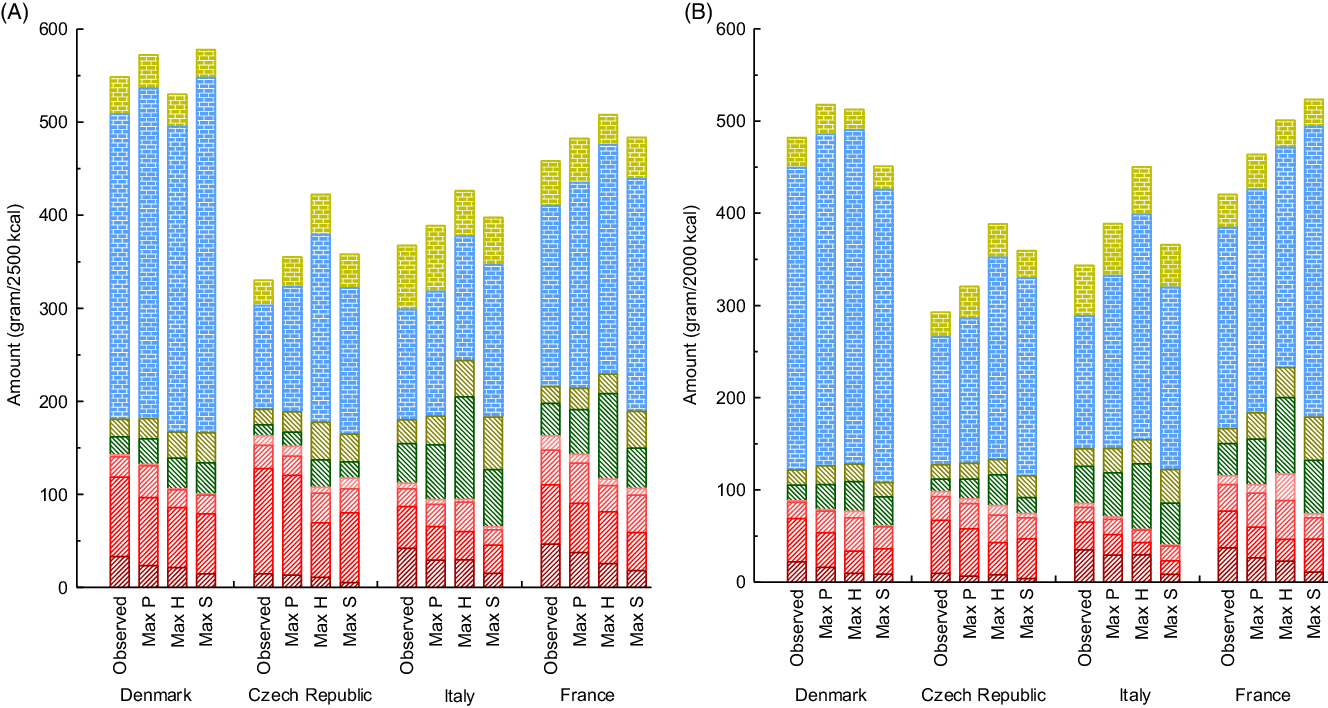
Fig. 3 Mean quantities for main animal-sourced food groups in the observed and modelled dietsa. aAll modelled diets improved on the dietary components mentioned in Table 1. MaxP is the most preferred diet based on minimal deviation from the observed diet, MaxH the most healthy diet based on NRD15·3 for nutrient quality, and MaxS the most environmentally sustainable diet based on GHGE. To convert kcal to kJ multiply it by 4·184. ![]() , Cheese;
, Cheese; ![]() , Milk etc.;
, Milk etc.; ![]() , Eggs;
, Eggs; ![]() , Fish;
, Fish; ![]() , Other meat;
, Other meat; ![]() , Poultry;
, Poultry; ![]() , Pork;
, Pork; ![]() , Beef
, Beef
The total amount of plant-sourced foods was also higher in all modelled diets (11–36 %). In particular, vegetables (+36 %), fruits (+49 %), legumes (+91 %) and whole grains (+103 %) increased, whereas refined grains decreased (−16 %) as most clearly seen in the MaxH diet and the MaxS diet. The amount of nuts and seeds was only slightly higher than observed.
Results of the modelled diets differed by country and gender and were dependent on the trade-offs between dietary preferences, nutrient quality and GHGE. For most population groups, the MaxH diet had the highest amount of fruit (+60 %, except for Italian men), vegetables (+75 %, except for Italy), legumes (+132 %) and fish (+124 %) and the lowest amount of sweetened beverages (−60 %, except for Czech women) as compared with the other diets. The amount of red and processed meat was lowest for the MaxS diet (−45 %) followed by the MaxH diet (−36 %) and was closest to the observed diets for the MaxP diet (−20 %) (see Supplementary Table 1).
Nutrient quality of observed and modelled diets
In detail for the nutrient quality, the nutrient evaluations for each nutrient included in the NRD15·3 are shown in Supplementary Table 2. In our data, the three modelled diets alleviated the nutrient inadequacies. Nevertheless, the average intakes remained below recommended intake levels for dietary fibre, K, Mg, vitamin E and vitamin D although there were differences by modelled diet, country and gender. Nutrient inadequacies showed the most improvement for a MaxH diet and the least for a MaxP diet. Next to the nutrients to encourage, the NRD15·3 included three nutrients to limit. Compared with the observed diet, intakes in the modelled diets were improved (i.e. lower) for saturated fat in all four countries and for added sugar in Denmark and Czech Republic, while intakes remained roughly the same for Na in all four countries and for added sugar in Italy and France. A note of caution is due here given that Na and added sugar were assessed differently in the countries. For example, in Italy, only the Na intake from raw foods was included, which resulted in a Na intake that was much closer to or even lower than the maximum reference value. In Italy and France, total sugar was assessed that resulted in less change as compared with added sugar that excluded sugars naturally occurring in fruit, vegetables and dairy.
Discussion
This application of the DEA model to dietary survey data from four European countries of Denmark, Czech Republic, Italy and France showed that the most preferred diet had a larger impact on nutrient quality (on average 6 % higher) than on GHGE (on average 4 % lower). Interestingly, however, the diet with the highest nutrient quality (on average 16 % higher NRD15·3) did not result in a lower GHGE. Yet, the most environmentally sustainable diet (on average 21 % less GHGE) had a higher nutrient quality (on average 9 % higher NRD15·3) as compared with the observed diet. Although the results differed by country and gender, the modelled diets had higher amounts of both plant- and animal-sourced foods but with the relative amounts of foods remaining similar. Diets of the highest nutrient quality exhibited the highest amounts of plant-sourced foods, while diets of the lowest GHGE contained the lowest amounts of red and processed meat.
The modelled diets accounted for the prevailing dietary preferences of the study populations. This was because the DEA model preserves existing interrelationships among food groups as this model uses a linear combination of observed diets as benchmarks. These observed diets implicitly accounted for sensory preferences and culinary practices as well as the availability, acceptability and affordability of the diet. We stratified our analyses by country and gender under the assumption that subjects in these strata share many unspecified variables, including educational level, overweight status and determinants of food choice. Indeed, the descriptive variables of the efficient diets were comparable with their representative population segments (Table 2). In our data, nutrient quality but not environmental impact of the diet was associated with gender and educational level(Reference Mertens, Kuijsten and Dofkova17,Reference Mertens, Kuijsten and van Zanten27) . Future analyses should consider, however, also accounting for socio-economic status or include indicators such as sensory profiles(Reference van Langeveld, Teo and de Vries36,Reference van Bussel, Kuijsten and Mars37) or food prices(Reference Wilson, Nghiem and Mhurchu38). Such analyses in a more homogeneous population subgroup could identify solutions for dietary improvement that fit even better with subgroup-specific dietary practices and preferences. In this way, the DEA model keeps the proposed diets realistic as they stay within the range of observed national diets.
In order to derive the most preferred diet, the DEA model minimised the absolute value of deviation between the modelled and observed food intake summed over all food groups. Although this algorithm can be further improved by, for example, using relative or squared difference instead and/or modelling food replacements within meals and recipes instead of day menus, it is important to realise that such an algorithm of minimal deviation is needed for modelling more feasible and realistic dietary improvement options. Importantly, our results suggested that a partial shift to poultry, fish and increased intake of legumes would be preferable to a sole focus on fully reducing red and processed meat. This partial shift is in line with the food choices of a growing number of consumers identifying themselves as meat reducers or flexitarians(Reference de Bakker and Dagevos39), which confirms the feasibility of adopting our proposed diets. Potential strategies that consumers adopt for eating less meat include meatless days with or without meat substitutes, the promotion of smaller portions of meat and if possible in combination with more sustainable produced meat and/or larger portion of fruit and vegetables(Reference de Bakker and Dagevos39–Reference Verain, Dagevos and Antonides41). In this way, the DEA model provides a necessary first step to arrive at more feasible and realistic changes and thus could be used to guide national policies towards improved health and environmental impact.
Data comparability between the countries was a challenge because food consumption data were obtained from different national dietary surveys. In order to enhance comparability, we expressed nutrients and GHGE relative to energy intake(Reference Mertens, Kuijsten and Dofkova17,Reference Mertens, Kuijsten and van Zanten27) and used the NRD15·3 as a summary measure for nutrient quality. When the NRD15·3 was used to maximise nutrient quality, protein-rich foods, such as fish, eggs, dairy, legumes and nuts and seeds, were likely to be chosen as a meat replacement. This was because of the inclusion of protein, vitamins B1, B2 and B12, Fe and Zn as nutrients to encourage in the NRD15·3. However, as Na and added sugar are part of nutrients to limit in the NRD15·3, cross-country comparisons were hampered as they were assessed differently in the countries. We therefore expressed our results relative to the observed diet in each of the strata. For example, in Italy and France, total sugar was assessed which biased the NRD15·3 downward as compared with Denmark or Czech Republic in which only added sugar was assessed. This may partially explain why in Italy intakes of fruit, vegetables and whole grains were not the highest for the diet that maximised NRD15·3. In Italy, only Na intake from raw foods was assessed, which biased the NRD15·3 upward as compared with Denmark, Czech Republic and France in which discretionary salt was assessed as well. Furthermore, environmental impact only included GHGE data averaged for the European context, and further refinement to national food systems would be needed to incorporate differences between agricultural systems, including the influence of locally produced food and seasonality(Reference Notarnicola, Sala and Anton42). Our use of average footprints for the four countries rather than country-specific estimates may have partially masked the potential role of food production systems relative to dietary patterns; however, incorporating different food systems would also require incorporation of food trade and prices, which is beyond the scope of this diet model. Moreover, pan-European standardised indicators of land and freshwater use, nitrogen and phosphorus flows and biodiversity could give a more balanced picture of environmental impact of the diet. Given these imperfections in comparability of survey data and incompleteness of indicators, the observed and modelled diets differed by country. And, yet, the general pattern was similar in both men and women, thus emphasising the robustness of these findings.
The food consumption data were derived from national dietary surveys, and we used the average of two non-consecutive days for each individual which slightly reduces day-to-day variability(Reference Willett43). The use of two averaged days for the benchmark diets exploited within- and between-subject variation within the demographic strata and created a larger window of opportunity for improving diets than time-integrated long-term dietary habits. Since modelled diets are combinations of observed diets, the modelled range of food and nutrient intake and GHGE was slightly lower than that of the observed diets. Nevertheless, the range of solutions remained in the same order of magnitude (data not shown), which suggests that the results from the three models were realistic steps for dietary shifts at the population level. At the same time, the use of only 2 d raised questions on foods consumed only occasionally, such as fish, nuts and seeds and legumes. Fish was of particular concern given its recommended consumption frequency is around one to two portions a week in order to avoid toxicological risks because of contaminants like (methyl)mercury(44). Using this occasionally consumed, high portion size of fish as a benchmark for an average diet would shift the whole population to these high intakes, which are ultimately unrepresentative of a typical day. This was tackled by first capping fish intake at 1/7th of one portion to avoid favouring higher intakes than recommended and second by replacing upper intake levels by a lowest non-zero intake divided by two in order to disadvantage extreme upper intakes all while benchmarking diets. Given their small portion sizes and infrequent consumption, legumes and nuts and seeds did not increase substantially in our diets. In other studies, food-based linear programming approaches have shown that these food groups can contribute to healthy and environmentally sustainable diet(Reference Ferrari, Benvenuti and Rossi7,Reference Maillot, Vieux and Amiot45–Reference Green, Milner and Dangour47) as was also suggested by the healthy reference diet presented by the EAT-Lancet Commission(Reference Willett, Rockström and Loken48). Targeted efforts and product development would therefore be warranted in order to increase consumption of some foods beyond current national eating habits.
Results of our analyses depend on the choice of variables included in the model. In our modelling strategy, we aimed for diets that would increase adherence to FBDG that are considered relevant to non-communicable disease risk (factor) reduction (see Table 1). After all, a healthy diet not only implies meeting FBDG but also includes nutrient requirements, non-nutrients, bio-actives and direct physiological effects on hunger, digestion and satiation. In light of the underlying nutritional rationale, we replaced the guideline ‘use oils instead of hard fats’ by unsaturated and saturated fats as ‘to increase’ and ‘to decrease’, respectively. In all population groups, the modelled diets performed the same or better for all nutrients, except in women from the Czech Republic. In these women, a substantial decrease in animal-sourced foods occurred which subsequently lowered intakes of Ca, Zn, vitamin B2 and vitamin B12 (results not shown). In order to safeguard the intakes of these nutrients, these nutrients were then added to the DEA model. Nevertheless, it must be realised that the modelled diets are based on calculated nutrient intake from dietary surveys that do not account for bioavailability. We observed that the proportion of animal-sourced foods and the daily protein intake in modelled diets was essentially similar to observed diets. However, bioavailability of protein and some minerals from plant-sourced foods is less than from animal-sourced foods; thus, warranting physiological research into nutrients that can become critical for vulnerable population groups. For example, some plant compounds can inhibit the absorption of minerals, such as Ca, Zn and non-haem Fe(49,Reference Gibson, Bailey and Gibbs50) , whereas vitamin C may increase the bioavailability of Fe from plant foods(49).
In line with previous studies(Reference Green, Milner and Dangour47,Reference Macdiarmid, Kyle and Horgan51–Reference Kramer, Tyszler and Veer55) , the transition to a healthier diet implies increasing the amounts of fruits, vegetables and whole grains, whereas an environmentally more sustainable diet requires to prioritise lowering red and processed meat and only mildly increasing legumes, nuts and seeds. Although results differed slightly by country and gender, dairy products essentially remained in the diet. However, caution must be applied when decreasing beef intake while keeping dairy intake similar. As when such diets are implemented on a wider scale, the amount of beef meat proposed should be in correspondence with the meat production volumes produced as a co-product from milk production. Food system model that account for food chain interdependency suggests that in animal husbandry of dairy cows, 1 g of beef can be produced for every 46 g of milk that is produced(Reference Bryngelsson, Wirsenius and Hedenus56–59).
Nevertheless, the proportion of animal- and plant-sourced food in the modelled diets remained similar, but nutrient quality (NRD15·3) increased. Surprisingly, the total amount of foods (including dairy) increased by 5–30 % for the modelled diets, mostly for the healthiest diet, and thus the overall energy density for these food groups decreased accordingly. At the same time, we observed that the modelled healthier and more environmentally sustainable diets had lower amounts of sweetened and alcoholic beverages, especially in men. These results show that at the national level, important first steps can be made in nutritional policy, but the priorities will affect nutrient quality and environmental sustainability differently. However, on average, the proposed diets do not achieve the proposed global targets for healthy and environmentally sustainable diets and additional policy measures are thus warranted.
In conclusion, the DEA benchmarking diet model shows that generally accepted FBDG and nutrient requirements can be used to model healthier and more environmentally sustainable diets based on dietary surveys from a set of diverse European diets. While improving the adherence to FBDG, the diet with the largest improvement in GHGE resulted in a win–win for both health and the environment, but did not achieve the full health potential. Focusing on nutrient quality alone, however, did not improve GHGE. As such, larger dietary changes and complementary measures are required in agricultural production and processing(Reference Van Zanten, Van Ittersum and De Boer60), food loss and waste management, as well as an equitable distribution via the food supply chain(Reference Rutten, Achterbosch and de Boer61).
Acknowledgements
Acknowledgements: Not applicable. Financial support: This work was supported by the European Union’s H2020 Programme under grant Agreement number 633692 (SUSFANS: Metrics, models and foresight for European sustainable food and nutrition security) and TiFN under Project Agreement number 15SD01 (SHARP-BASIC). A.K., J.M.G. and P.v.V. received research funding from TiFN (grant 15SD01_SHARP). Conflicts of interest: For the sake of clarity, it should be mentioned that E.T. has been involved in small-grant research projects based on funding from the industry (Danish Dairy Research Foundation and Danish Agriculture and Food Council). Availability of data and materials: The SHARP Indicators Database (SHARP-ID) used to calculate the diet-related environmental impact is available in a data repository; doi: https://doi.org/10·17026/dans-xvh-x9wz. Restrictions apply to the availability of the data that support the findings of this study, which were used under license for this study, and so are not publicly available. Authorship: P.v.V. and J.M.G. designed the research; M.D., L.M., L.D.A., A.T., C.D., S.H. and E.T. were responsible for dietary data collection; E.M. analysed data and received input for the diet modelling from A.K.; E.M., P.v.V., J.M.G., A.K. and S.B. were responsible for data interpretation; E.M. wrote the manuscript, which was reviewed by all authors for intellectual content. All authors read and approved the final version of the manuscript. Ethics of human subject participation: The national dietary survey of Denmark (DANSDA 2005–2008), Czech Republic (SISP04) and Italy (INRAN-SCAI 2005–2006) did at that time not need to notified and endorsed by the Ethical Committee. The national dietary survey of France (INCA-2 study 2006–2007) was approved by the French Data Protection Authority (Commission Nationale Informatique et Libertés).
Supplementary material
To view supplementary material for this article, please visit https://doi.org/10.1017/S1368980020003341


 Open access