


Globally, severe acute malnutrition (SAM), a category of wasting, affects nearly 20 million children( 1 ) and most of them reside in South Asia and sub-Saharan Africa( 2 – Reference Picot, Hartwell and Harris 4 ). In a study that performed a pooled analysis of ten prospective studies, SAM, as measured by weight-for-height Z-score (WHZ) <−3, was found to increase the risk of death by 11·6 times compared with well-nourished children under 5 years of age( Reference Olofin, McDonald and Ezzati 5 ). In 2011, SAM caused approximately 7·5 % of all deaths among children under 5 years old globallyReference Black, Victora and Walker (6 , Reference Fiorentino, Sophonneary and Laillou 7 ).
While the mortality risk for these children is high, it can be mitigated through timely identification and administration of effective treatment( 8 ). Eighty per cent of children with SAM do not have medical complications and thus can be treated in the community( Reference Picot, Hartwell and Harris 4 ). A recovery rate of >90 % has been demonstrated for SAM children with community-based care of these uncomplicated cases using ready-to-use therapeutic food or home-based therapeutic products( Reference Picot, Hartwell and Harris 4 , Reference Bhutta, Das and Rizvi 9 ). This community-based management of severe acute malnutrition (CMAM) is especially important in resource-limited regions as they not only have the highest burden of undernutrition, but also poor and limited health-care infrastructure( Reference Bhutta, Das and Rizvi 9 ).
The first step for effective implementation of CMAM is identification of SAM and that requires a valid community-based screening tool. The WHO and UNICEF recommend using bilateral pitting oedema and two independent anthropometric criteria to diagnose non-oedematous SAM in children aged 6–60 months: mid-upper arm circumference (MUAC)<11·5 cm and WHZ<−3. Although WHZ is considered a gold standard for assessment of nutritional status, frequent lack of valid and reliable scales, and inadequate training of the health workers at community level in developing countries to accurately use the scales, along with the low cost, simplicity of use, low required training level, and less resource and equipment need for MUAC, compared with WHZ( 2 , Reference Roy 10 ), has prompted the widespread use of MUAC over WHZ for early identification and referral/treatment of children with SAM( 1 , Reference Myatt, Khara and Collins 11 ). Studies have shown MUAC to have a higher predictive value for mortality compared with WHZ among both children and adolescents( Reference Myatt, Khara and Collins 11 – Reference Vella, Tomkins and Ndiku 20 ).
The 2016 Demographic and Health Survey in Nepal found that 2 % of children under the age of 5 years are severely wasted based on WHZ( 21 ). The prevalence of wasting and severe wasting has been stagnant over the last decade in Nepal. Wasting levels have varied from 13 % to 11 % to 10 % from 2006 to 2010 to 2016; and severe wasting levels have varied from 3 % to 3 % to 2 % from 2006 to 2010 to 2016( 21 – 23 ). In response to these continued high rates, the Government is piloting CMAM interventions in a few districts. These programmes use the recommended MUAC cut-off of <11·5 cm to define SAM( 24 ).
However, the two broad ethnic groups in Nepal, Pahadis and Madhesis, are significantly different from each other in terms of their health outcomes( 8 , Reference Stewart, Katz and Khatry 25 , Reference Tielsch, Khatry and Stoltzfus 26 ). A number of demographic, behavioural and socio-economic factors have been shown to be associated with undernutrition and mortality( Reference Roy 10 , Reference Vella, Tomkins and Ndiku 20 , Reference Chen, Chowdhury and Huffman 27 – Reference Pelletier 30 ). Most studies assessing the mortality–MUAC association through standard MUAC thresholds have not considered the effect of socio-economic variables and demographic characteristics( Reference Alam, Wojtyniak and Rahaman 14 , Reference Briend, Dykewicz and Graven 31 – Reference Sommer and Loewenstein 33 ), and many of these studies are based on restrictive populations and sample sizes( Reference Chen, Chowdhury and Huffman 27 , Reference Groenewold and Tilahun 29 , Reference Briend, Dykewicz and Graven 31 , Reference Sommer and Loewenstein 33 , Reference Briend, Wojtyniak and Rowland 34 ). No study has been conducted to examine if ethnicity can modify the relationship between mortality and SAM as defined by MUAC. The purpose of the present paper is to examine if the association between mortality and MUAC<11·5 cm differs by ethnicity, and if basic sociodemographic factors can explain this association in children less than 3 years of age, for two major ethnicities in Nepal, Pahadis and Madhesis. In accordance with the current age recommendations for the use of MUAC, we also examine if these associations differ among children aged <6 months and those aged ≥6 months.
Methods
The current study is a secondary analysis of data from a cluster randomized 2×2 factorial trial, the Nepal Nutrition Intervention Project, Sarlahi-4 (NNIPS-4). NNIPS-4 was conducted between 21 October 2001 and 2 February 2006 in the low-lying plains of rural southern Nepal along the border with Bihar, India. The area is representative of the broader Gangetic floodplains of South Asia( Reference West, Katz and LeClerq 35 ). The study population consisted of children below 3 years of age residing in thirty Village Development Committees. The original trial was designed to investigate the effect of daily supplementation with iron–folic acid and zinc on mortality in children aged 1 month to <3 years. Our analysis used data from enrolled children who were visited at their homes twice weekly by study personnel trained in collecting anthropometric measurements, until children were 3 years of age.
Children were enrolled between ages of 0 to 1094 d (3 years) and their MUAC was measured at the time of enrolment. Standardized protocols were used to measure MUAC around the upper left arm of each child. Three measurements were taken on each child and the middle of the three numbers was recorded as baseline MUAC in centimetres. For analysis, MUAC was categorized into <11·5 cm and ≥11·5 cm. Data collectors were trained to conduct MUAC measurements and certified to collect data only after inter- and intra-observer agreement was good to excellent. The left mid-upper arm was measured using a Zerfas insertion tape read to the nearest 0·1 cm. Supervisors conducted regular checks of technique throughout the study and retraining was conducted periodically to reduce drift over time.
Age and sex of the child were recorded at enrolment. For children enrolled at the start of the study, field workers ascertained age by asking about date of birth and used event calendars if the respondent was uncertain. The maximum recall was 3 years which is less than the Demographic and Health Surveys recall period. For children born while the study was ongoing, the date of birth was prospectively collected by field workers, so their ages are likely to be accurate as field workers were visiting the household twice weekly.
For the current analysis age was categorized as <6 months and ≥6 months. There are two main ethnic groups in this population, Pahadi and Madhesi. The child’s ethnicity was recorded at baseline. The Pahadi (hill origin) people are from both Tibeto-Burman tribal and Aryan, mainly Hindu caste decent. Most migrated from the hills of Nepal to the low-lying plains in southern Nepal 40–50 years ago. Traditionally the majority conform to the Hindu caste hierarchy with a significant number of Buddhists as well. The Madhesi people have their cultural roots in the north Indian-Gangetic floodplain. They live along the border between Nepal and the state of Bihar in India( Reference Rosenstock, Katz and Mullany 36 ). There are distinct differences between the two ethnic groups in terms of the distribution of resources as well as cultural, linguistic and religious practices( Reference Hachhethu 37 ). Maternal literacy was classified as the ability to read or write a short letter.
A composite socio-economic status (SES) variable was constructed based on the presence of up to twelve items in the household, from among a latrine, servant, cattle, bicycle, radio, farmable land, home garden plot, second floor in the house, roof material, television, electricity at home and bullock cart. Scores were calculated as a percentage, with the denominator being the number of non-missing observations from each of the twelve items for each individual. The SES score was labelled as missing if information on more than six of these twelve items was missing. The SES score so generated was divided into three categories: low (0–10 %); medium (10–40 %) and high (40–100 %).
After enrolment, children were visited twice per week to assess their vital status until they were 3 years of age, at which time they were discharged from the study. If a child had died, the date of death was recorded on a verbal autopsy form.
Verbal informed consent was obtained at the community level during meetings with community leaders and at the individual level from parents of each eligible child at the time of enrolment.
The study was conducted according to the guidelines laid down in the Declaration of Helsinki and all procedures involving human subjects were approved by the Nepal Health Research Council, the Committee on Human Research of the Johns Hopkins Bloomberg School of Public Health, Baltimore, MD, USA and the Institutional Review Board of Cornell University, Ithaca, NY, USA. Verbal informed consent was obtained from all subjects. Verbal consent was witnessed and formally recorded.
Statistical analysis
Baseline characteristics were compared between groups stratified by outcome status (dead or alive) at the end of the study/follow-up. Kaplan–Meier survival analysis was conducted to obtain cumulative survival in groups defined by age (<6 months and ≥6 months), MUAC (<11·5 cm and ≥11·5 cm) and ethnicity (Pahadi and Madhesi). A log-rank test statistic was used to determine significant differences in survival curves. The proportional hazards assumption was checked using the plot of complementary log–log transformation of the survival function against the log of follow-up time. Because our data met this assumption, a Cox proportional hazards regression model was used to report unadjusted and adjusted hazard ratios (HR) and to estimate the interactions between categorical age, MUAC and ethnicity. The analysis was adjusted for sex, SES and mother’s literacy. All analyses were conducted using the statistical software package Stata version 13.
Results
Descriptive analysis
Between 21 October 2001 and 2 February 2006, a total of 48 492 children were enrolled, of whom 51·4 % were male, 31·5 % were of Pahadi origin and 75·9 % had illiterate mothers. Their age at MUAC measurement ranged from 0 to 36 months and the mean age was 8·3 months. Of the children, 62·6 % were <6 months of age and 37·4 % were ≥6 months of age at baseline. A large proportion of children were <6 months old at baseline because after the initial enrolment that included all children <3 years of age, infants born in the enrolled households were added to the study once they turned 1 month old. Mean age at censorship/outcome was 28·3 months, ranging from 0·93 to 36 months. MUAC ranged from 6·0 to 19·7 cm and mean MUAC was 11·3cm. Of the children, 25 326 had MUAC<11·5 cm at baseline and 23 166 had MUAC≥11·5 cm.
The mean follow-up time was 20 months, ranging from 0·03 to 36 months. Of the children initially enrolled, 7554 (15 %) were lost to follow-up, moved out from the area or withdrew consent; 40 938 children completed follow-up to death or 3 years of age or until 3 February 2006 when they were administratively censored. The distribution of characteristics was similar between those who were lost to follow-up v. those who completed follow-up (see online supplementary material, Supplemental Table 1) and hence loss to follow-up was assumed to be random. There were 855 deaths during the follow-up period.
Table 1 Distribution of baseline characteristics and unadjusted hazard ratios (HR) in groups stratified by outcome (dead or alive) among Nepalese children below 3 years of age, Nepal Nutrition Intervention Project, Sarlahi-4 (21 October 2001–2 February 2006)
MUAC, mid-upper arm circumference; SES, socio-economic status; Ref., reference category.
* Significance level P<0·05.
† Ethnicity is missing for 258 children.
‡ Mother’s literacy is missing for 214 children.
§ SES category is missing for 212 children.
Table 1 shows the distribution of baseline characteristics in groups stratified by outcome status (dead or alive). All the characteristics were significantly different in the groups and hence associated with mortality. The unadjusted HR for death by each covariate are included in Table 1. MUAC<11·5 cm, age <6 months at baseline, female sex, Madhesi ethnicity, low SES and illiteracy of the mother were associated with higher hazard of death compared with MUAC≥11·5 cm, age ≥6 months at baseline, male sex, Pahadi ethnicity, middle/high SES and literacy of the mother, respectively.
Age-specific cumulative survival
Children who had MUAC<11·5 cm had a total of 570 110 person-months of follow-up and 651 deaths. Children who had MUAC≥11·5 cm had a total of 399 864 person-months of follow-up and 204 deaths. Given the current guideline of MUAC<11·5 cm for screening children aged 6 months or above, we examined if the survival over the follow-up period among those with MUAC of <11·5 cm v. ≥11·5 cm differed between the two age groups. Among children <6 months of age, the adjusted HR for MUAC<11·5 cm was 1·57 (95 % CI 1·26, 1·97), compared with an adjusted HR of 5·45 (95 % CI 3·86, 7·68) among older children. Adjustment only moderately attenuated the crude HR (see online supplementary material, Supplemental Tables 2 and 3).
Table 2 Unadjusted and adjusted hazard ratios (HR) for mortality by mid-upper arm circumference and sociodemographic characteristics, stratified by ethnicity (Pahadis and Madhesis), among Nepalese children <6 months of age, Nepal Nutrition Intervention Project, Sarlahi-4 (21 October 2001–2 February 2006)
SES, socio-economic status; Ref., reference category.
* Significance level P<0·05.
Table 3 Unadjusted and adjusted hazard ratios (HR) for mortality by mid-upper arm circumference and sociodemographic characteristics, stratified by ethnicity (Pahadis and Madhesis), among Nepalese children ≥6 months of age, Nepal Nutrition Intervention Project, Sarlahi-4 (21 October 2001–2 February 2006)
SES, socio-economic status; Ref., reference category.
* Significance level P<0·05.
Influence of ethnicity by age category
Among children who were <6 months old at MUAC measurement, MUAC<11·5cm was not associated with mortality in Pahadis, with (HR=1·12; 95 % CI 0·72, 1·73) or without adjusting (HR=1·17; 95 % CI 0·75, 1·18) for sex, SES and maternal literacy (Table 2). However, Madhesi children with MUAC<11·5cm were 1·76 times more likely to die compared with those having MUAC≥11·5 cm even after adjusting for sex, SES and maternal literacy (HR=1·76; 95 % CI 1·35, 2·28; Table 2). The log-rank test statistic comparing survival curves in the four groups defined by MUAC and ethnic categories among children aged <6 months was statistically significant (P<0·001; Fig. 1).
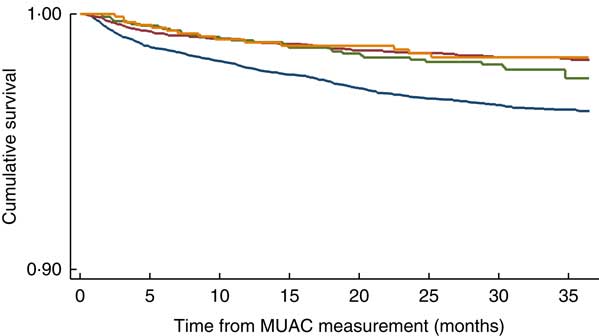
Fig. 1 (colour online) Kaplan–Meier survival curve by mid-upper arm circumference (MUAC) and ethnicity categories (![]() , Madhesi with MUAC<11·5cm;
, Madhesi with MUAC<11·5cm; ![]() , Pahadi with MUAC<11·5 cm;
, Pahadi with MUAC<11·5 cm; ![]() , Madhesi with MUAC≥11·5cm;
, Madhesi with MUAC≥11·5cm; ![]() , Pahadi with MUAC<11·5 cm) in Nepalese children aged <6 months, Nepal Nutrition Intervention Project, Sarlahi-4 (21 October 2001–2 February 2006)
, Pahadi with MUAC<11·5 cm) in Nepalese children aged <6 months, Nepal Nutrition Intervention Project, Sarlahi-4 (21 October 2001–2 February 2006)
We further adjusted for treatment allocation in the trial. After this adjustment, among children who were <6 months old at MUAC measurement, MUAC<11·5 cm was not associated with mortality in Pahadis (HR=1·34; 95 % CI 0·85, 2·09). However, Madhesi children with MUAC<11·5 cm were 1·85 times more likely to die compared with those having MUAC≥11·5cm even after adjusting for sex, SES and maternal literacy (HR=1·86; 95 % CI 1·43, 2·41).
When a similar analysis was performed among children in the older age group, after adjusting for the aforementioned factors, we found that both Pahadis (HR=4·01; 95 % CI 1·42, 11·76) and Madhesis (HR=5·60; 95 % CI 3·87, 8·11) with MUAC<11·5 cm were significantly more likely to die over the follow-up period compared with those having MUAC≥11·5 cm (Table 3). The log-rank test statistic comparing survival curves in the four groups defined by MUAC and ethnic categories among children aged ≥6 months was statistically significant (P<0·001; Fig. 2). After adjusting for treatment allocation in the trial, we found that both Pahadis (HR=4·45; 95 % CI 1·54, 12·87) and Madhesis (HR=5·84; 95 % CI 4·03, 8·46) with MUAC<11·5 cm were significantly more likely to die over the follow-up period compared with those having MUAC≥11·5 cm.
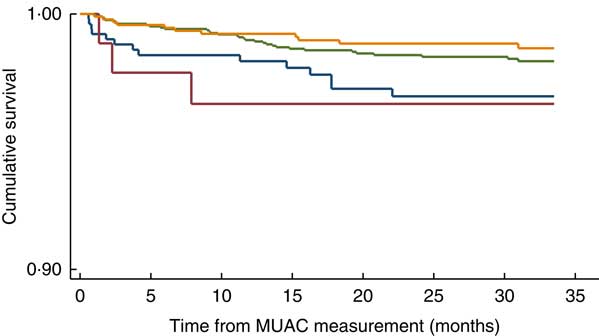
Fig. 2 (colour online) Kaplan–Meier survival curve by mid-upper arm circumference (MUAC) and ethnicity categories (![]() , Madhesi with MUAC<11·5 cm;
, Madhesi with MUAC<11·5 cm; ![]() , Pahadi with MUAC<11·5 cm;
, Pahadi with MUAC<11·5 cm; ![]() , Madhesi with MUAC≥11·5 cm;
, Madhesi with MUAC≥11·5 cm; ![]() , Pahadi with MUAC<11·5 cm) in Nepalese children aged ≥6 months, Nepal Nutrition Intervention Project, Sarlahi-4 (21 October 2001–2 February 2006)
, Pahadi with MUAC<11·5 cm) in Nepalese children aged ≥6 months, Nepal Nutrition Intervention Project, Sarlahi-4 (21 October 2001–2 February 2006)
Sensitivity analysis
Mwangome et al. suggested the use of 11·0 cm as MUAC threshold for children <6 months of age for detection of SAM( Reference Mwangome, Ngari and Fegan 12 ). In accordance with this recommendation, we repeated our analysis with MUAC of <11·0 cm v. ≥11·0 cm among children aged <6 months, and we found similar results with 11·0 cm as the threshold.
Among children who were <6 months old at MUAC measurement, MUAC<11·0 cm was not associated with mortality in Pahadis, with (HR=1·27; 95 % CI 0·84, 1·91) or without adjusting (HR=1·31; 95 % CI 0·87, 1·97) for sex, SES and maternal literacy. However, Madhesi children <6 months old with MUAC<11·0 cm were 1·74 times more likely to die compared with those having MUAC≥11·0 cm even after adjusting for sex, SES and maternal literacy (HR=1·74; 95 % CI 1·39, 2·18).
Discussion
Our results support the use of the current <11·5 cm MUAC threshold for detection of children ≥6 months of age at high risk of mortality in both ethnicities. Therefore, programmatically, MUAC<11·5 cm might be appropriate to classify children as SAM. However, our results also indicate that a single MUAC threshold value in younger children might be differentially predictive of mortality in different ethnic groups residing in the same geographic area.
While most studies have found no influence of age on the MUAC cut-off to determine the risk of mortality( Reference Bairagi 15 , Reference Chen, Chowdhury and Huffman 27 , Reference Briend, Dykewicz and Graven 31 , Reference Briend and Zimicki 38 – Reference Briend, Wojtyniak and Rowland 40 ), some studies assessing MUAC against WHZ have shown age to influence the mortality prediction by MUAC measurements( Reference Fiorentino, Sophonneary and Laillou 7 , Reference Mwangome, Ngari and Fegan 12 ). Based on these previous studies we hypothesized that ethnicity influences the MUAC–mortality association from a biological perspective. Differences between the two ethnicities could be genetic and environmental. Pahadis tend to be taller than Madeshis both as children and adults, which in turn could be due to genetics and/or dietary and socio-economic differences( Reference Patel, Murray‐Kolb and LeClerq 41 ). Madeshi children have lower birth weight than Pahadis and this could partly be a consequence of the differences in maternal height and BMI( Reference Stewart, Katz and Khatry 25 ). We speculate that there could be an intergenerational difference that plays out in a different MUAC–mortality association in the two ethnic groups.
The currently recommended screening criterion for detection of malnutrition among children aged <6 months is either weight-for-length Z-score (WLZ) or the presence of bilateral pitting oedema( 42 ). So, there is no gold standard for detection of malnutrition in children aged <6 months. While WHO recommends the same thresholds for WLZ to classify SAM as for WHZ, there is currently no accepted MUAC criterion for detection of acute malnutrition in this age group. More evidence is needed for a MUAC cut-off for <6-month-old children for detection of SAM and this is recognized as an urgent priority( Reference Kerac, Mwangome and McGrath 43 ). The management of acute malnutrition in children aged <6 months presents certain challenges due to physiological differences between them and older children. Detection of signs of infection and hydration is more difficult in younger infants( 42 ). Since feeding support is a critical part of treatment, managing children who cannot be breast-fed is a major challenge. The need to target the ‘mother–infant dyad’ is more important in this age group( Reference Kerac, Mwangome and McGrath 43 ).
One reason for a weaker association between a lower value of MUAC and mortality in Pahadis may be a lower overall baseline mortality risk in Pahadis compared with Madhesis( Reference Tielsch, Khatry and Stoltzfus 26 ). It is possible that Pahadi children whose MUAC is <11·5 cm might be at a higher mortality risk due to sociodemographic factors that are differently distributed across ethnicities.
While these findings might indicate the need to adopt different cut-offs for MUAC to improve the identification of children at the highest risk of mortality, it is important to weigh the merits of implementing these findings. Large-scale community-based studies will be required in different populations to decide the most appropriate cut-off in that population. In addition, this will impair comparisons across countries. Also, adjustment of MUAC for age, height or other parameters as has been suggested by a few earlier studies may not be feasible for community screening. It would require extensive training of community health workers to be able to interpret the results differently, which may increase the chances of error and misclassification. It will also mean different colour coding of MUAC tapes. This will make it a complex tool, hence overriding the main stated advantage of MUAC which is its ‘simplicity’. Further, from a health outcomes perspective, it is important that the <11·5 cm cut-off was associated with mortality in both ethnicities among older children with and without adjustment. Hence, even without any other knowledge about the child, a MUAC<11·5 cm was associated with higher risk of mortality in all older children included in the study. The 11·5 cm MUAC cut-off might benefit younger children with SAM, but only in a subgroup of the population.
There were certain limitations of our study. The outcome recorded was all-cause mortality and hence even the deaths not related to poor nutritional status contributed to the number of deaths for the current analysis. While these additional deaths may not be related to undernutrition and hence to MUAC<11·5 cm, they are not likely to impact the relative HR because we would expect them to be randomly distributed between the two ethnicities. The range of follow-up of children is another limitation of the study. Research has indicated that the accuracy of screening for mortality risk is influenced by the closeness of follow-up time, and that a MUAC measurement is a more accurate predictor when mortality is assessed over a short time after MUAC measurement( Reference Briend and Zimicki 38 , Reference Briend, Wojtyniak and Rowland 40 ). However, Pelletier et al. found anthropometric indicators including arm-circumference-for-age to be associated with mortality for the first year and second year of follow-up( Reference Pelletier, Low and Johnson 18 ). Another limitation is that these data are now more than 10 years old. While the mortality risk has changed since then and hence might modify the results, it should be noted that these results are in the context of a national vitamin A supplementation programme with very high coverage since the study team provided supplements for any child who did not receive vitamin A through the national programme. Vitamin A supplementation has been shown to produce equity in mortality risk( Reference Bishai, Kumar and Waters 44 ). Since we did not have repeated measurements of MUAC, we were not able to track the impact of changing MUAC over age and the associated mortality and some deaths may have occurred a long time after the MUAC measurement (up to 3 years). This would tend to weaken the association with mortality overall. However, the relationship between MUAC and subsequent survival was strong in this population despite this limitation. Long duration of follow-up and lack of frequent measurements of MUAC limit our ability to assess the immediate impact of MUAC measurements. In addition, there might be a possibility of residual confounding. There may be unmeasured confounders between the two ethnic groups. In our study, we could not account for factors such as existing co-morbidities, food security and hand hygiene practices. Also, since the current analysis was part of an existing randomized controlled trial that did not involve collecting data on weight, height or length, we were unable to assess the relative effect of other anthropometric indicators in our analysis. However, given our research question, we believe that even with the lack of these data, our findings on the influence of ethnicity on the validity of MUAC in detecting risk of mortality remain robust.
Some strengths of our study are the large sample size and community-based implementation. MUAC was measured by community-based study personnel after training and standardization, which is likely less variable than measurement in more programmatic settings. The study also had high follow-up with 15 % lost to follow-up and/or refusal to participate. Those lost were similar to those who continued, reducing the likelihood of bias. Although these results were robust with a large sample size, it is possible that they are not generalizable to other populations.
Conclusions
There are ethnic differences in the risk of mortality by MUAC using a cut-off of <11·5 cm in children aged <6 months, but the cut-off worked well in both ethnicities among those aged 6 months or older. Hence this MUAC cut-off is useful from a programmatic perspective for identifying high-risk SAM in children aged ≥6 months and might also be useful in subgroups of children aged <6 months.
Acknowledgements
Financial support: This work was supported by the National Institutes of Health, Bethesda, MD, USA (grant number HD 38753) and the Bill & Melinda Gates Foundation, Seattle, WA, USA (grant number 810-2054). Funders had no role in the design, analysis or writing of this article. Conflict of interest: None of the authors has any relevant conflicts of interest to disclose. Authorship: A.G. contributed to conceptualization of the analysis, conducted the data analysis and wrote the first draft of the paper. J.M.T. was the principal investigator of the original trial from which this analysis derives, contributed to the conceptualization of this analysis and provided feedback on draft revisions. S.K.K. was the local investigator of the original trial and provided feedback on draft revisions. S.C.L. was engaged in the data acquisition from the original trial and provided feedback on draft revisions. L.C.M. was a co-investigator on the study, engaged in the design and implementation of the field activities, was responsible for data management and preparation of analytic data sets, and provided feedback on draft revisions. J.K. was engaged in the design and data acquisition of the original trial from which the data were derived, contributed to the conceptualization of this analysis, provided advice on data analysis and feedback on draft revisions. Ethics of human subject participation: This study was conducted according to the guidelines laid down in the Declaration of Helsinki and all procedures involving human subjects were approved by the Nepal Health Research Council, the Committee on Human Research of the Johns Hopkins Bloomberg School of Public Health, Baltimore, MD, USA and the Institutional Review Board of Cornell University, Ithaca, NY, USA. Verbal informed consent was obtained from all subjects. Verbal consent was witnessed and formally recorded.
Supplementary Material
To view supplementary material for this article, please visit https://doi.org/10.1017/S1368980018000940


