


Overweight and obesity are serious, large-scale global public health concerns. Obesity is not only associated with a lack of self-esteem, depression, social and work problems, but also with a range of chronic diseases(Reference Pi-Sunyer1). Obesity has also been clearly related to socio-economic factors(Reference McLaren2). The prevalence of obesity increases gradually in each 10-year age category in the Flemish and Belgian populations(Reference Stam-Moraga, Kolanowski, Dramaix, De Backer and Kornitzer3, Reference Duvigneaud, Wijndaele, Matton, Deriemaeker, Philippaerts, Lefevre, Thomis and Duquet4).
According to Belgian military health recruitment standards, all army men should have a normal BMI at the start of their career(Reference Mullie, Vansant, Hulens, Clarys and Degrave5). However, Kress and co-workers demonstrated in the US military that decades of active duty does not confer any long-term protection against overweight or obesity(Reference Kress, Hartzel and Peterson6, Reference Kress, Peterson and Hartzell7). Such data are not available for the Belgian army. Therefore, the present study was designed to evaluate the evolution of BMI over 14 years. Second, the influence of socio-economic position was evaluated.
Methods
Between 1 January 1992 and 31 December 2005, the biomedical data of personnel who participated in international peace-keeping missions were registered by the Belgian army. The variables registered at each period were date of birth, self-reported weight and height, sex and military rank.
The study population was divided in two samples. The first sample, named the total cohort, included 49 784 male and female military employees who took part in one or more international military peace-keeping missions between 1992 and 2005. Because of the under-representation of women, we studied only the male population (n 48 850). BMI data were incomplete in 5507 cases, leaving a cohort of 43 343 army men. For each of the fourteen years between 1992 and 2005, a mean of 3096 subjects were evaluated. From this cohort, we identified 1497 paired measurements of army men who carried out two peace-keeping missions, the first between 1992 and 1994 and the second between 2003 and 2005. The total cohort was used to study cross-sectional effects, while the paired cohort was used to study longitudinal effects.
BMI was classified according to the WHO criteria(8): normal weight, 18·5 ≤ BMI < 25·0 kg/m2; overweight, 25·0 ≤ BMI < 30·0 kg/m2; and obesity, BMI ≥ 30·0 kg/m2. The age of the individuals was stratified into the following groups: 20–29 years, 30–39 years, 40–49 years and 50–59 years.
The military ranking system was used as an indicator for socio-economic position and recorded in three groups: officers, non-commissioned officers and soldiers. It is mandatory for officers to complete studies at university degree level, while non-commissioned officers usually have an intermediate level of study and soldiers follow a more technical or professional curriculum. Additionally, the income of officers is higher than that of non-commissioned officers, which in turn is higher than for soldiers. As such, the military ranking system is useful for studying the socio-economic influence on diet and lifestyle.
For the descriptive statistics of stratified BMI, we used the median and the interquartile range (IQR). Because of the non-normal distribution (P after Kolmogorov–Smirnov test <0·01), we used non-parametric statistical methods. For the paired observation, we used the Friedman and Wilcoxon tests to study the changes in BMI. The influence of socio-economic parameters was analysed with a χ 2 test.
The Statistical Package for the Social Sciences statistical software package version 14·0 (SPSS Inc., Chicago, IL, USA) was used.
Results
Table 1 shows the evolution of the major BMI categories (normal weight, overweight and obesity). The figures are presented for different age categories of the total cohort (n 43 343) and for three periods (missions between 1992 and 1994; missions between 1995 and 2002; missions between 2003 and 2005). For each category of rank, the percentage of men with normal weight declined over time. For the first mission between 1992 and 1994, the prevalence of normal weight was 66·1 % (n 668) for the officers, 61·9 % (n 1496) for the non-commissioned officers and 66·7 % (n 4429) for the soldiers. For the third mission between 2003 and 2005, those figures were respectively 61·5 % (n 665), 53·9 % (n 1530) and 63·2 % (n 2270).
Table 1 Distribution of normal weight, overweight and obesity by rank, age and period for the total cohort, Belgian army personnel who participated in international peace-keeping missions between 1 January 1992 and 31 December 2005
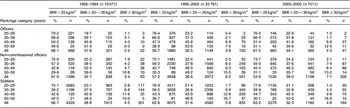
As expected and for each rank category, the prevalence of normal weight was higher for the age category 20–29 years compared with the older categories.
Table 2 shows the BMI data for the paired cohort. The paired cohort comprised 9·2 % (n 138) officers, 65·2 % (n 976) non-commissioned officers and 25·6 % (n 383) soldiers. Age before the first period of duty was different between the three military rankings (H (2) = 95·70, P < 0·001). Officers were in general older (median 32·3 (IQR 9·0) years) compared with non-commissioned officers (median 27·7 (IQR 6·0) years) and with soldiers (median 23·4 (IQR 13·0) years). Despite this age difference, there was no significant difference in BMI between the military rankings before the first and second missions. Before the first mission, median BMI for officers was 23·8 (IQR 2·2) kg/m2, for non-commissioned officers was 23·9 (IQR 3·2) kg/m2 and for soldiers was 23·6 (IQR 3·7) kg/m2 (H (2) = 3·63, P = 0·16); before the second mission, median BMI was respectively 24·6 (IQR 2·9) kg/m2, 24·7 (IQR 3·6) kg/m2 and 24·6 (IQR 3·5) kg/m2 (H (2) = 0·72, P = 0·70).
Table 2 Distribution of normal weight, overweight and obesity by rank and period in the paired cohort, Belgian army personnel who participated in international peace-keeping missions between 1992 and 1994 and 2003 and 2005
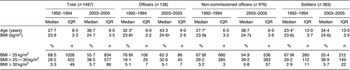
*Significantly different between officers, non-commissioned officers and soldiers (Kruskal–Wallis test): P ≤ 0·001.
†,‡,§Significantly different between the first and second mission for officers, non-commissioned officers and soldiers, respectively (Wilcoxon signed-ranks test): P ≤ 0·001.
||Significantly different between officers v. non-commissioned officers and soldiers (χ 2 test): P = 0·01.
Before the first mission, normal BMI was more common in the group of officers compared with the groups of non-commissioned officers and soldiers. In total, 76·8 % (n 106) of officers had BMI below 25·0 kg/m2, compared with 69·1 % (n 920) of non-commissioned officers and soldiers (χ 2 = 7·12, df = 2, P = 0·01). There was no difference between non-commissioned officers and soldiers (χ 2 = 0·38, df = 2, P = 1·0). Before the second mission, only 62·3 % (n 86) of officers had BMI below 25·0 kg/m2, compared with 54·6 % (748) of non-commissioned officers and soldiers (χ 2 = 2·69, df = 2, P = 0·20). Consequently, over a 10-year period, 14·5 % (n 20) of officers changed from normal weight to overweight, compared with 12·6 % (n 172) of non-commissioned officers and soldiers.
Table 3 shows the summary statistics for age-stratified BMI. Before the first mission, 88·6 % (n 31) of men younger than 20 years of age had BMI below 25·0 kg/m2 compared with 42·4 % (n 25) of men older than 40 years. BMI below 25·0 kg/m2 was more common in the group aged below 30 years (75·4 %, n 697) compared with the group aged 30 years and more (57·5 %, n 329) (χ 2 = 52·13, df = 2, P = 0·001). Before the second mission, 62·3 % (n 576) of men younger than 30 years had BMI below 25·0 kg/m2 compared with 46·5 % (n 266) of men older than 30 years (χ 2 = 35·75, df = 2, P = 0·001). This means that 13·1 % (n 121) of men with an age below 30 years and 11·0 % (n 63) of men older than 30 years before the first mission changed from normal weight to overweight.
Table 3 Distribution of BMI stratified by age for the paired cohort, Belgian army personnel who participated in international peace-keeping missions between 1992 and 1994 and 2003 and 2005 (n 1497)

*Age in 1992–1994.
†,‡Significantly different at the first and second mission respectively between age categories (χ 2 test): P = 0·001.
Discussion
The results of the present study demonstrate an increase in BMI of one unit over a period of 10 years. This was demonstrated by the secular data and by the paired cohort. The latter was independent of socio-economic factors, since this increase was present throughout the military rankings. Before the first observation point, 34·5 % (n 3478) of the total cohort had BMI above 25·0 kg/m2 and 10 years later prevalence of overweight increased to 40·6 % (n 3046). For the paired cohort, prevalence increased from 31·5 % (n 471) to 44·3 % (n 663).
The prevalence of overweight and obesity is substantially lower in our study group compared with that in the working Belgian population. Since 1987 the largest occupational health service of Belgium (IDEWE) has recorded body weight and height of male and female workers(Reference Moens, Van Gaal, Muls, Viaene and Jacques9). In 2000, approximately 52 % of 83 683 male employees had BMI above 25 kg/m2, compared with 41 % (n 1506) in our paired cohort in 2000. This finding can be explained by the fact that army men have to pass a double selection to qualify for international missions. BMI was used as a selection criterion at the entrance in the army and again before participation in international military missions.
Some limitations of our study are worth noting. The study was carried out using self-reported height and weight data. A large body of evidence has shown that the prevalence of overweight based on such data may be biased because a tendency to over-report height and under-report body weight exists in the general population(Reference Bostrom and Diderichsen10–Reference Kuczmarski, Kuczmarski and Najjar12). The validity of self-reported height and weight may vary with sex, BMI status, age and socio-economic status(Reference Bostrom and Diderichsen10–Reference Kuczmarski, Kuczmarski and Najjar12). However, as demonstrated by Bolton-Smith et al.(Reference Bolton-Smith, Woodward, Tunstall-Pedoe and Morrison13), under-reporting is directly associated with obesity, a condition with low prevalence in our cohort. Moreover, under-reporting of weight and over-reporting of height results in a net under-reporting of the global obesity problem(Reference Bolton-Smith, Woodward, Tunstall-Pedoe and Morrison13).
The study had a cross-sectional design. A cross-sectional design does not allow drawing conclusions about causalities, because the relationship between different variables is studied at one point in time. However, the cross-sectional design relates how variables affect each other at the same time, and is well accepted as an instrument to study the prevalence of health-related conditions at a specific time. Moreover, multiple cross-sectional designs can be used to monitor the evolution of those conditions over time(14).
Extrapolation of our results to the general population is delicate. However, an age-dependent effect on BMI has also been described for the general population(14).
The results of the present study are challenging: even in a highly selected population an age-dependent effect on BMI was present. Moreover, this effect was present across all social classes.
Studies have shown that low socio-economic position is related to higher prevalence of overweight and obesity(Reference Stam-Moraga, Kolanowski, Dramaix, De Backer and Kornitzer3, Reference Sobal and Stunkard15–Reference Stunkard and Sorensen18). This inverse relationship was especially consistent when occupation was used as proxy for socio-economic position, but less consistent with education and income as proxy(Reference Ball and Crawford19). In our sub-cohort, we did not find a socio-economic gradient in mean BMI between officers, non-commissioned officers and soldiers. This lack of contrast can be explained by the strictly determined military health standards to enter the army. BMI less than 25 kg/m2 is mandatory.
It is clear that, to answer the physical demands of a military career, an individual has to avoid excess body weight(Reference Naghii20). For an army, a population-based and environmental approach to prevent overweight and obesity, at acceptable financial investments, seems to be essential to limit the epidemic. An increase of one BMI unit means an increase in weight of 4 kg maximum. To avoid this increase in 10 years, a person has to burn only ~42kJ (10 kcal) extra per day, which can be achieved during normal occupational activities. Identification of persons at risk can be important. BMI between 24 and 25 kg/m2 at the time of accession to the military career, a family history of obesity, poor performances on physical tests, or rapid weight gain after one year of duty may be possible predictors for later weight-related health problems(Reference Naghii20).
The increase in BMI over the study period is rather age-dependent than time-dependent. However, since weight increases significantly, the military leadership should emphasize prevention in order to reduce the health-care costs and disease burden in this cohort. As the risk of being overweight increases after age 40 years, the emphasis on prevention should be targeted before this age.
Acknowledgements
The authors declare that they have no conflicting interests and received no source of funding for this study. P.M. and E.D. carried out the statistical analysis, interpreted the data and drafted the manuscript. M.H., I.G., G.V. and P.C. participated in the critical review of the manuscript.


