


Introduction
The majority of the world population speaks more than one language (Grosjean, Reference Grosjean2010), and modern-day pressures of globalization have led to a steady increase in the number of individuals worldwide who acquire additional languages during their lifetime. This is particularly true of people who do not speak English as their first language, labeled here as L1 (Graham, Reference Graham1987; Macaro et al., Reference Macaro, Curle, Pun, An and Dearden2018; Woodrow, Reference Woodrow2006). This global trend has brought forward the question of how the interplay between cognitive, demographic, linguistic, and environmental factors contributes to the success or failure of developing proficiency in a second language (L2). Researchers have responded to the challenge with a proliferation of studies of L2 acquisition and bilingualism in fields as diverse as linguistics, psychology, education, computer science, and medicine. A bibliometric analysis of publication trends in the Web of Science reference database in 1980–2019Footnote 1 reveals that the absolute number of publications on L2 and bilingualism has increased by a factor of 27 (129 in 1980 vs. 3,440 in 2019). When normalized by the annual growth of the total number of publications in Web of Science, the increase is sixfold (from 0.017% of total documents in 1980 to 0.104% in 2019) and has an exponential functional form (Figure 1).

Figure 1. Publications on L2 and bilingualism presented as percentage of the total number of documents in Web of Science per year, in 1980–2019. The number of publications per year is reported within the plot.
Yet the expanding scope of bilingualism research also brings forth unique methodological challenges. On the one hand, the large number of studies in the field comes with a high degree of heterogeneity in the choice of experimental methods, tasks, and populations across studies, making it difficult to compare studies and build generalizable theories. On the other hand, there is one aspect of bilingualism research that is often lamented for its lack of heterogeneity: the fact that only a small selection of language pairs—the first/dominant language of participants (L1) and their additional language (L2) in which a task is administered—is typically studied. As a result, a need exists for behavioral data from many language backgrounds across participant samples and laboratories (see, e.g., De Bruin, Reference De Bruin2019; Gullifer & Titone, Reference Gullifer and Titone2020; Luk & Bialystok, Reference Luk and Bialystok2013).
The present study aims to address this need in a subfield of bilingualism research: L2 reading. This focus stems from the central role that literacy in L2 has for an individual’s academic, professional, and personal development (e.g., Batalova & Fix, Reference Batalova and Fix2015; Collier, Reference Collier1989; Dressler & Kamil, Reference Dressler, Kamil, August and Shanahan2006). It also stems from the well-supported notion that reading in L2 is a highly advanced skill that requires the presence and coordinated use of a wide variety of oral-language and print-specific skills in the L1 and L2 of the reader (see review in the following text). This article contributes to L2 reading research in two ways. First, we present a new publicly available data resource on reading behavior in English as L2, called MECO L2 (L2 Multilingual Eye Movements Corpus). MECO L2 includes a rich eye-movement record of text reading in English among speakers of 12 different L1s: 11 groups of L2 readers of English plus a group of English-speaking L1 controls. Further, MECO L2 is supplemented by a test battery of selected component skills of reading in English, and demographic and language background data. The aim of this corpus is to provide the field of L2 reading research with comparable high-quality and ecologically valid behavioral data across language backgrounds, collected using the same methods from comparable populations of readers. A parallel resource, MECO L1 (Siegelman et al., Reference Siegelman, Schroeder, Acartürk, Ahn, Alexeeva, Amenta, Bertram, Bonandrini, Brysbaert, Chernova, Da Fonseca, Dirix, Duyck, Fella, Frost, Gattei, Kalaitzi, Kwon, Lõo and Kuperman2022), contains eye-movement data from the same participants reading in their respective L1, enabling a within-participant comparison of reading behavior in their L1 and L2. The expansion of the empirical base that the MECO corpus affords is expected to facilitate refinement and generalizability of existing theoretical accounts and provide quantifiable evidence on individual- and group-level factors predicting reading proficiency in L2.
Thus, the first goal of this article is to introduce the design and method of MECO L2 and report basic psychometric and descriptive characteristics of the data. In Analysis 1 we start by providing reliability estimates for the central behavioral indices of L2 reading proficiency in MECO L2—reading fluency (collected using eye movements) and comprehension accuracy—as well as the reliability of all additional tests used. This groundwork is necessary to ensure that the reported data is of a sufficient quality to sustain inferential analyses. Then, we outline in Analysis 2, for each sample of participants, descriptive statistics on all outcomes of the reading task and tests of component skills of English reading, as well as the correlations between the various measures in the MECO L2 dataset. The aim of Analysis 2 is to transparently communicate both the variability and the trends in the MECO L2 data.
The second goal that we envisioned for this article is an overview of the novel types of analyses that MECO L2 makes possible. Our specific focus is on one long-standing question at the forefront of L2 reading research: What factors determine reading fluency and comprehension in a nondominant language? Specifically, in Analysis 3, we quantify the contributions of three major predictors to variance in L2 fluency and comprehension: the individual’s L1 proficiency, their mastery of English L2 component skills, and the cross-sample variability in L1 backgrounds. The objective of this analysis is to point at the major sources of variance in the two key facets of L2 reading proficiency, that is, reading fluency and comprehension, among advanced university-level L2 readers of English. Because similar existing analyses have laid the groundwork for the current theories on the multicomponential nature of L2 reading proficiency, we aim to validate this understanding against a uniquely large and diverse dataset. We also expand on existing literature by linking together analyses of fine-grained measures of reading fluency, afforded by eye-tracking, and reading comprehension. We also examine a relationship between L1 and L2 performance within-participants. We stress, however, that this analysis only reflects one possible use of MECO L2. We outline additional analytical possibilities throughout the article, especially in the “Future Directions” section. The full MECO L2 data is made publicly available to foster such future research.
As background for this central analysis, the next section reviews the rich body of knowledge on the determinants of L2 reading behavior, with an emphasis on meta-analytical findings, and a focus on the predictors of reading comprehension versus reading fluency.
The determinants of L2 reading proficiency
L2 reading proficiency is sometimes visualized as the top block of a pyramid propped by a multitude of lower-level blocks representing a coordinated body of diverse skills and abilities (Geva & Wiener, Reference Geva and Wiener2015). There appears to be a consensus for at least three factors that shape L2 reading proficiency at the level of an individual. An influential book by Bernhardt (Reference Bernhardt2011) labels these three factors as “L1 literacy” (relabeled here as L1 proficiency, for terminological consistency), “L2 knowledge” and “unexplained variance.” The contribution of reading proficiency in one’s L1 to their L2 reading proficiency is easy to explain. Becoming a functional reader in L2 mobilizes similar cognitive and physiological resources and requires acquiring the same types of skills that are necessary for fluent reading in L1.Footnote 2 Because reading proficiency (in any language) has comprehension and fluency as facets, the current study quantifies both L1 comprehension and L1 fluency as predictors of L2 comprehension and fluency, respectively.
L2 knowledge is an umbrella term for the individual mastery of L2 component skills. These include general oral language skills in L2, such as listening comprehension, vocabulary, phonological awareness, morphological awareness, and grammatical knowledge (see, e.g., Gillon, Reference Gillon2017; Jeon & Yamashita, Reference Jeon and Yamashita2014; Koda, Reference Koda2000; Schmitt, Reference Schmitt2008; and Vandergrift, Reference Vandergrift2007 for reviews), as well as other component skills that are relevant for L2 reading, such as knowledge of the writing system and its orthographic conventions and decoding skills (Cook & Bassetti, Reference Cook and Bassetti2005). The development of specific component skills in reading is interconnected, and, as the pyramid analogy suggests, a sufficient mastery is required in all these components to sustain functional levels of L2 reading proficiency. Finally, Bernhardt’s (Reference Bernhardt2011) term unexplained variance relates to the extralinguistic characteristics of a reader: including general and domain knowledge, cultural capital, motivation and attitudes toward L2, and domain-general cognitive skills (e.g., executive functions, nonverbal IQ; see reviews by Bernhardt, Reference Bernhardt2011; Brevik et al., Reference Brevik, Olsen and Hellekjær2016; Grabe, Reference Grabe2009).
Beyond these individual-level characteristics, several group-level factors have been argued to influence L2 reading proficiency. We focus here on one such group-level factor: the linguistic distance between the individual’s L1 and the L2 they learn (e.g., Van der Slik, Reference Van der Slik2010). A closer affinity between L1 and L2 is considered to facilitate a greater deal of lexical, phonological, morphological, and syntactic transfer from L1 skills to L2 and thus contribute to L2 proficiency. Specifically, in the case of reading, L2 proficiency may be facilitated by a similarity between L1 and L2 scripts both in type (e.g., alphabetic or logographic) and visual similarity of characters, as well as in similarity in the phonetic counterparts of analogous characters (see reviews by Jeon & Yamashita, Reference Jeon and Yamashita2014; Koda, Reference Koda1996, Reference Koda2005; Melby-Lervåg & Lervåg, Reference Melby-Lervåg and Lervåg2011).
The potential determinants of L2 reading proficiency listed in the preceding text—that is, L1 proficiency, L2 knowledge, extralinguistic factors, and the L1–L2 distance—have been proposed as general predictors of reading proficiency, relevant for all facets (i.e., both L2 reading fluency and comprehension). Yet, most existing analyses to date only provide estimates for the role those determinants play in L2 reading comprehension. We review this evidence first, and then proceed to the case of reading fluency.
Studies of L2 reading comprehension
Using meta-analyses of multiple L1/L2 pairs and populations, Bernhardt (Reference Bernhardt2005, Reference Bernhardt2011) estimated the contribution of L1 proficiency at 20% of the variance in L2 reading comprehension, whereas L2 knowledge explained 30% of that variance. This estimation leaves roughly half of the variance in L2 reading comprehension unexplained. In a similar vein, Jeon and Yamashita’s (Reference Jeon and Yamashita2014) meta-analysis calculated average correlations between L2 reading comprehension and a variety of L1 and L2 component skills. They confirmed a greater predictive power of L2 knowledge compared to L1 proficiency or language-general and domain-general cognitive skills (see Melby-Lervåg & Lervåg, Reference Melby-Lervåg and Lervåg2011 for similar findings). Specifically, L2 grammar knowledge (average r = .85), L2 vocabulary knowledge (r = .79), and L2 grapheme-to-phoneme decoding (r = .56) were the strongest predictors of L2 reading comprehension, followed by L1 reading comprehension (r = 0.50) as a somewhat weaker predictor. Further, the L1–L2 linguistic distance was a significant moderator of the relationship between L1 and L2 reading comprehension in their meta-analysis, with stronger correlations between L1 reading comprehension and L2 reading comprehension in linguistically similar language pairs (average r = .65 when both L1 and L2 were Indo-European) than in linguistically dissimilar ones (average r = .34 in other combinations), likely due to the differences in the ability to transfer L1 skills onto L2 learning (see also Koda, Reference Koda2005, for converging evidence). In sum, meta-analyses and reviews of the field, along with the primary sources they cover, draw a fairly robust picture of L2 reading comprehension: known factors explain about 50–60% of its variance.Footnote 3 Among these factors, L2 knowledge plays a stronger predictive role than L1 proficiency, the linguistic L1–L2 distance modulates the impact of some L1 skills further, and extralinguistic factors are found to have only minor influence.
L2 reading fluency
High reading proficiency is not only about comprehending the text being read but also doing it fluently. Just like reading comprehension, reading fluency is a multifaceted ability, informed by skills in decoding, word recognition, morphological and syntactic segmentation, reading experience, and domain-general cognitive skills (e.g., Altani et al., Reference Altani, Protopapas, Katopodi and Georgiou2020; Hudson et al., Reference Hudson, Pullen, Lane and Torgesen2008; Kendeou et al., Reference Kendeou, Papadopoulos and Spanoudis2012; Kuhn et al., Reference Kuhn, Schwanenflugel and Meisinger2010). Most research on L2 reading fluency, especially when text reading is concerned, has been conducted with the use of eye-tracking. Eye-tracking is an experimental paradigm that registers eye movements during reading in real time and generates a demonstrably reliable and valid record of reading behavior in a noninvasive and ecologically valid way (see Godfroid, Reference Godfroid2020; Rayner, Reference Rayner1998; and Rayner et al., Reference Rayner, Pollatsek, Ashby and Clifton2012). We adopt this paradigm in the MECO project as well.
Although eye-tracking studies are relatively new in L2 research (reviewed in Godfroid, Reference Godfroid2020), they have led to important insights into differences between reading fluency in L1 and L2 (see among others Conklin et al., Reference Conklin, Alotaibi, Pellicer-Sánchez and Vilkaitė-Lozdienė2020; Cop et al., Reference Cop, Dirix, Drieghe and Duyck2017; Godfroid, Reference Godfroid2020; Roberts & Siyanova-Chanturia, Reference Roberts and Siyanova-Chanturia2013), L1 versus L2 word recognition processes (e.g., Cop et al., Reference Cop, Keuleers, Drieghe and Duyck2015; Duyck et al., Reference Duyck, Van Assche, Drieghe and Hartsuiker2007) as well as L2 vocabulary acquisition (Elgort et al., Reference Elgort, Brysbaert, Stevens and Van Assche2018; Godfroid et al., Reference Godfroid, Boers and Housen2013, Reference Godfroid, Ahn, Choi, Ballard, Cui, Johnston and Yoon2018; Mohamed, Reference Mohamed2018; Pellicer-Sánchez, Reference Pellicer-Sánchez2016; Pellicer-Sánchez et al., Reference Pellicer-Sánchez, Conklin and Vilkaitė-Lozdienė2020). To give two examples most relevant for this article, Parshina et al. (Reference Parshina, Laurinavichyute and Sekerina2021) report differences in eye-movement measures of sentence reading in L1, Heritage, and L2 readers of Russian. Similarly, Cop et al. (Reference Cop, Drieghe and Duyck2015) showed differences in eye-movement measures using a within-participant comparison between L1 (Dutch) and L2 (English) participants reading a full novel. In both Parshina et al. and Cop et al., L1 reading was associated with greater fluency, that is, fixations on words were shorter and less numerous, more words were skipped, fewer words were refixated, and there were fewer rereadings of the read text.
Despite this emerging line of research, no systematic study has yet analyzed L2 reading fluency in terms of the relative contributions of the preceding proposed factors—L1 proficiency, L2 component skills, and L1–L2 distance. Also, to our knowledge, relatively few studies of L2 reading fluency have adopted the individual differences paradigm to examine the impact of specific L2 component skills of reading (however see, Titone et al., Reference Titone, Libben, Mercier, Whitford and Pivneva2011; Whitford & Titone, Reference Whitford and Titone2012, Reference Whitford and Titone2017, among others). This contrasts with well-developed literature on causes of individual variability in L1 reading fluency (e.g., Kuperman & Van Dyke, Reference Kuperman and Van Dyke2011; Taylor & Perfetti, Reference Taylor and Perfetti2016; Veldre & Andrews, Reference Veldre and Andrews2014). MECO L2 data paves the way for filling this gap. Based on the studies mentioned in the preceding text (Cop et al., Reference Cop, Drieghe and Duyck2015; Parshina et al., Reference Parshina, Laurinavichyute and Sekerina2021) and similar findings in the literature (e.g., Nisbet et al., Reference Nisbet, Bertram, Erlinghagen, Pieczykolan and Kuperman2021; Whitford & Titone, Reference Whitford and Titone2012, Reference Whitford and Titone2017), we expected eye-movement patterns recorded during L2 reading to reflect individual variability in L2 knowledge and L1 proficiency, as well as group differences due to L1 background (Berzak et al., Reference Berzak, Katz and Levy2018).
MECO L2
MECO L2 focuses on English L2 text reading for comprehension. We document and analyze both English reading fluency and comprehension quality. Specifically, readers’ eye movements are recorded during passage reading as a real-time high-precision index of fluency, while the accuracy of answers to comprehension questions is calculated as an index of comprehension quality. The MECO L2 collection of eye-tracking data is further enhanced by a battery of tests in several key component skills of reading in English and a demographic and language background questionnaire. Eleven samples of participants from different countries and languages provided L2 reading data, along with one sample of English-speaking L1 readers. In addition to analyses confined to the participants’ L2 performance, we also draw on eye-tracking and text comprehension data available for the same participants from the L1 portion of MECO (Siegelman et al., Reference Siegelman, Schroeder, Acartürk, Ahn, Alexeeva, Amenta, Bertram, Bonandrini, Brysbaert, Chernova, Da Fonseca, Dirix, Duyck, Fella, Frost, Gattei, Kalaitzi, Kwon, Lõo and Kuperman2022).
As stated in the preceding text, the overarching goal of the MECO L2 resource is to provide a high-quality open-access source of comparable cross-linguistic data on L2 text reading. The 12 native languages spoken by the 543 participants of MECO L2 represent four major language families (Indo-European, Uralic, Semitic, and Turkic) and four writing systems (Latin-based, Cyrillic, Greek alphabetic, and Hebrew abjad). The 11 non-English L1s in MECO vary widely in their historical and typological similarity to English, from high (e.g., Dutch, German) to low (e.g., Turkish, Hebrew, Finnish).
The design of the MECO L2 study ensured that several (though by no means all) undesired sources of variability were eliminated or at least limited. All participants completed the same test battery regardless of their L1 and read the same selection of texts in English for comprehension while their eye movements were tracked and answered the same set of comprehension questions after each text. All laboratories used a similar type of eye-tracking device, a version of the EyeLink eye-tracker (SR Research, Kanata, ON, Canada), and a similar stimulus presentation setup. All participants represented a cross-nationally comparable segment of the population across countries: that is, university students who self-selected to undertake tertiary education and successfully met educational requirements to do so. As MECO targets university students as a population of interest, participants were typically young adults with comparable mean ages across sites and relatively high levels of L2 proficiency, assured by mandatory school and university English-proficiency exams and/or training.
Many of the present design decisions follow influential precedents, including the Dundee corpus of texts read in English and French (Pynte & Kennedy, Reference Pynte and Kennedy2006); the GECO corpus (Cop et al., Reference Cop, Dirix, Drieghe and Duyck2017), in which Dutch-speaking university students read an Agatha Christie novel in their L1 and L2 (English) while English-speaking controls read the same novel in their L1; Whitford and Titone’s (Reference Whitford and Titone2012, Reference Whitford and Titone2017) studies in which English–French and French–English bilingual students read passages for comprehension in both their L1 and L2; and Berzak et al.’s (Reference Berzak, Katz and Levy2018) study of eye movements recorded during reading of unrelated English sentences by native speakers of five languages (English, Chinese, Japanese, Spanish, and Portuguese). Other studies addressed specific hypotheses by comparing L1 and L2 reading of the same sentences (e.g., Canadian L1, and Finnish and German L2 readers of English in Nisbet et al., Reference Nisbet, Bertram, Erlinghagen, Pieczykolan and Kuperman2021). MECO L2 complements and augments these resources by its unprecedented scale of adult L2 speakers of English, the wider variety of native languages included, and the amount of information collected from the participants.
The remainder of this article is structured as follows. The “Methods” section provides specifications of the design and implementation of the MECO L2 corpus. The “Results” section begins with laying the groundwork for future uses of MECO L2. Within this section, Analysis 1 reports the reliability of the collected data in the reading task and tests of English component skills. Next, Analysis 2 provides a descriptive overview of data across language samples, along with a correlation analysis of measures of reading behavior and component skills of L2 reading. Then, Analysis 3 focuses on a main theoretical question of interest by examining the relative contributions of factors proposed by prior research to L2 reading fluency and comprehension. That is, it partitions the variance in L2 reading behavior to examine the relative influence of L1 proficiency, L2 component skills (along with domain-general skills), and the L1 spoken by the L2 readers. Thus, MECO L2 enables us to examine the relative impact of all these factors on English L2 reading proficiency in readers of an unprecedented number of L1s and to disentangle their contributions to L2 fluency and comprehension.
Methods
Participants
The data we present here were collected in 12 eye-tracking laboratories around the world. English was the first and dominant language for participants at one of these sites (Canada, labeled L1 sample), while in the remaining 11 sites English was not the first or dominant language of participants. For simplicity, we refer to the latter group as L2 samples (even though for some participants, English was a third or fourth language based on information that was collected as part of the language background questionnaire, see the following text). Note that in these L2 samples, fully bilingual participants (speaking English), students majoring in the English language or literature, as well as individuals who have lived for more than six months in an English-speaking country were not eligible for participation in the study. Because we were interested in tapping into English proficiency typical of university students in participating countries, this step aimed at removing individuals who have had an uncharacteristically intensive exposure to the English language: very few individuals matched these exclusion criteria.
Each of the participating sites aimed to reach n = 45–55 participants with usable data (see “Data Editing and Cleaning” for details regarding inclusion of participants and trials). Indeed, most laboratories reached this range. However, the final stages of data collection were cut short due to COVID-19–related closures in some laboratories. As a result, the current sample size in three laboratories is smaller than the target (n = 25 in Turkey; n = 40 in Norway; and n = 41 in Argentina). This challenge is addressed in the “Future Directions” section. Table 1 lists the number of participants, the country, and institution where the data were collected, details regarding the participants’ compensation, and the L1 of participants in each sample. The table also includes summaries of participants’ age and years of education collected using the language background questionnaire (see “Additional Questionnaires and Tests”). Participants’ full demographic information is available through the project’s data repository (see “Data Availability”). The ethics clearance was obtained by each participating site from the ethics research board of the corresponding institution or country.
Table 1. Information regarding participants in available samples

Note: The “L2 data” for the Canadian sample represented L1 reading of the same 12 English texts that all other participant samples read.
Materials
In the English L2 eye-tracking reading task, all participants read a set of 12 texts in English. Texts were training materials for the ACCUPLACER Reading test and the English as Second Language Reading Skills test. These tests are commonly used for the course placement of speakers of English as L1 or L2 as incoming or in-course students in North American colleges. All texts were written in expository prose and presented encyclopedic information about a person (e.g., Samuel Morse) or a historic or natural phenomenon (e.g., Da Vinci’s inventions). Each text was followed by two four-alternative-forced-choice comprehension questions tapping into factual knowledge and inferencing based on the text that was read. Texts and questions were presented to participants in a fixed order. Table 2 details the number of words and sentences in each text, as well as two readability indices determined using the Coh–Metrix web tool (Graesser et al., Reference Graesser, McNamara, Louwerse and Cai2004): For details on the indices see Crossley et al. (Reference Crossley, Greenfield and McNamara2008). One such index, the Flesch–Kincaid grade level of readability, showed that the texts were in the range expected of high-school and college-level reading (M = 10.56, SD = 2.68). Comparatively, these values were very close to those determined in a corpus study by Crossley et al. (Reference Crossley, Allen and McNamara2011) as representative of readings for advanced L2 learners of English (M = 10.21, SD = 1.61). An additional index of L2 readability, the Coh–Metrix L2 readability score (M = 16.17, SD = 5.56), placed the MECO L2 texts near the mean values that Crossley at al. (Reference Crossley, Allen and McNamara2011) associated with readings for intermediate learners (M = 16.08, SD = 5.31). These readability estimates thus suggest that the texts used are appropriate for our intermediate-to-advanced sample of English L2 readers (given that some English-proficiency selection is part of the entrance requirements in most participating universities). See the project’s repository for details.
Table 2. The number of sentences, number of words and average word length, as well as readability indices of the texts used in the eye-tracking English reading task

Additional questionnaires and tests
In addition to reading texts for comprehension, participants completed a battery of tests and questionnaires that were identical across samples. This battery included a nonverbal IQ test from the Culture Fair Test-3 (CFT20, Subset 3 Matrices, short version, Form A, timed at 3 minutes, Weiß, Reference Weiß2006), which provided a comparable cross-sample measure of nonverbal intelligence. Participants also completed an abridged version of the Language Experience and Proficiency Questionnaire (LEAP-Q; Marian et al., Reference Marian, Blumenfeld and Kaushanskaya2007), aimed at collecting basic demographic and linguistic information for both their L1 and English as their L2. In particular, the questionnaire included questions about the participants’ age and years of education (see information in Table 1), the age in which they started and/or became fluent in speaking and reading for their L1 and English, and self-ratings of their proficiency in their L1 and in English (or, in the case of the L1 sample, solely in English as their L1). As one partial example of the data collected, Table S1 in Supplementary Materials presents summaries of self-ratings of L1 and L2 proficiency. The full information collected through the questionnaire is available through the project’s OSF page (see the following text).
All participants also took a battery of six tests of individual differences in component skills of L2 relevant for reading proficiency. The battery included (a) a Spelling Recognition test, (b) a Vocabulary Knowledge test based on word recognition with multiple choice questions, (c) the assessment of motivation to excel in the task, (d) the lexical knowledge test LexTALE with yes/no decisions, and (e–f) the TOWRE test of reading efficiency with one subtest for word naming (Sight Word Efficiency) and one subtest for pseudoword naming (Phonemic Decoding Efficiency). For full details on the tests, as well as references, see Supplementary Materials S2. The tasks in the battery were administered in the fixed order (a)–(f). Tasks (a)–(c) were administered using an in-house web-based platform; task (d) was administered through the LexTALE website (http://www.lextale.com/); and tasks (e) and (f) were administered in the standard pencil-and-paper version.
All tests chosen as part of the MECO battery tap into component skills that have been designated as important for L2 reading proficiency in prior literature (see “Introduction” section). For instance, TOWRE probes an individual’s ability to associate English letters and sounds, an ability that underlies the ability to “crack the code” of a written language, including L2 (e.g., Hoover & Gough, Reference Hoover and Gough1990). Spelling is critical for learning the L2 writing system and orthographic word forms (e.g., Koda, Reference Koda, Coady and Huckin1997). Vocabulary (measured by the vocabulary knowledge test and LexTALE) is a component skill identified as central for successful oral and written L2 acquisition (e.g., Coady & Huckin, Reference Koda, Coady and Huckin1997). LexTALE is interesting because it is a test used in many psycholinguistic studies involving English L2 word knowledge, making comparisons across studies possible. Extralinguistic abilities, such as the nonverbal IQ and motivation to excel in the experiment, have been tested as well to ensure language-independent comparability between participant samples and partial coverage of the “unexplained variance” in Bernhardt’s (Reference Bernhardt2011) terms. We acknowledge that this test battery does not cover all relevant component skills of either L1 or L2 proficiency, including, among others, English listening comprehension, grammar knowledge, morphological awareness, and additional extralinguistic skills such as working memory and attitudes toward learning English. These omissions reflect practical constraints of the experiment duration and the ease of administration at multiple sites.
Procedure
The data reported here draw on two major components of the MECO data resource that focused on eye-tracking and other reading related L1 and L2 data, respectively (for details regarding the project see www.meco-read.com). The procedure was shared by both MECO components. All MECO participants took part in an experimental session including a variety of tests in both their native language and in English (except for a Korean sample that only completed the L1 part of the study). In this article we primarily concentrate on MECO L2 (the English-language portion of that study), which represented L2 reading for 11 countries’ samples and L1 reading for the Canadian sample: we also make use of the L1 performance of the same participants for comparative purposes.
The experimental session began with participants signing a consent form and filling out the LEAP-Q questionnaire. Then, participants proceeded to an L1 reading task. In this task, participants read 12 texts in their L1 silently for comprehension while their eye movements were recorded, and then answered four yes/no questions after each text. Following the L1 reading task, participants completed an individual differences battery in L1, which included the CFT-20 and other L1 individual differences tests. The L1 eye-tracking reading task and tests of individual differences in L1 are reported in detail in a separate paper (Siegelman et al., Reference Siegelman, Schroeder, Acartürk, Ahn, Alexeeva, Amenta, Bertram, Bonandrini, Brysbaert, Chernova, Da Fonseca, Dirix, Duyck, Fella, Frost, Gattei, Kalaitzi, Kwon, Lõo and Kuperman2022). Still, the L1 reading fluency and comprehension data are also included in the text that follows to examine the relations between L1 and L2 reading behavior within participants.
The focus of this article is on the next phase of the study. Participants proceeded to the English reading task, in which they were instructed to silently read 12 texts in English for comprehension, while their eye movements were recorded. The reading task was followed by the battery of English individual differences tasks described previously. As we detail in the following text, we use the L2 eye-tracking reading task to extract measures of L2 proficiency, tapping into L2 fluency (through eye movements) and comprehension (using comprehension accuracy). The L2 eye-tracking reading task lasted 20–30 minutes, and the individual differences battery took up to 30 minutes.Footnote 4 The entire procedure lasted no more than 2 hours, including breaks when requested. All data were collected by research assistants trained in eye-tracking data collection according to the protocols of their labs.
Apparatus
Information regarding the apparatus used at the different sites and additional settings can be found in Supplementary Materials S3. Eye movements were recorded with an EyeLink Portable Duo, 1000 or 1000+ eye-tracker (SR Research, Kanata, Ontario, Canada) with a sampling rate of 1,000 Hz. All sites used the same experimental procedure programmed in the Experiment Builder software (SR Researcher). A chin rest was used to minimize head movements. Calibration was performed using a series of nine fixed targets distributed around the display, followed by a 9-point accuracy test to validate eye position. Stimuli were viewed binocularly but eye-movement data were analyzed from only the self-reported dominant eye (the right eye in most participants). Before presenting the trial stimuli in the English eye-tracking reading task, a dot appeared on the monitor screen, slightly to the left of the first word in the passage. Once the participant had fixated on it, the trial would begin. This drift check took place at the beginning of each trial, and calibration was monitored by the experimenter throughout the task and was redone if necessary. Each of the 12 texts appeared on a separate screen. Participants were instructed to read the passages silently for comprehension and press the space bar when their reading of a passage was completed. A mono-spaced font (Consolas) was used with a size of either 20 or 22 points (given the variation in screen size and resolution at different testing sites) and 1.5 spacing. The refresh rate was set to 60 Hz at all sites. For further specifications of the screen, font size, presentation settings, visual angles, and apparatus at each participating site, see Supplementary Materials S3. The 12 texts were presented in the same fixed order for all participants (see text number in Table 2). Each text was followed by two multiple-choice comprehension questions, shown on a separate screen one after another. Participants responded by choosing their answers using the number keys (1–4).
Data editing and cleaning
In collecting eye-tracking data during paragraph reading there is often a need to correct eye fixation locations vertically and to assign fixations to text lines within a passage. In all parts of the MECO project we opted for an automatic correction of fixation locations, to avoid the commonly used manual procedure that is mostly nonreplicable and variable across laboratories. The trade-off is that this automatic procedure does not allow for manual correction and thus results in relatively more data loss. Automatic correction and assignment of fixations were done using the popEye software (implemented in R, version 0.6.4; Schroeder, Reference Schroeder2019), an integrated environment to preprocess and analyze eye-tracking data from reading experiments. Note that the same process was used also in the MECO’s L1 portion (Siegelman et al., Reference Siegelman, Schroeder, Acartürk, Ahn, Alexeeva, Amenta, Bertram, Bonandrini, Brysbaert, Chernova, Da Fonseca, Dirix, Duyck, Fella, Frost, Gattei, Kalaitzi, Kwon, Lõo and Kuperman2022). During preprocessing, popEye assigns fixations to lines, words, and letters. For the present study, an algorithm was used in which individual fixations are first grouped into sequences based on their spatial and temporal proximity. In the next step, sequences are assigned to the closest line based on their average horizontal location (see Carr et al., Reference Carr, Pescuma, Furlan, Ktori and Crepaldi2021; Špakov et al., Reference Špakov, Istance, Hyrskykari, Siirtola and Räihä2019, for a similar approach).
Following this automatic procedure, the output of the software was visually inspected by members of the research team to assess the quality of the resulting data. Trials (texts) where fixations were erroneously assigned to lines (typically due to poor calibration) were deemed unusable and were removed from the analysis. Then, participants who had less than five usable trials (out of 12) were removed from the analysis altogether. The percent of passages and the number of word tokens (interest areas) retained after data cleaning in each sample can be found in Table 1. Note that in the current release of the database we only report data from usable participants and trials, as determined by the current version of popEye, which includes approximately 70% of the complete data. This level is at the upper limit that can be achieved by any automated algorithm using the present setup (see Carr et al., Reference Carr, Pescuma, Furlan, Ktori and Crepaldi2021, for a comparison of different line assignment methods). However, future releases of MECO (in both L1 and L2) may use improved algorithms and thus supplement the current samples with data from some of the trials or participants that are presently removed.
For the following analyses, we additionally removed data points that showed very short (< 80 ms) first fixations that are unlikely to provide sufficient time to complete visual uptake (see Warren et al., Reference Warren, White and Reichle2009) or very long total fixation times (top 1% of the participant-specific distribution, all exceeding 3 s on the word). Off-screen looks were incorporated in the passage-level variables (e.g., reading rate) but not in the word-level eye-tracking variables (see details on variables used in the following text).
Data availability
The MECO project is committed to principles of Open Science. The current release of L2 data includes full interest-area reports from usable participants and trials, as well as full data from individual differences tests in L2, the nonverbal IQ test, and the background questionnaire. We also provide datasets containing passage and sentence-level summaries, broken down by participant. The analysis code used in the “Results” section is also provided. Please refer to the project’s repository page at https://osf.io/q9h43/ for the full materials, code, and data. As mentioned already, the same participants also participated in the L1 portion of the project (and in the Canadian sample, an additional portion of English reading). Therefore, participants who had usable data in both L1 and L2 can be selected to examine the relationship between L1 and L2 reading behavior (see Analysis 3). The full release of the L1 data from the same samples of participants (with both eye-tracking and L1 individual differences measures) is available in a separate repository: https://osf.io/3527a/ (see Siegelman et al., Reference Siegelman, Schroeder, Acartürk, Ahn, Alexeeva, Amenta, Bertram, Bonandrini, Brysbaert, Chernova, Da Fonseca, Dirix, Duyck, Fella, Frost, Gattei, Kalaitzi, Kwon, Lõo and Kuperman2022, for detailed description). The same participant codes are used in both repositories.
Reading variables
Reading proficiency has at least two facets: fluency and comprehension. Eye-tracking enables multivariate characterization of fluency, with variables highlighting different stages of the time course of reading, as well as the overall cognitive effort at the word, sentence, or passage level. In the following text we consider a number of basic oculomotor variables as measures of reading fluency (both in L1 and L2). Note that the output of the popEye software includes several additional variables not discussed here, including fixation locations and further information at the sentence and passage levels. The word-level variables used here include skipping (a binary index of whether the word was fixated upon at least once during the entire text reading, labeled as skip).Footnote 5 For words that were fixated at least once, the following variables were defined: first fixation duration (the duration of the first fixation landing on the word, firstfix.dur); gaze duration (the summed duration of fixations on the word in the first pass, i.e., before the gaze leaves it for the first time, firstrun.dur); total fixation duration (the summed duration of all fixations on the word, dur); number of fixations on the word (nfix); refixation (a binary index of whether a word elicited more than one fixation in the first pass, refix); regression-in (a binary index of whether the gaze returned to the word after inspecting further textual material, i.e., to the right of the word in left-to-right orthographies, reg.in); and rereading (a binary index of whether the word elicited fixations after the first pass, i.e., after the gaze left the word for the first time, reread). See Inhoff and Radach (Reference Inhoff, Radach and Underwood1998), Rayner (Reference Rayner1998), and Godfroid (Reference Godfroid2020) for a detailed discussion of these variables. At the participant level, the following measures of fluency were defined: reading rate (in words per minute, rate), and mean word-level variables (e.g., participant’s mean skipping rate, mean first fixation duration). Finally, we gauged comprehension accuracy as percent of correct responses to all 24 questions (acc).
Additionally, we used scores from the CFT test of nonverbal intelligence (cft), and the following measures from the individual differences battery of tests: spelling (spelling), vocabulary knowledge (vocabulary), motivation (motivation), LexTALE (lextale), Sight Word Efficiency (towre: swe), and Phonemic Decoding Efficiency (towre: pde; see details regarding the scoring of individual differences tests in Supplementary Materials S2). Finally, in terms of independent variables, Analysis 3 uses an additional set of dummy-coded variables coding the differences between the 11 L2 samples (see description in the following text).
Results and discussion
This section reports the three analyses motivated in the “Introduction” section. First, we estimate the reliability of both eye-tracking and individual differences tests (Analysis 1). Next, we provide descriptive statistics of the collected data and a correlation analysis of the relationships between measures of reading behavior and component skills of L2 reading (Analysis 2). Third, we present an analysis examining what parts of the variance in L2 reading fluency and comprehension are explained by measures related to L1 reading proficiency, L2 knowledge, and the cross-sample variability (Analysis 3).
Analysis 1. Reliability estimates
Reliability is a crucial element in correlational analyses because a variable cannot correlate with other variables more than it correlates with itself. This is particularly important for variables that have low correlations with other variables, as these could be due to the low reliability of the measures used. The reliability of the eye-tracking data was estimated in two ways. The first was a participant-level reliability, which examines the extent to which each eye-tracking measure provides a stable measure of individual differences in each sample. For most variables, this was done using a split-half procedure, calculated separately for each sample, where we examined the correlation between mean values for “odd” and “even” words within a participant. Thus, for example, to compute the split-half reliability of total fixation duration in a given sample, we first computed for each participant their mean total fixation durations for “odd” and “even” words (i.e., mean duration for words 1, 3, 5 … and for words 2, 4, 6 …). Then, we examined the correlation between these values across the N participants in each sample. The only exception was the estimation of participant-level reliability for reading rate, which was examined using an Intra-class Correlation Coefficient (ICC), which estimates the degree of agreement in reading rate estimates across the 12 texts. The second type of reliability estimated for each eye-tracking measure focused on the word token level (i.e., the level of individual word occurrences). This was done by examining the correlation between means for “odd” and “even” participants within each word token, for each language and eye-tracking measure. To exemplify, for total fixation duration, we computed the mean duration for each word token across “odd” and “even” participants (i.e., mean duration for each word token in subjects 1, 3, 5 … and subjects 2, 4, 6 …), and correlated these two sets of values. This metric represents reliability values relevant for word-level investigations (i.e., effects of length or frequency of words, which are not reported here but can be done in future investigations using MECO L2 data).Footnote 6 Supplementary Materials S4 and S5 provide a full report of the two types of reliability estimates (i.e., participant level and word token level).
In sum, these analyses demonstrate very high reliability of eye-tracking measures at the participant level (all Spearman–Brown corrected reliability estimates > 0.94). This suggests that the eye-movement measures collected are sensitive to interindividual variability in English proficiency (see also Staub, Reference Staub2021). Reliability at the word token level was somewhat lower but was still moderate to high for most measures and samples with all mean corrected-r’s > 0.6 (for comparable reliability levels, see Cop et al., Reference Cop, Dirix, Drieghe and Duyck2017). Interestingly, word-level reliability was generally lower in the L1 sample (Canada) than in the L2 samples, suggesting that L1 readers show less meaningful interword variation than L2 readers do. In fact, if the (smallest) Turkish sample and the L1 Canadian sample are excluded, mean r’s in all samples were in the acceptable-to-high range of reliability, that is, ≥0.72. The reliability estimates were generally in line with the values reported for the L1 portion of MECO (Siegelman et al., Reference Siegelman, Schroeder, Acartürk, Ahn, Alexeeva, Amenta, Bertram, Bonandrini, Brysbaert, Chernova, Da Fonseca, Dirix, Duyck, Fella, Frost, Gattei, Kalaitzi, Kwon, Lõo and Kuperman2022).
In addition to eye-movement measures, we calculated the reliability for scores in skill tests, including CFT scores, comprehension accuracy (in the passage reading task), and the battery of individual-differences tests (spelling, vocabulary, and motivation).Footnote 7 For comprehension, spelling, and motivation we calculated both split-half reliability as well as Cronbach’s alpha. For the vocabulary knowledge task, we only calculated split-half because of the adaptive nature of this task, which means that different participants have data from different trials (see design details in Supplementary Materials S2). Note that reliability estimates were calculated on the aggregated dataset (not broken down by L1). This is because we did not expect procedural differences (e.g., type of eye-tracker, screen size, research team) to have an impact on the data quality in these tests. The estimates are provided in Supplementary Materials S6. Reliability estimates for spelling, motivation, and comprehension accuracy were reasonable, with corrected split-half values between 0.66 and 0.78 and Cronbach’s alpha of 0.64–0.75. The reliability of the vocabulary knowledge task was somewhat lower, with a corrected split-half estimate of 0.61. Further inspection of the data, however, revealed that this lower reliability was related to performance on the items representing less frequent words—possibly due to fatigue or increasing complexity (i.e., harder items being less discriminative in our L2 sample). To improve reliability for this test we calculated a modified measure based on the number of correct responses in word groups 2–5 (corresponding to the 2,000–5,000 frequency band), which indeed had a higher corrected split-half reliability of 0.74. Therefore, in the following analysis we use this modified measure, but in the project’s repository we provide both measures for further comparison in future work (as each of these measures may be differentially informative in certain participants; e.g., the full vocabulary scores may be more useful in detecting variability among the L1 readers in the Canadian site who have close-to-ceiling scores in the modified measure, see descriptive statistics in the following text). In sum, MECO L2 data on reading fluency and comprehension, as well as the test scores in component skills of English reading, show acceptable to high levels of reliability, making the data eligible for a meaningful inferential treatment.
Analysis 2. Descriptive and correlation analyses
Cross-sample variability
To provide descriptive statistics across samples, we first calculated mean values of each eye-tracking variable for each participant. Based on these values, we calculated the means and standard errors for all dependent variables by sample, both for the measures from the eye-tracking task, that is, eye movements and comprehension accuracy (Figure 2) and for the individual differences tests (Figure 3). Here we depict sample means, but in the project’s repository we provide detailed data summaries, including a breakdown of each eye-tracking variable by sample.

Figure 2. Means of measures from the eye-tracking task across samples. Error bars stand for ± 1 SE. accuracy: percent answers correct; acc: comprehension accuracy; dur: total fixation time; firstfix.dur: first fixation duration; firstrun.dur: gaze duration; nfix: number of fixations; rate: reading rate; refix: likelihood of second fixation on the word; reg.in: regression rate; reread: likelihood of second pass; skip: skipping rate; du: Dutch; ee: Estonian; en: English; fi: Finnish; ge: German; gr: Greek; he: Hebrew; it: Italian; no: Norwegian; ru: Russian; sp: Spanish; tr: Turkish. See online version for color figures.

Figure 3. Means of measures of individual differences of English proficiency across samples. Error bars stand for ± 1 SE. cft: score in the CFT test; towre: pde: TOWRE, Phonemic Decoding Efficiency subtest (pseudoword naming); towre: swe: TOWRE, Sight Word Efficiency subtest (word naming); vocabulary: vocabulary knowledge (Groups 2–5); du: Dutch; ee: Estonian; en: English; fi: Finnish; ge: German; gr: Greek; he: Hebrew; it: Italian; no: Norwegian; ru: Russian; sp: Spanish; tr: Turkish. See online version for color figures.
Visual inspection of Figure 2 points to substantial variability in the L2 reading behavior across samples and across measures. First, a cross-sample comparison of reading comprehension shows a relatively uniform picture: reading comprehension accuracy (panel acc) is similarly high for 9 out of 12 samples. That is, eight L2 samples are generally on par with (and, in the case of Estonian, even slightly higher than) the comprehension score of L1 speakers in the Canadian sample. Only Greek, Norwegian, and Turkish samples show lower levels of English comprehension. It is worth noting that this apparent equality is not due to a ceiling effect because in the best-performing samples, average comprehension accuracy fluctuates around 75–80%.
Second, L1 English estimates of oculomotor measures of fluency stand apart from L2 reading by showing a faster reading rate, shorter fixations, a higher skipping rate, and a lower likelihood of refixations or rereading. Also, there is a great deal of variability across L2 samples. A cursory inspection of the patterns in Figure 2 suggests that behavioral similarities and differences between samples do not directly map onto the linguistic distance between English and respective L1s. To give one example, the two L2 samples that most closely approximate L1 reading behavior are Finnish and Dutch readers of English. This is even though Finnish is distant from English in its origin, structure, and word-stock, while Dutch is closely related to English both historically and typologically, and both are more orthographically transparent than English. We did not observe a systematic penalty in performance for non-Roman-based alphabets either, for example, the Russian sample showed high accuracy, and the mid-range of durations and reading rate compared to the samples representing the Roman alphabet. An in-depth investigation of linguistic distance as a predictor of behavioral similarity in reading text is a topic for a separate study. Here, we confine ourselves to noting that linguistic properties of L1 cannot be the only factor determining oculomotor behavior in L2 (see also a direct investigation of the impact of L1 on various L2 dependent variables in the following text).
Figure 3 displays very considerable cross-sample variability in performance on component skills of English reading proficiency (spelling, word and pseudoword reading, vocabulary knowledge, and LexTALE). The English L1 sample demonstrated a higher performance than L2 samples in all verbal component skills. Another expected finding was the absence of an advantage in nonverbal intelligence (gauged by CFT-20) and motivation to perform the task (as there is no a priori reason for L1 speakers to differ in these dimensions from students in other samples).
The observed variability in skills leads to an intriguing question. Can we trace back individual differences in online L2 reading behavior fully to individual differences in L2 component skills, or does a participants’ L1 have a unique systematic effect on eye-movement measures in L2 over and above the influence of the L2 component skills? We return to this question in Analysis 3.
Next, we examined the correlations between the eye-movement variables and measures of individual differences on the aggregated data set of participants from all samples (n = 543). The correlation matrix, shown in Table 3, reports numerous significant correlations (p < 0.05) between the eye-movement variables, comprehension accuracy, and the measures of English component skills, as well as significant correlations within these groups of variables. A few noteworthy findings are reported in the following text.
Table 3. Correlation table for reading measures (data aggregated across samples, N = 543). Values above the diagonal show Pearson correlation coefficients; values below the diagonal show p values (p-value shown as 0 stands for p < .001), and significant correlations (p < .05) appear in bold text.

Notes: skip: skipping rate; nfix: number of fixations; dur: total fixation time; reg.in: regression rate; firstfix.dur: first fixation duration; firstrun.fix: gaze duration; refix: likelihood of second fixation on the word; reread: likelihood of second pass; rate: reading rate; acc: comprehension accuracy; cft: score in the CFT test; towre: pde: TOWRE, Phonemic Decoding Efficiency subtest (pseudoword naming); towre: swe: TOWRE, Sight Word Efficiency subtest (word naming); vocabulary: vocabulary knowledge (Groups 2–5).
Many eye-movement variables were correlated to one another, which is not surprising given their operationalization (e.g., total reading time contains gaze duration, and both these measures contain first fixation duration). Reading rate displayed strong correlations with all other oculomotor measures (|r| between 0.38 and 0.87), indicating that it is an informative global, summative representation of reading fluency. There were also some significant correlations between comprehension accuracy in the reading task and the eye-movement measures of fluency registered during reading. However, these correlations were weak at best (|r| ≤ 0.28). Thus, our data did not reveal a strong link (either a positive correlation or a trade-off) between the fluency and comprehension facets of reading proficiency. This apparent absence of a trade-off is in line with previous observations of a small amount of shared variance between real-time measures of reading fluency and comprehension accuracy in L1 (Kuperman et al., Reference Kuperman, Matsuki and Van Dyke2018; Long & Freed, Reference Long and Freed2020; Siegelman et al., Reference Siegelman, Schroeder, Acartürk, Ahn, Alexeeva, Amenta, Bertram, Bonandrini, Brysbaert, Chernova, Da Fonseca, Dirix, Duyck, Fella, Frost, Gattei, Kalaitzi, Kwon, Lõo and Kuperman2022).
As for correlations between measures from the eye-tracking task and other tests of individual differences, readers with better scores in virtually any English reading component skill (e.g., spelling, vocabulary, or decoding) were characterized by higher skipping rates, a smaller number of fixations, shorter fixation times, a lesser amount of rereading, and faster reading rates. These measures of component skills were also correlated with comprehension accuracy, which showed the strongest positive correlation with measures of vocabulary (the vocabulary knowledge test and LexTALE) and spelling. The findings corroborate the long-standing notion that the individual variability in component skills of English reading plays a role both in L1 and L2 readers (see meta-analyses in the preceding text and reviews by Radach & Kennedy, Reference Radach and Kennedy2013; Rayner et al., Reference Rayner, Pollatsek, Ashby and Clifton2012). This variability affects both the millisecond scale of unfolding reading behavior and the global outcomes of passage comprehension. Quantification of the contribution that English language knowledge makes to variance in various L2 measures is reported in Analysis 3.
In contrast, scores on the CFT test were not significantly correlated with either the L2 component skills, comprehension accuracy, or the oculomotor variables. Partly, this may have been because of the mediocre reliability of the CFT measure in the current university student population (r = 0.57, after Spearman–Brown correction, see Siegelman et al., Reference Siegelman, Schroeder, Acartürk, Ahn, Alexeeva, Amenta, Bertram, Bonandrini, Brysbaert, Chernova, Da Fonseca, Dirix, Duyck, Fella, Frost, Gattei, Kalaitzi, Kwon, Lõo and Kuperman2022). Motivation scores showed limited correlations with oculomotor variables (e.g., positive but insignificant correlation of r = 0.08, p = 0.079, with reading rate). Thus, not only did these measures of general cognitive ability and readiness for the task fail to vary across samples but also they failed to differentiate between individual patterns of reading behavior.
In sum, descriptive and correlational patterns of Analysis 2 quantify variability across samples and participants, making possible comparisons with prior research and further analyses targeting latent variables underlying the observed data structure.
Analysis 3: What explains L2 reading behavior
This section returns to the second goal of this study, to examine the roles of multiple proposed factors of influence in explaining variance in both fluency and comprehension accuracy for speakers of English as an L2. Specifically, we examine relative contributions of L1 proficiency, L2 knowledge, extralinguistic parameters (domain-general IQ and motivation), and L1 background. Note that for the purpose of the following analysis, we only use data from the 11 L2 samples (i.e., excluding the Canadian sample). Before presenting the analyses, we briefly recap how each factor was operationalized.
L1 proficiency
As noted already, in MECO, all participants from countries in which English is not the dominant language completed passage reading tasks (with eye-tracking and comprehension questions) both in their L1 and L2 reading. This data availability enables us to directly assess the effect of L1 behavior on L2 behavior within participants. We opted for the most direct mapping of L1 and L2 behavioral measures of reading fluency and comprehension, examining the relation between L1 and L2 reading behavior using the same measure. Thus, in an analysis of variance of, for example, L2 reading rate, we represented the effect of L1 reading proficiency as the effect of L1 reading rate.
It is important to realize that a simple correlation between raw values of eye-movement measures in L1 and L2 may be misleading. Consider, for example, reading rate in L1 (words per minute). This measure is impacted not only by individual variability, but also by how a writing system disperses information across words in print (Brysbaert, Reference Brysbaert2019; Liversedge et al., Reference Liversedge, Drieghe, Li, Yan, Bai and Hyönä2016). For instance, Finnish and Turkish words tend to be long because of their agglutinative and rich morphological system, while Hebrew printed words tend to be short because of the partial representation of the language’s sounds (mostly, consonants) in its orthography. This discrepancy between writing systems may skew the estimation of the correlations of L1 and L2 eye-movement measures. To control for this factor, we first standardized (z-transformed) all oculomotor measures within each L1, and then correlated this scaled L1 variable with the corresponding L2 variable. Because L2 is constant in all samples, it was not standardized within each sample.
L2 knowledge
Prior literature reports this factor as the strongest predictor of L2 reading comprehension, as noted in the “Introduction” section. MECO L2 represents this factor through scores in the tests of vocabulary (vocabulary knowledge and LexTALE), spelling, pseudoword decoding, and sight word efficiency.
Extralinguistic factors
These factors were represented by scores in the tests of participants’ motivation to perform well in the experiment and nonverbal IQ.
L1 background
MECO L2 includes a broad selection of native languages and writing systems (see Table 1). Still, we deliberately opted out of directly testing the impact of L1–L2 language or script distance on L2 reading proficiency (see the “General Discussion” section for details). Instead, we considered differences in the distance between L1 and L2 as only one of the components reflecting cross-sample variability. Specifically, we used dummy-coded categorical variables that coded the differences between L2 samples (i.e., 10 variables reflecting the contrast between the 11 L2 samples). The impact of this set of 10 variables together estimated how much variance is explained by differences across the nonnative language backgrounds. The impact of this variable set on L2 reading comprehension or fluency, if any, will encompass the proposed role of the L1–L2 distance in L2 reading behavior, among other factors related to cross-sample variability.
Samples
We note that the sample size for participants with valid data from both L1 and L2 is smaller than for L2 (or L1) separately. This is because data cleaning procedures were applied separately to the two portions of the study. Table 1 reports the number of participants per site with data that passed quality controls in both L1 and L2 (or, in the case of the Canadian sample, in both eye-tracking tasks). Overall, there were n = 447 subjects with valid eye-tracking data from both tasks, from which n = 412 were L2 readers of English (i.e., excluding the Canadian sample).
We now proceed to analyses that rely on data from these n = 412 participants representing 11 different L1 backgrounds (excluding English-speaking controls). We report an implementation of two methods of partitioning variance in L2 reading fluency and comprehension. Both methods answer the same overarching question: What are the relative contributions of the individual- and group-level factors proposed in the bilingualism literature for L2 reading? We remind the reader that these analyses are confined to advanced readers of English and thus the following findings may not generalize over less advanced levels of English L2 proficiency.
Stepwise partitioning of variance
This analysis partitions variance in L2 reading fluency (based on the eye-movement record) and reading comprehension (based on the accuracy of responses to comprehension questions) between L1 reading proficiency, L2 language knowledge, and group differences between samples (i.e., participants’ native language). This method relied on comparing the percent of variance explained across a series of linear regression models. In each series of regression models, the dependent variable was one of the outcome variables—either one of the eye-movement measures or comprehension accuracy—represented as the mean value for each participant. A series of successive models were fitted to each dependent variable, adding a group of predictors at each step, to examine the additional amount of variance explained by those predictors. In this stepwise analysis, we gave priority to the L1 variables. We followed up with an analysis that does not give such priority (see the following text).
At Step 1, we added the variable from the L1 reading task that corresponded to the dependent variable (e.g., if the dependent variable in the model series was L2 skipping rate, the variable added at the first step was skipping rate in L1). As mentioned previously, to maintain cross-sample comparability, L1 eye-movement measures were scaled within each sample. At Step 2, participant test scores of L2 component skills were added. These included vocabulary knowledge, spelling, decoding and sight word efficiency, and LexTALE scores. Because extralinguistic skills (nonverbal intelligence and motivation) did not show strong correlations with any behavioral measures (see Table 3), we included them in the same Step 2 as the L2 component skills. Step 3 added to the regression models the set of dummy-coded variables that accounted for differences across samples (i.e., the differences between the 11 L2 samples). We estimate the increase in the amount of variance explained at each step compared to the previous step. The results of this partitioning of variance are depicted in Figure 4. To exemplify the procedure in more details, in the Supplementary Materials S7 we provide full model outputs for Steps 1–3 for two representative dependent variables.
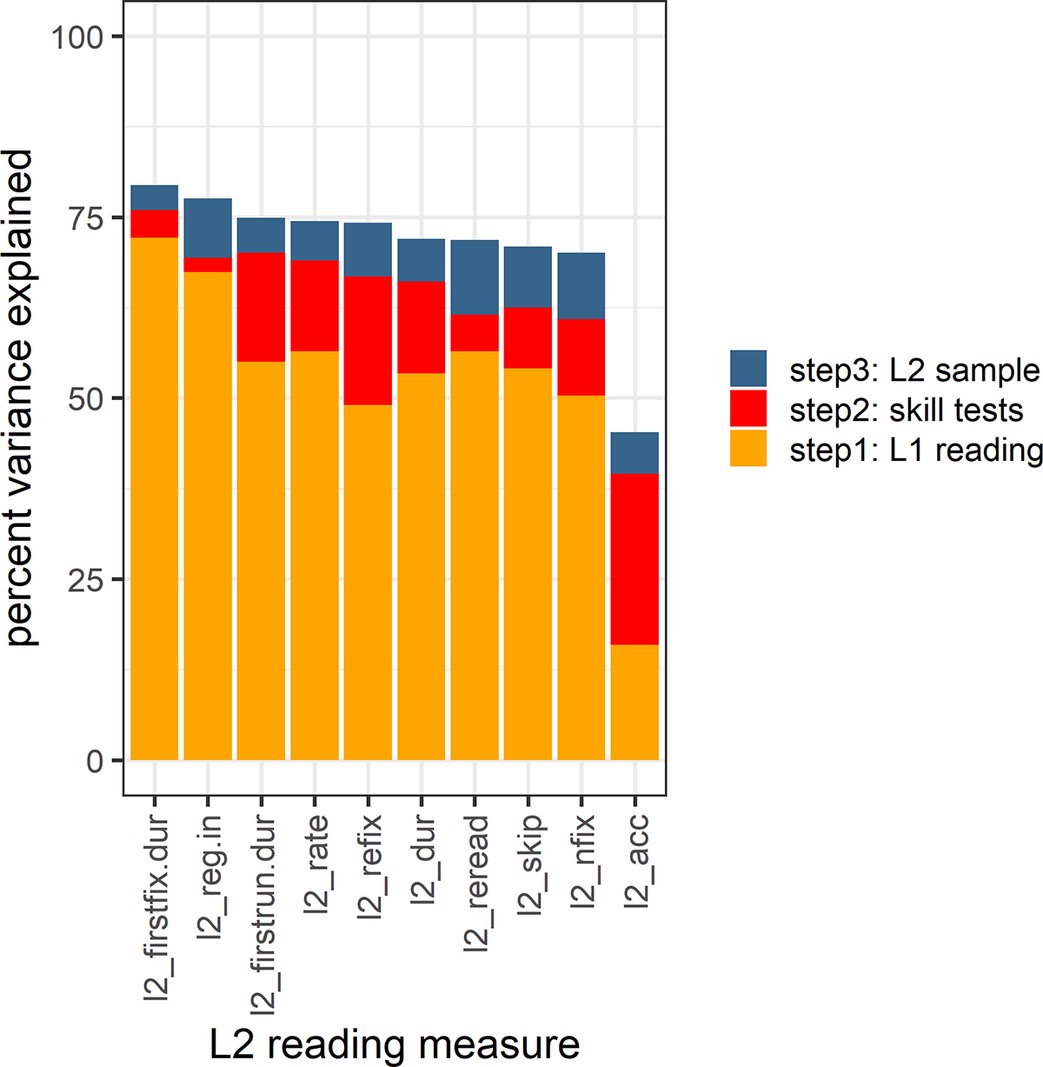
Figure 4. Stepwise partitioning of variance in L2 fluency and comprehension: Step 1: Relative contribution of L1 reading proficiency (i.e., corresponding L1 variable); Step 2: component skills of L2 reading and extralinguistic factors; and Step 3: cross-sample variability in L2 sites. acc: comprehension accuracy; dur: total fixation time; firstfix.dur: first fixation duration; firstrun.dur: gaze duration; nfix: number of fixations; rate: reading rate; refix: likelihood of second fixation on the word; reg.in: regression rate; reread: likelihood of second pass; skip: skipping rate. See online version for color figures.
We begin with a discussion of oculomotor measures of L2 fluency (all but the rightmost bar in Figure 4). Across all measures of L2 reading fluency, the amount of variance explained (reflected in the height of each bar) was very high, between 70% and 79% of total variance. Thus, even though MECO did not fully cover all possible L2 component skills, the amount of unexplained variance in reading fluency is much lower than prior reading comprehension studies suggest (about 50% of total explained variance in Bernhardt’s Reference Bernhardt2011 meta-analysis). Importantly, the great majority of explained variance stemmed from L1 behavior: in all oculomotor measures, L1 reading accounted for between 49% and 72% of the total variance (which amounted to at least 66% of the variance explained by all factors). A sizable but much smaller amount of variance was attributed to L2 knowledge. It was very uneven across dependent variables and explained between 2% and 18%. Variability between L2 samples at Step 3 explained small (but consistent) amounts of variance, between 3% and 10%. We speculate that part of this variance may stem from the different L1–L2 distances, and part from differences in the amount and quality of English language education in specific countries and institutions. We return to this issue in the “General Discussion” section. Again, these patterns were observed in advanced L2 readers of English: lower levels of L2 reading proficiency may show different contributions from known sources of variance.
To further illustrate the relative impact of these multiple factors on L2 fluency, we focus on analyzing L2 reading rate as a dependent variable (given its role as a global measure of reading fluency as noted previously). Together, all predictors explained 74% of the variance in L2 reading rate as follows: 56% of the variance in L2 reading rate was attributed to the participants’ L1 reading rate, an additional 13% to individual variability in component skills of L2 reading (as well as motivation and nonverbal intelligence), and 5% to variability between L2 samples. Note that L1 reading rate carried the greatest relative impact on L2 reading rate, which again exemplifies the strong link between L1 and L2 reading fluency. To further depict this link, Figure 5 demonstrates a scatterplot of L2 versus L1 reading rate after standardization (r = 0.75, p < .001; 95% CI: [0.71, 0.79]). To reiterate, this strong correlation means that more than half of the variance in L2 reading rates of nonnative readers of English (56.4%; 95% CI: [49.8%, 62.4%]) is predicted by reading rate in their native language.

Figure 5. Correlation between reading rate in L1 (scaled within samples) and L2, among L2 readers of English, N = 412.
In contrast to the oculomotor measures of fluency just discussed, partitioning of variance in reading comprehension accuracy (the rightmost bar in Figure 4) drew a different picture, in two respects. First, the total amount of variance explained was lower, estimated at 45%. This was due in part to the lower reliability of comprehension accuracy compared to the eye-movement measures (see preceding text and Supplementary Materials S6). Importantly, however, the relative partitioning of variance was also substantially different in comprehension accuracy compared to the fluency measures. Thus, only 16% of variance in L2 comprehension accuracy could be attributed to L1 comprehension accuracy, while 23% was related to mastery of English component skills (and IQ/motivation). Both the relative advantage of L2 knowledge over L1 proficiency and the absolute amount of variance explained are in line with prior reports: Bernhardt’s (Reference Bernhardt2011) meta-analysis that estimated the total amount of explained variance at about 50%, with 20% coming from L1 proficiency and 30% from L2 knowledge. An important addition to the existing body of knowledge on L2 reading comprehension is the estimated contribution of the between-sample variability (added R2 = 6%) that includes, among other parameters, the L1–L2 distance.
Unique and shared variance
Results of the stepwise procedure mentioned previously are contingent on a specific order in which steps were added to the regression models. To ensure that the results are not mere artifacts of possible arbitrariness in this decision, we conducted an additional analysis that specified amounts of unique versus shared variance for all groups of predictors. In this analysis, a series of regression models were fitted to the same set of dependent variables as previous. This time, we started by fitting a model that includes all factors as predictors for each dependent variable. Then, we examined the unique variance explained by each factor. We did so for each factor by comparing a full model with a model that included all factors except the factor of interest. The difference in the amounts of variance explained by these two models reflects the unique variance attributed to the factor of interest. Thus, for example, to establish the unique amount of variance explained in L2 skipping rate by L1 skipping, we calculated a difference in amounts of variance explained by the full model (with all factors included) and a model including all factors except the L1 skipping rate. Lastly, we defined the shared variance as variance that is jointly explained by more than one factor (i.e., not unique for any factor). The shared variance was estimated by subtracting amounts of unique variance explained by all individual factors from the total amount of variance explained by the full model. The results of this partitioning of variance are depicted in Figure 6. Again, to further clarify the procedure, we provide detailed model outputs for two dependent variables in the Supplementary Materials (S8).

Figure 6. Alternative partitioning of variance in L2 fluency and comprehension. L1 reading: unique contribution of L1 reading skill (i.e., corresponding L1 variable); skill tests: component skills of L2 reading and extralinguistic factors; L2 sample: cross-sample variability in L2 sites; shared: portions of variance explained by more than one variable; acc: comprehension accuracy; dur: total fixation time; firstfix.dur: first fixation duration; firstrun.dur: gaze duration; nfix: number of fixations; rate: reading rate; refix: likelihood of second fixation on the word; reg.in: regression rate; reread: likelihood of second pass; skip: skipping rate. See online version for color figures.
Because this analysis is simply a different way of partitioning variance than the stepwise procedure mentioned previously, the total amounts of variance explained remained the same as in the previous analysis (bar heights in Figure 6 are the same as in Figure 4). Importantly, even with shared variance separated out, the explanatory power of L1 reading fluency in predicting L2 reading fluency is salient in the joint sample of advanced L2 readers of English. Across the different oculomotor measures of L2 reading, the corresponding L1 variable uniquely explains between 33% and 65% of the total variance (or between 44% and 82% of all explained variance). On the contrary, the unique contribution of L1 comprehension accuracy to explaining variance in L2 comprehension accuracy was only 6%, while that of L2 component skills was 17%. This finding further supports the dominant role of L2 skills in L2 comprehension accuracy and the dissociation between those skills and the identified factors that determine fluency measures (i.e., eye-movement measures) and comprehension. The contribution of L2 cross-sample differences remained largely the same as reported previously (with unique contributions varying between 3% and 10%). We elaborate on the implications of these findings in the “General Discussion” section.
An additional analysis of interest would include the various eye-tracking measures of L2 reading fluency as predictors of L2 reading comprehension. Yet, correlations between comprehension accuracy and eye-tracking measures of L2 fluency were all smaller than |0.28|, suggesting that their unique predictive value would be small. To confirm this prediction, we ran an analysis examining the unique variance in L2 comprehension associated with the eye-tracking measures of L2 reading fluency (i.e., variance explained by measures of L2 reading fluency when added together to a model predicting L2 comprehension, beyond the predictors already included in Figures 4 and 6). Indeed, the L2 fluency measures only had a small (and statistically insignificant) added predictive value: ΔR2 = 0.9%.
General discussion
This article adds to the body of theoretical knowledge of research in L2 reading acquisition. The main empirical contribution is MECO, the Multilingual Eye-Movements Corpus, a collection of data on text reading fluency and comprehension in the reader’s L1 and English as L2, supplemented by a demographic and language background questionnaire and a selection of tests of component skills of reading in English. Here we present and analyze data on English reading and related skills from 12 samples of participants (N = 543) representing a wide range of L1s. As such, MECO L2 presents an important contribution that meets the increasing demand for high-quality cross-linguistic data that uses naturalistic tasks with reliable and nonintrusive experimental paradigms. It also provides a systematic coverage of individual variability in component skills of reading while considering the amount and nature of exposure to L1 and L2. MECO’s data come from samples of 18–30-year-old university students (with very few exceptions of older individuals), who are either highly proficient L2 readers of English or L1 English-speaking controls. Thus, MECO L2 narrows down the age range, educational status, and—to a degree—the range of English proficiency to assure a certain level of homogeneity across participants. These features, along with the availability of within-participants L1 and L2 reading data, make MECO an unparalleled resource for comparative analyses across languages and scripts and across L1 and L2 reading.
Our first goal was to introduce the design, implementation, and data of MECO L2, as well as illustrate the reliability of the data and quantify variability and tendencies within and across participant samples. The “Methods” section outlined the technical specification of the corpus. Analysis 1 demonstrated high reliability of the oculomotor measures used as estimates of L2 fluency. It also reported acceptable-to-high reliability of tests of L2 comprehension, and additional measures assessing L2 component skills and extralinguistic factors. Thus, MECO L2 data are sufficiently sensitive to detect word-token level variation (in the eye-movement data) as well as individual differences (in both the eye-movement data and accompanying tests). Analysis 2 reported descriptive and correlational summaries of the MECO L2 data and uncovered several expected findings (e.g., greater fluency and higher test scores in L1 vs. L2 readers of English; strong correlations between L2 component skills of reading and measures of L2 fluency and comprehension). It also highlighted several results that informed Analysis 3 (see following text) and will require further investigation (see “Future Directions” section).
While MECO L2 data can support a variety of analyses (see following suggestions) addressing a wide range of theoretically interesting research questions, this article focuses on one basic question that often arises in L2 research: What factors predict L2 reading proficiency and its facets: reading fluency and reading comprehension? These findings constitute the central theoretical contribution of this article, and we discuss them one at a time.
The dissociations between reading fluency and reading comprehension
Already in the descriptive statistics (Analysis 2), we found a drastic difference between L2 reading fluency (gauged using eye movements) and L2 reading comprehension (measured by accuracy in comprehension questions) among advanced L2 readers of English in at least three aspects. First, correlations between comprehension accuracy and all eye-movement measures in MECO L2 data were weak at best (|r| ≤ 0.28). Second, all eye-movement measures showed a substantial variability between samples of participants, with the L1 sample demonstrating higher reading fluency compared to all L2 samples (shorter and fewer fixations, fewer skips and regressions, and a higher reading rate). Conversely, comprehension accuracy at the group (sample) level was very similar among English L1 readers and most L2 samples (8 out of 11).
A third and critical difference between L2 reading fluency and comprehension was evident in our partitioning of variance analysis (Analysis 3). Notably, we found that the relative contributions of specific groups of predictors differed between fluency measures and comprehension accuracy. Thus, the role of L1 comprehension was relatively minor in predicting L2 comprehension; and most of the explained variance came from L2 knowledge. Our estimates were very close to those provided by prior meta-analyses (e.g., Bernhardt, Reference Bernhardt2011, i.e., roughly 50% of variance explained in total, with 20% stemming from L1 proficiency and 30% from L2 component skills; see “Introduction” section). Conversely, measures of L1 fluency explained the majority of the variance in respective measures of L2 fluency, while contributions of other predictor groups, including L2 knowledge, were much smaller. Another discrepancy was that the total amount of variance explained by all predictors in reading fluency measures (70%–79%) was much higher than in comprehension accuracy (45%). This discrepancy may stem from a greater measurement error in accuracy compared to fluency (see reliability estimates in the preceding text), or from the existence of the additional (and as yet unaccounted for) sources of variance, which have a greater influence on L2 comprehension accuracy than on reading fluency. Future research needs to tackle both possibilities. It is also noteworthy that the present results characterize individuals’ that are advanced readers of English, and a specific range of intermediate-to-advanced text complexity. Lower levels of English proficiency or more complex texts may reveal the speed-accuracy trade-off in L2 reading.
To summarize the findings, we found that (a) an achievement of an L1-like level of reading comprehension is more common than reaching an L1 level of reading fluency, and (b) L2 comprehension relies on a different set of skills and abilities than L2 fluency, with a particularly strong demand for language skills in L2. We interpret (a) from a perspective that views both reading comprehension and fluency as facets of reading proficiency. A proficient reader is one who makes fast progress through a text but nevertheless understands and evaluates the content of the text. It is possible that if advanced L2 readers (like the ones used in the current study) read at a rate approximating that in the L1 group their comprehension quality will suffer. An intriguing possibility is that better comprehension at the expense of a slower pace is a typical strategy for L2 readers, more common than faster reading at the expense of comprehension quality. Such a strategy would be supported by the demands of the L2 use in an educational, workplace, or leisure setting, where the benefits of complete and accurate understanding of written material may outweigh the benefits of how fast it can be read. Further fine-grained analyses of motivations and incentives for prioritizing different facets of L2 reading proficiency will help shed light on this question. We suggest that future research pay equal attention to reading comprehension and fluency in L2 reading, which constitute empirically distinct reading proficiency facets, with different theoretical underpinnings and practical merits.
A consistent reading strategy
The finding of very strong correlations between corresponding eye-movement measures in L1 and L2 (e.g., L1 and L2 reading rate in Figure 5) across a large pool of bilingual participants with a high level of proficiency in English as L2 leads to a new hypothesis. We propose that individual readers maintain their reading strategy—a preferred pattern of allocating one’s attention over the text to achieve efficient and accurate text understanding—when reading in both their L1 and L2. Behavioral strategies described for L1 reading so far (e.g., Hyönä et al., Reference Hyönä, Lorch and Kaakinen2002) identify three distinct groups: individuals who prefer moving quickly through the text without looking back; individuals who tend to frequently look back to verify their understanding; and individuals who tend to skip more words but compensate for possible incomplete comprehension through reprocessing the read text more often. While this study does not pursue further analysis of specific strategies, it demonstrates—through very strong correlations in different kinds of eye-movement measures (fixation times, skips, regressions)—that readers appear to maintain their behavioral preferences across the languages in which they read. Moreover, this within-reader consistency of reading strategy for real-time text processing holds despite an expected contrast in an individual’s proficiency with L1 reading versus L2 reading. This finding complements earlier reports of within-participant consistency across tasks (Schilling et al., Reference Schilling, Rayner and Chumbley1998), time, and trials (Carter & Luke, Reference Carter and Luke2018). It also converges with the studies indicating within-participant commonalities in eye-movement patterns during reading and nonreading tasks (e.g., Henderson & Luke, Reference Henderson and Luke2014; Luke et al., Reference Luke, Henderson and Ferreira2015).
Partly, the consistent reading strategy may be due to an individual’s cognitive speed of information processing. Participants capable of a faster information uptake, processing, and response will show this advantage of speed in all mental tasks, including L1 and L2 reading. Cognitive speed may indeed explain L1–L2 correlations between temporal oculomotor measures both at the passage (reading rate) and word level (e.g., total fixation time). Yet cognitive speed alone is not sufficient to explain the strong role of L1 skipping, regression, and refixation likelihood in predicting respective non-chronometric parameters of reading behavior in L2. Future research will need to determine what other cognitive factors may underlie the similarity of L1–L2 reading behavior. It will also need to establish whether the similarity is as strong in less proficient L2 readers.
The impact of L1 background on L2 reading
As discussed in the “Introduction” section, theories of L2 reading acquisition deem the linguistic distance between L1 and L2 as an important moderator in the ease of acquiring L2 proficiency (e.g., Van der Slik, Reference Van der Slik2010 and meta-analyses by Jeon & Yamashita, Reference Jeon and Yamashita2014; Melby-Lervåg & Lervåg, Reference Melby-Lervåg and Lervåg2011). Despite the broad typological variability of languages and writing systems in MECO, we eschewed a direct test of the impact that the L1–L2 language or script distance may have on L2 reading proficiency. This is because the present version of MECO only has one sample of participants from a given language background. Therefore, in MECO data, there is no principled way to examine the performance of, say, a Spanish-speaking sample in reading English as L2 and to establish how much of this performance is determined by factors such as (a) the properties of the Spanish language per se (including its distance from English), (b) the requirements for English proficiency imposed by the specific institution where data were collected (Universidad Torcuato Di Tella), or (c) the quality of the English language education or education in general in this country (Argentina), among other factors. In other words, current MECO data conflate L1–L2 distance with factors related to where the data were collected. Only when multiple samples represent a given language or country will we be able to establish the specific impact of the L1 background (see “Limitations and Future Directions” section).
However, we note that Analysis 3 provides an estimate for a broader measure of cross-sample variability, which encompasses differences in how close different L2s are to English (as well as other cross-sample differences specific to each educational institution, country, and language). This variability had a relatively weak (but consistent) role in explaining variance in English L2 reading fluency and comprehension accuracy. In particular, cross-sample differences accounted for smaller amounts of the variance as compared to the impact of L1 reading skills on L2 fluency. Future research—including the updates planned for MECO—will indicate how much of this variance is of a linguistic nature, and how much can be ascribed to differences between samples.
Limitations and future directions
Although our analyses shed new light on the determinants of L2 fluency and comprehension, two limitations are noteworthy. The first is that the present analyses do not account for the amount and nature of exposure to L1 and L2 language, nor do they incorporate any demographic data. Relevant data on these variables can be extracted from our language background questionnaire that are made available for further studies. Second, the texts we have chosen are relatively short and simple for advanced L2 readers. More difficult texts may bring out differences between L1 and L2 samples in comprehension more clearly.
Beyond these specific limitations that have to do with our current analyses, we wish to note some current shortcomings—and prospective solutions—for the broader data resource project that we presented here (MECO). At present, MECO documents behaviors of highly proficient readers, not only in L1 but also in English as L2, given that all participants are enrolled in higher education. This focus on college/university students is desirable for comparability of samples across countries but the current findings may not generalize over broader populations in these countries. Furthermore, virtually all languages in our MECO L2 database are alphabetic (except the Hebrew abjad), in line with the well-described bias toward alphabetism in reading research (Share, Reference Share2014). In addition, current samples representing each language background are relatively small, especially when the L1 and L2 behaviors are compared. Finally, as mentioned, with one sample representing a specific educational institution, country, and language, researchers do not have a principled way of disentangling contributions of variability across different L1s and variability between nations and colleges.
The MECO project plans to address all these limitations through its planned expansion. This future expansion envisions additional data collection in the partner labs to enhance presently available data samples and the addition of both alphabetic and nonalphabetic writing systems. We will also invite further recruitment of samples from the languages already included in MECO from additional colleges/universities and other regional varieties of the language. Finally, the MECO project will expand into recruitment from community samples and nonuniversity postsecondary institutions (e.g., vocational schools and colleges), to broaden the spectrum of reading ability in our documentation and analyses. We expect the MECO project to be augmented through future waves of data collection to enable a larger set of analyses, and to increase their accuracy, compared to the present reports.
Concluding remarks
This article began with a bibliometric demonstration of exponential growth in the number of publications in the field of bilingualism and L2 acquisition (Figure 1). For this growth to translate into theoretical advances, it is important that it is coupled with a parallel expansion of the high-quality evidence base, enabling methodological unity, cross-study comparability, and broad coverage of languages. We believe that MECO L2 serves this empirical purpose and demonstrates the benefits of this new data source by providing novel theoretical insights into the nature of reading in L2.
Supplementary Materials
To view supplementary material for this article, please visit http://doi.org/10.1017/S0272263121000954.
Acknowledgments
We wish to thank the following individuals: Mariam Bekhet, Paige Cater, John Connolly, Melda Coskun Karadag, Connie Imbault, Alyssa Janes, Shani Kahta, Minji Kang, Evgenia-Peristera Kouki, Elizaveta Kuzmina, Nadia Lana, Sean McCarron, Victoria Ong, Anat Prior, Eva Saks, Elisabet Service, Anna Swain, Heather Wild, Sophia Yang, and Laoura Ziaka.
Funding statement
Research reported in this publication was supported by the following grants: the Social Sciences and Humanities Research Council of Canada Partnered Research Training Grant, 895-2016-1008 (PI: G. Libben); the Canada Research Chair (Tier 2; PI: V. Kuperman); the CFI Leaders Opportunity Fund (PI: V. Kuperman); Concerted research action BOF13/GOA/032 of Ghent University; FWO Project (PI: M. Brysbaert); ERC Advanced grant, project 692502-L2STAT (PI: R. Frost), Estonian Research Council Mobilitas Pluss postdoctoral researcher grant MOBJD408 (PI: K. Lõo), the Israel Science Foundation (ISF) grant 48/20 (PI: N. Siegelman), and Saint Petersburg State University grant ID 75288744, 121050600033-7 (PI: N. Slioussar). K. Nisbet’s work has been supported by the Ontario Graduate Scholarship.
Author contributions
The order of authors after the first three is alphabetical.


 Open access