


Introduction
The Mt. Kenya Expedition 1957–58, led by Dr. I. S. Loupekine, studied the glaciers of the mountain as a part of Kenya’s contribution to the I.G.Y. A reconnaissance was carried out in July 1957 to prepare for conduct of the main field programme during seven weeks in December 1957 and January 1958. Individual members of the Expedition have since periodically returned to the mountain to continue the work.
This article is intended to provide an indication of the results so far obtained.
This work formed part of the programme of the British National Committee for the I.G.Y. The Expedition is deeply indebted to all those who have given it their support, in particular to Professor Gordon Manley for his invaluable guidance and encouragement and to the Royal Society for the allocation of a grant.
General observations
Mt. Kenya is a heavily denuded volcano of the central type, the primary activity of which is believed by GregoryReference Gregory 1 to have ceased in late Tertiary times. Its present form is that of a convex dome about 90 km. in diameter, from near the centre of which rises a group of peaks, the two highest of which are Batian (5,199 m.) and Nelion (5,188 m.). The main summit level of the peaks is on a line 3 km. in length running from north-west to south-east. Seven principal valleys and a number of lesser ones proceed radially from the peak area, all displaying signs of former ice occupation to a level of about 3,500 m.
In the immediate vicinity of the peaks there are twelve small glaciers (Fig. 1), the tongue of the lowest of which descends to 4,480 m. The glaciers have a total plan area of 1.2 km.2. Seven are of the valley type and the remaining five are hanging glaciers. The Lewis Glacier, the largest, has a plan area of 0.36 km.2, and consists of two separately evolving portions (Fig. 6, p. 480) which, except in the upper firn, have little direct connexion. The Melhuish Glacier is of so vestigial a character as scarcely to merit its continued classification.

Fig. 1. The glaciers of Mt. Kenya. For photographs see p. 480–82
Stages of Recession
(a) Moraine Evidence
As hitherto observedReference Nilsson 2 , Reference Nilsson 3 , Reference Nilsson 4 there is evidence of two distinct periods of glacierization on Mt. Kenya. Moraines related to the earlier of these occur in the Gorges Valley as a thick sheet of locally indurated ground and terminal moraine with a lower margin at 3,440 m. Deposits from the earlier retreat appear everywhere to be largely obscured by those from the subsequent retreat. The latter deposits are in abundant evidence over an area of about 430 km.2, generally above 3,500 m. Their general chronology must await detailed morphological mapping, but in the immediate vicinity of the peak area it is possible to suggest a sequence for the most recent deposits.
-
(i) From 4,080 m. to 4,180 m. in the Höhnel, Teleki, Hausburg and Mackinder Valleys there occur terminal moraines, the appearance of which suggests an age of not more than a few hundred years. In the Höhnel, Hausburg and Mackinder Valleys there is an identical sequence of three evenly spaced moraines in a distance of one-half to three-quarters of a kilometre. In the Teleki Valley there is a single large moraine. In each case the drainage pattern is markedly less mature above the moraines than below them. In the Höhnel Valley these were the last moraines to be formed before the glacier’s final disappearance. In the other three cases the distance between the moraines and the present ice front is about 2 km.
-
(ii) From 4,270 m. to 4,420 m., situated from 500 m. to 800 m. from the present ice fronts. there occur large moraines which are identifiable with recent fluctuations of the existing glaciers. The moraines are often multiple in structure with two or more crests up to 50 m. apart. An advanced plant community, which includes mature groundsel (Senecio keniodendron, S. brassica) and lobelia (Lobelia telekii) and many kinds of moss and lichen, ends abruptly at the front of these moraines which themselves support little but lichen and the small yellow-flowered Senecio keniophylum. The latter surprisingly persists in the forefront of plant colonization to within 10 m. of the ice fronts. This sharp ecological discontinuity suggests either a halt in recession of at least a century or, more probably, a readvance. Fossil ice persists in moraine of this period at 4,660 m. below the Gregory Glacier and at 4,660 m. above the present snout of the Lewis Glacier.
-
(iii) Between the two groups of moraines described, there occur numerous intermediate deposits which give clear indications of the progress of retreat in historic times.
Study of moraine evidence has been greatly assisted by air photographs of the peak area and the Gorges and Teleki Valleys flown at a height of 6,100 m. for the Expedition by Hunting Aerosurveys Ltd. in January 1958.
(b) Documentary Evidence
Accounts by GregoryReference Gregory 5 , Reference Gregory 6 and MackinderReference Mackinder 7 between 1893 and 1899 show that the glaciers at that time were close to the inner side of the most recent large moraines. Gregory’s reference to the Lewis Glacier is particularly clear on this point and Mackinder’s map within the limit of its accuracy confirms the situation.
A photograph of the east-facing Cesar Glacier in 1908Reference Ross 8 and a description of it in 1919Reference Arthur 9 show that the glacier underwent no frontal retreat from the position of 1899 during this period. The tongue of the Cesar Glacier is at present about 250 m. within the 1899 moraine. Photographs of the west-facing Tyndall and Lewis Glaciers taken in 1926Reference Dutton 10 show retreat from the 1899 position of about 120 m. and 200 m. respectively.
Precise measurements of the front of the Lewis Glacier prior to 1958 were made in 1934,Reference Troll and Wien 11 in 1947 (when air photographs for the 1957 D.O.S. map of Mt. Kenya were flown) and in 1950.Reference Cameron 12 These give the following figures for frontal recession in the intervening periods:

Measurements in 1947 and 1950 are available also for the Tyndall Glacier and comparative figures are:

The actual height of the snout at each stage was:

The general sequence of glacier fluctuation on Mt. Kenya since the last glacial maximum may be summarized as follows: retreat from 3,500 m. to about 4, 100 m. in the late Pleistocene period; thereafter, retreat with intervening stadial phases to a height of more than 4,270 m.; readvance to 4,270 m. within the last 200 years; renewed retreat from 1900 to the present day. There is a differentiation both in the pattern of historic moraines and in recent fluctuation of the existing glaciers between those on the east side and those on the west side of the mountain. Fluctuations comparable with those that have affected the glaciers of Mt. Kenya have been noted on Ruwenzori by de Heinzelin.Reference Heinzelin 13 , Reference Heinzelin 14
Survey of the Present Glaciers
As the 1957 D.O.S. 1: 25,000 map of Mt. Kenya is of too small a scale to assist detailed glaciological studies, a programme for large scale mapping of the peak area was begun in January 1958. Triangulation was extended from a base 335 m. long to provide 17 permanently marked stations on the south side of the peaks. Five further points, close to the Darwin and Tyndall Glaciers, were marked but not included in the initial scheme. The triangulation was oriented by sun azimuth, suitably adjusted and computed, to provide plane coordinates referred to an arbitrary origin, with a maximum error not exceeding ±50 cm.
Trigonometrical heights, based on the D.O.S. height of 16,355 ft. for Point Lenana (4,985 m.), were computed for all stations to a probable accuracy of ±30 cm.
From triangulation points a tacheometric survey of the Lewis Glacier was carried out and plotted at a scale of 1 : 2,500 with 10 m. contour interval.
The frontal portions of the Tyndall and Darwin Glaciers were surveyed tacheometrically from the permanent marks in their vicinity for the purpose of plotting at a scale of 1:2,500.
Glaciological Studies
The Expedition’s glaciological programme was concentrated on a study of the Lewis Glacier which is the largest on the mountain and also the glacier to which most scientific attention has been devoted in the past.
On other glaciers limited observations of a comparative nature were made of which some mention is included below.
(a) Comparisons with the Survey by Troll and Wien (1934)
Troll and WienReference Troll and Wien 15 made a survey of the Lewis Glacier by photo-theodolite in early May 1934. The resulting map proved susceptible to photographic enlargement from its published scale to that of the new survey. Checks were made to ensure that no appreciable distortion occurred in the process. Following reduction of heights to a common datum, direct comparison was made between the two maps with the following results:
-
(i) Between 1934 and 1958 the plan area of the Lewis Glacier diminished from 0 .46 km.2 to 0 .36 km.2. The figure for the 1934 area given by Troll and Wien is 0 .49 km.2, but this apparently includes snow-covered rock slopes to the north-west of the glacier which at the time of their visit were indistinguishable from the glacier surface.
-
(ii) The change from convex to concave transverse glacier profile, which occurred at 4,730 m. in 1934, occurred between 4,700 m. and 4,720 m. in 1958. A pit dug at 4,750 m. was in firn, but fir’ was absent a short distance below the zone of transition. It seems that the change of profile may safely be identified with the vicinity of the firn line, although the level is lower than observation elsewhere in the tropics might suggest.Reference White 16 On this basis the decrease in area is apportioned as follows:

The lowest part of the glacier in 1934 was a steep symmetrical lobe which descended abruptly from 4,600 m. to 4,475 m. in a horizontal distance of 300 m. This has vanished and the glacier now ends in an ice cliff behind a rock-guarded pool, the surface of which is at 4,575 m. Marginal recession of up to 60 m. has affected both eastern and western sides of the glacier in the ablation area. In the western accumulation region loss in area is limited to the western ice margin; in the eastern accumulation region the small loss in area is due to minor recession near the Curling Pond.
By interpretation of comparative surface profiles (Fig. 2) and application of Finster-walder’s formulae,Reference Finsterwalder 17 the quantity of ice lost from the present glacier surface since 1934 has been computed. It is hoped further to refine these results.

Fig. 2. The Lewis Glacier: outline map of the Lewis Glacier in January 1958. Lines of movement stakes, lines of comparative profiles, the situation of firn pits and of the meteorological station are shown. Three surface profiles showing the change in surface level between May 1934 and January 1958 are given on the right
An average thickness of about 10 m. of ice has been lost from the ablation area. At the present terminal the surface has fallen by as much as 17 m. At the firn line only locally is the loss more than 5 m. The surface in the western accumulation region has fallen uniformly by an average of 4 m.; in the eastern accumulation region the surface level above 4,850 m. differs little from that of 1934.
The volume of ice lost from the present tongue since 1934 is about 900,000 m.3 and the drop in the western accumulation region represents a further loss of about 400,000 m.3. The steepness of the slopes below the present terminal has prevented contouring by tacheometer and the depth of the Lewis Tarn is unknown. The volume of ice lost since 1934 beyond the present ice limits cannot, therefore, be computed at present. It might be estimated conservatively at about 500,000 m.3. The total loss in volume of the Lewis Glacier between 1934 and 1958 would then become about 1,800,000 m.3 of ice.
Since 1934 ice loss from the Lewis Glacier has been a product of frontal recession which has proceeded at a uniform rate. Thinning has been greatest at the terminal and least at the firn line which has remained constant in height. The type of down wasting which is elsewhere associated with a rise in the snow and firn lines,Reference Harrington 18 has not, during the period, affected the glacier.
The constant level of the Lewis Glacier firn line and upper firn field correlates with the unchanged appearance since 1934 of the Heim, Forel and Diamond Glaciers,Reference Shipton 19 none of which extends below 4,750 m.
The conditions of ice loss observed on the Lewis Glacier do not apply to all glaciers on the mountain. The static frontal condition of the Cesar Glacier from 1899 to 1919, followed by abrupt retreat, has already been noted. A comparable pause in frontal recession has since 1950 affected all the glaciers to the north-east where, however, photographic comparisons suggest a general fall in surface level.
(b) Ice Movement
Between 21 and 24 July 1957 three lines of bamboo stakes were sited and accurately surveyed on the Lewis Glacier in the positions indicated in Fig. 2. The stakes were resurveyed between 21 December 1957 and 3 January 1958. The movement in the intervening period was as follows:

From parallax measurement of oriented photographs taken at an interval of 104 hours, Troll and WienReference Troll and Wien 20 in 1934 calculated that annual movement slightly down glacier from the present line AA′ varied from a minimum of 5 m. near the centre of the glacier to maxima of 11 m. and 8 m. close to its western and eastern margins, respectively. The relatively high lateral velocities do not now occur, the speed of movement diminishing symmetrically to the sides of the glacier from the most swiftly moving section near its centre. There is no obvious explanation for this apparent change in flow pattern and it seems possible that fortuitous circumstances may have adversely affected the short-term measurement in 1934. The close conformity between the two measurements of mid-glacier speed tends to support this impression.
The direction of movement on the line CC′ is towards the terminal of the eastern section of the glacier at the Curling Pond. A rock ridge to the south of the Curling Pond is continued to the north by a ridge on the surface of the glacier marked by a large crevasse which extends with little interruption to the glacier’s upper limit. This crevasse has been an unchanging feature since at least 1926 and there is no indication of any passage of ice across it. Its sides begin to undergo plastic deformation at about 20 m. below the surface, but cavities continue below this level and may well reach the glacier bed.
(c) Economy
(i) Accumulation. Firn sections in three pits (the positions of which are marked in Fig. 2) and an ice section exposed in the large central crevasse in the Lewis Glacier are diagrammatically shown in Figs. 3–4. A striking feature in each section is the clear identity, both near the surface and to a depth of nearly 20 m., of the horizons of seasonal accumulation—a characteristic that has also been observed in the Elena Glacier on Ruwenzori.Reference Bergström 21 , Reference Bergstrom 22 , Reference Menzies 23

Fig. 3. A section in the crevasse dividing the Lewis Glacier fern field

Fig. 4. Firn profiles in three pits dug in the accumulation area of the Lewis Glacier
In Pit I the firn became waterlogged above a layer of ice 80 cm. below the surface. No free water was present at the time on the surface of the firn. In Pits II and III digging proceeded to a depth of 2.5 m. without free water being encountered and, during a period of eight days after excavation, when ablation was actively proceeding, only a few centimetres of water appeared in either pit.
The upper layers of crystalline snow, Iightly compacted firn and thin ice crusts in Pits II and III are associated with the precipitation period, November to December 1957, immediately prior to the excavation. The ice layer in Pit III and the corresponding dirt band in Pit II are the product of the ablation season, July to October 1957. The underlying bed of firn, related to the precipitation period April to June 1957, is practically indistinguishable in density or texture from that of the November-December period. Both Pits II and III ended in a further layer of ice which was locally penetrated in Pit III to reveal a further less compact layer below.
The sequence in the crevasse section is an extension of that observed in the pits. A smooth wall of ice appears from beneath the crevasse bridge and becomes accessible to examination about 10 m. below the glacier surface (Fig. 7, p. 480). The horizons were measured from this point to a level about 18 m. below the surface. The horizons throughout dip at 20° to the horizontal towards the south. In the sequence observed a cycle was noted which is ideally as follows:
-
3. Dirt band, 2–18 cm. thick.
-
2. Layer of clear ice, 5–15 cm. thick.
-
1. Layer of ice in which the granular structure of firn continues to be distinguishable, 33–91 cm. thick.
In the observed section twelve such cycles were recognized, six of which were complete, two without the dirt band and four .without the layer of clear ice.
The nature of the firn and ice sections confirms that annual accumulation generally occurs during two periods which correspond to the rains from March to May and from November to December. The extreme variability of seasonal accumulation is clearly shown. The quality of firn in the lower levels of the two deepest pits and the immature glacier ice at depth in the crevasse indicates that the mass consolidates into firn and ice by compacting under its own weight rather than by the intervention of melting. There are certain factors which may be significant in this connexion.
Aeolian material which gives rise to the dirt bands is abundant on the south-western side of Mt. Kenya. Fine-grained frost soil is plentiful near the glaciers.Reference Zeuner 24 Wind circulation generated in the vicinity of the mountain is comparable with that observed on KilimanjaroReference Geilinger 25 and results in air from the plains to the west rising in the main air stream and throughconvection to the level of the peaks, carrying with it dust and, in the dry season when bush and grass fires are common, quantities of fine ash. Numerous butterflies, hornets and beetles were found in January at heights of up to 5,000 m., so quickly carried up that they had not yet succumbed to cold. In these circumstances the surface of the firn becomes dirty very quickly at the beginning of the ablation season.
This condition, it is suggested, may intensify melting immediately at the surface in the early stages of ablation at a time when a deficiency of material exists in the upper layers of the fresh season’s accumulation. The melt water occurring at the surface will consequently penetrate only a few centimetres before refreezing.Reference Schytt 26 An ice layer will thus be formed which, once in existence, will tend to perpetuate itself by preventing heat penetration either directly or through melt water percolation to the levels beneath it. The process of firnification and transformation to ice except as suggested above by compacting under pressure will thus be retarded. In places where accumulation is marginal and of no great thickness melt water may be expected to penetrate more freely until localized above the first sub-surface layer which impedes it—the condition which was observed in Pit I. In such a situation the dirt band will not have a layer of refrozen ice beneath it. Isolated dirt bands may also occur through random dust falls in a period which is generally one of precipitation.
The experimental tests required to substantiate this explanation will shortly be carried out.
(ii) Ablation. At a time when ablation was actively proceeding there was practically no free water present on the surface of the Lewis Glacier in the ablation area. Depressions on the glacier surface and at its margins which might have formed natural channels for melt water streams were entirely without run-off. A deep hollow along the glacier’s western margin not only remained dry but retained unblemished snow in its bed long after all snow had melted from the glacier surface adjoining it.
It is apparent, however, that the absence of melt water at the surface in the ablation area is compensated by flow at depth. The outflow from the Lewis Tarn between 1 and 13 January 1958 was of the order of 0.6 cusecs. Ablation measurements at five points on the portion of the glacier draining to the Tarn during part of this period showed that the glacier’s loss was little more than to account for the observed flow. The amount of loss by evaporation during this period can only have been slight.Reference Church 27
Diurnal fluctuations in relative humidity (see Fig. 5) were such as to inhibit evaporation. The dry east wind generally descended to glacier level from about 9 p.m. to 9 a.m. to give the lowest relative humidity of the day during the hours of darkness. Following an interval of light variable winds in the course of the morning, the damp convective up-currents from the west generally reached the glacier by mid-day, maintaining relative humidity at a level near 70 per cent during the hours of most active ablation.

Fig. 5. Graphs illustrating mean hourly relative humidity (above) and mean hourly temperature (below) at the Lewis Glacier meteorological station (4,760 m.) for the period
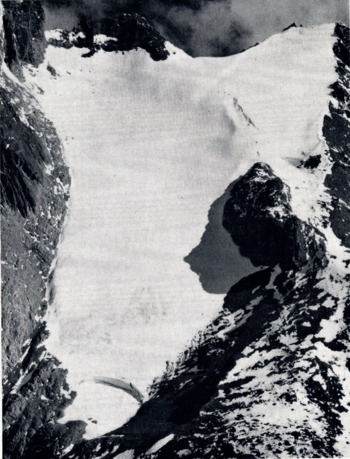
Fig. 6. Oblique air photograph of the Lewis Glacier in December 1957. The dividing crevasse is clearly visible. The picture provides an interesting comparison with a photograph taken in 1945Reference Spink 28

Fig. 7. The crevasse between the western and eastern sections of the Lewis Glacier. Banding in the left wall, where horizons were measured, is visible

Fig. 8. Oblique air photograph of the peaks from the north-east in December 1957, showing Nelion (5,188 m.) and Dalian (5,199 m.), the two highest summits. A, Gregory Glacier; B, krapf Glacier; C, Moraine of the late nineteenth century period
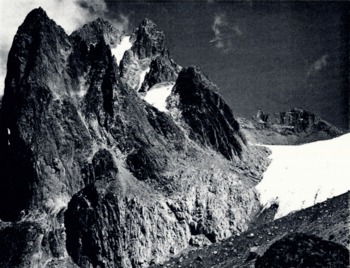
Fig. 9. The Diamond, Melhuish and Lewis Glaciers (from left to right). Moraine of the late nineteenth century period is seen in the foreground

Fig. 10. The Lewis Glacier firn field, showing Point Lenana (4,980 m.)

Fig. 11. The Lewis Glacier meleornlqgical station, December 1957-January 1958 (4,760 m.)
The glaciers to the north-east of the mountain are not influenced by the daily insurgence of damp west winds, and the fact that none of them yields a visible stream suggests that here evaporation may play a more significant part in ablation. In this context it may be noted, however, that on none of the glaciers were penitentes more than 2-3 cm. in height observed at any time.
(iii) Budget. There is at present no basis on which satisfactorily to calculate the specific budget of the Lewis Glacier since its exact depth is unknown. A preliminary calculation based on a depth obtained by Lagally’s method and available information of accumulation and ablation indicates that the internal velocity at the firn line is very much greater than that measured on the surface.
The greater size of the Lewis and Tyndall Glaciers in relation to glaciers on the north-eastern side of the mountain is, as noted in the past, due mainly to factors of aspect, precipitation and cloud protection from the sun. Despite the mountain’s equatorial position, there is, however, a vestige of the extra-tropical ‘ubac-adret’ relationship at the solstices. In January 1958 east-west ridges in the peak area formed divides between snow slopes to the north and rock slopes to the south. The Gregory Glacier showed no bare ice or firn on 18 January 1958 at a time when fresh snow was rapidly disappearing from all parts of the Lewis Glacier. All the glaciers lose more ice on their western than on their eastern margins, however, and there is no doubt that the east-west distinction is the dominant one.
The Tyndall and Lewis Glaciers are favoured topographically. The depth of the valley and head cirque of the Tyndall Glacier keeps it much of the time in shadow while the extensive upper basin of the Lewis Glacier far exceeds in size the accumulation area of any other glacier on the mountain.
The full results and final conclusions arising from the Expedition’s work are in preparation and will be presented in due course.
Acknowledgements
The writer wishes to acknowledge the assistance given by all members of the Mt. Kenya Expedition. In particular he wishes to thank Messrs. I. R. Menzies and I. C. Reid for their help with the glaciological field work and Dr. I. S. Loupekine for guidance and advice which he has so generously given.


