Various dietary assessment methods can be used to estimate an individual’s dietary intake(Reference Shim, Oh and Kim1). Depending on the approach used, these dietary assessment methods allow for large amounts of detail to be collected on dietary habits, meal timing and food preferences(Reference Shim, Oh and Kim1,Reference Kirkpatrick, Baranowski and Subar2) . Each dietary assessment method has its own strengths and limitations which influence their selection for use in research and clinical practice. Biomarkers of dietary intake can be assessed concurrently with dietary assessment methods as objective measures of intake of specific foods(Reference Hedrick, Dietrich and Estabrooks3). Unlike recovery biomarkers which are a direct measure of intake based on the proportion of the biomarker administered that is recovered over a specified time period, concentration biomarkers proportionally reflect dietary intake but are affected by inter-individual differences and cannot be used as a sole method to evaluate measurement error(Reference Jenab, Slimani and Bictash4). Therefore, while concentration biomarkers cannot be used as a sole measure of dietary intake, they can be used alongside dietary assessment methods to provide further insight into what people are consuming(Reference Jenab, Slimani and Bictash4).
Polyphenols are phytonutrients found in a variety of plant foods including vegetables, fruit, grains and coffee(Reference Manach, Scalbert and Morand5). The polyphenol content of different foods is highly variable and made up of thousands of individual polyphenols(Reference Tsao6). When polyphenols are eaten, they are broken down via a variety of metabolic pathways into their smaller metabolites, which enter the portal vein and then the peripheral circulation which facilitates their interaction with tissues and cells(Reference Santhakumar, Battino and Alvarez-Suarez7,Reference Gould and Dyer8) . The bioavailability and absorption of ingested polyphenols are also influenced by gut microbiota; the gut microbiota helps break polyphenols into smaller metabolites which facilitate their absorption into the blood stream(Reference Ozdal, Sela and Xiao9). However, the type and volume of gut microbiota present can influence polyphenol bioavailability and therefore concentrations in biological fluids(Reference Ozdal, Sela and Xiao9). Polyphenol metabolites not taken up by tissues/cells are excreted over time by the kidneys (urine) and liver (bile) with liver excreted polyphenols undergoing enterohepatic recirculation. Intakes of polyphenols should be reflected by urinary excretion; however, the quantity excreted via the urine may not accurately reflect the quantities consumed. The urinary half-life of individual polyphenol metabolites is highly variable and ranges from approximately 1 h to just over 1 d(Reference Manach, Williamson and Morand10) and can be influenced by the type and structure of foods consumed(Reference Rechner, Kuhnle and Hu11–Reference Bohn13). The relationship between urinary polyphenols and individual fruit and vegetables was explored in a previous study by the research team(Reference Clarke, Rollo and Collins14). However, this study suggested that the application of urinary polyphenols as a biomarker may be stronger for total polyphenols or polyphenols from food groups rather than individual foods. It is therefore important to further explore the relationship between urinary polyphenol metabolites and intakes of polyphenol-rich foods as part of a whole diet, rather than a singular food, in order to gain further understanding of its potential application as a biomarker.
Urinary polyphenol metabolites have been evaluated as biomarkers of dietary intakes of polyphenols and polyphenol-rich foods(Reference Clarke, Rollo and Pezdirc15–Reference Mennen, Sapinho and Ito17). The majority of the research has focused on 24-h urine samples(Reference Mennen, Sapinho and Ito17–Reference Clifford, Copeland and Bloxsidge21), with few studies having used spot urine samples(Reference Mennen, Sapinho and Ito17,Reference Medina-Remon, Alez and Zamora-Ros22) . While the relationship between dietary polyphenol intakes and urinary polyphenols has been established, limited studies have assessed the strength of these relationships using spot urine samples. Therefore, further research is required to determine the strength of the relationship between spot urinary polyphenols and self-reported dietary polyphenol intakes.
Young adults have poor diet quality, which puts them at a greater risk of non-communicable diseases(Reference Lim, Vos and Flaxman23). Compared with older adults, they have poorer intake of core foods such as vegetables, fruit and wholegrain, and greater intake of energy-dense, nutrient-poor foods(Reference Lim, Vos and Flaxman23). Understanding how different dietary patterns influence dietary polyphenol intake and the relationship with urinary polyphenol metabolites is required. Therefore, the aim of this study was to explore the relationship between spot urinary polyphenol concentrations and polyphenol intakes from polyphenol-rich food sources, in a group of young adults.
Methods
Young adults (18–24 years) living in the Newcastle, NSW, Australia area were recruited through posters, media releases and targeted social media ads through the University of Newcastle and invited to join a sub-study prior to being entered into the Advice Ideas and Motivations For My Eating (Aim4Me) study. Aim4Me was a 12-month online programme which aimed to determine the impact of three different levels of personalised web-based feedback to support changes in diet quality. Participants were randomised into one of three arms with varying levels of feedback, one group received access to an online programme and a one-off consultation with a dietitian, group two received access to the online programme only and the control group had access to neither. Further details of the Aim4Me study have been published elsewhere(Reference Haslam, Pezdirc and Truby24). Only participants who had completed the in-person measurement sessions at baseline and 3 months in the Aim4Me sub-study were analysed. Measurement sessions included measures of height, weight, 24-h recalls, spot urine samples and demographic surveys. Ethics was approved by the University of Newcastle Human Research Ethics Committee (H-2017-0087), and the Aim4me study was registered in the Australian New Zealand Clinical Trials Registry (ACTRN12618000325202).
BMI was calculated at baseline and after 3 months from height and weight measurements collected within sessions. Height was measured at baseline using a stadiometer (BSM370; Biospace Co.) and recorded to the nearest 0·1 cm, and weight was measured at baseline and 3 months (InBody; Biospace Co. Ltd.) and reported to the nearest 100 g.
The Automated Self-Administered 24-h recall system (ASA-24 Australia) was used to collect dietary intake data from participants. Two 24-h recalls were obtained at each time point, one approximately 3 d prior to each assessment session and one on the day of the assessment session, giving a total of four 24-h recalls. The average intake from both recalls is presented; if only one recall was collected for each time point, then intake from that recall was used. ASA-24 uses a multiple, eight-pass approach to collect information on the types and amounts of foods and drinks consumed in the previous 24 h from when the recall is started(Reference Subar, Thompson and Potischman25). ASA-24 Australia uses the AUSNUT 2011–2013 database to estimate food and nutrient intakes(26).
The polyphenol intakes from each recall were calculated using all the polyphenol values reported by the Phenol-Explorer database, version 3.6(Reference Neveu, Perez-Jiménez and Vos27). Based on the FAO food matching guidelines, foods reported in the 24-h recalls were matched with those in the Phenol-Explorer database(28), with retention factors applied to cooked and processed foods where appropriate. For mixed and packaged food items, ingredient lists and recipes were deconstructed. Where foods could not be matched, it was assumed that no polyphenols were present. This meant that for mixed and packaged foods, only the ingredients that could be matched were included and the other ingredients were assumed to contain no polyphenols. Total dietary polyphenols (TDP) were calculated, and polyphenol intakes were then categorised into classes of polyphenol-rich food sources including those from fruits, vegetables, juices, grains/cereals, tea/coffee, alcohol, energy-dense nutrient-poor foods (e.g. chocolate, biscuits, pizza, sauces), nuts/seeds, oils (e.g. olive oil, sunflower oil, margarine) and soya foods as classed in the AUSNUT database hierarchy(26).
Participants were asked to fast for at least 5 h prior to their laboratory measurement sessions, and fasting time was recorded. In these sessions, they provided a spot urine sample which was collected midstream into a sterile container. Samples were stored on ice until they could be frozen at −80oC.
Urine samples were prepared and analysed as previously described by Hollands et al. (Reference Hollands, Hart and Dainty29) Briefly, samples were subjected to enzymatic hydrolysis using sulfatase and glucuronidase and then analysed using LC-MS (Waters Acquity UPLC coupled to a TSQ-μ triple quadrupole MS operated in electrospray mode) using targeted multiple reaction monitoring to identify native compounds, along with their sulphate and glucuronide conjugates (to monitor for incomplete hydrolysis)(Reference Saha, Hollands and Needs30). Standards were obtained from Sigma-Aldrich (UK), or in-house standards were used, except for epicatechin sulphate and glucuronide where no standard was available, and for these multiple reaction monitoring tracking was used to search for the loss of a sulphate or glucuronide group from the epicatechin conjugate. Standard curves were generated from matrix-matched samples over a range of 10–2000 ng/ml.
Total urinary polyphenols were calculated as the sum of fourteen individual metabolites including 5-(3,4-dihydroxyphenyl)-y-valerolactone, 5-(3,4-dihydroxyphenyl)-y-valerolactone 4-O-glucuronide, 5-(3,4-dihydroxyphenyl)-y-valerolactone 3-O-glucuronide, 5-(3,4-dihydroxyphenyl)-y-valerolactone 3-sulphate, quercetin-3-O-sulphate, epicatechin, epicatechin sulphate, phloretin, naringenin, gallic acid, eriodictyol, ferulic acid, caffeic acid and p-coumaric acid. Hydroxyphenyl-y-valerolactones are microbial metabolites of flavan-3-ols including (epi)catechins and pro(antho)cyanidins. Hippuric acid (HA) was also quantified but is reported separately because it is influenced by polyphenol intakes as well as being a normal component of urine. Hence, likely why it was therefore detected in amounts up to 1000 times higher than other polyphenol metabolites(Reference Wishart, Feunang and Marcu31). These metabolites were chosen based on findings from a previous review undertaken by the research team(Reference Clarke, Rollo and Pezdirc15). All urinary metabolite concentrations were reported per gram of creatinine to standardise for hydration between samples.
Data were skewed and therefore reported as median (IQR), unless otherwise stated. Participant characteristics and polyphenol intakes from key food groups were reported using descriptive statistics. Wilcoxon signed-rank tests were used to assess whether changes were statistically significantly different from baseline to 3 months.
Associations between reported dietary polyphenol intakes and urinary polyphenols were explored using Spearman’s correlations. All participants were combined to test the relationship between dietary intake and urinary polyphenols, not to assess the effectiveness of the intervention and associations were explored at each time point separately. Correlations of <0·2 were classified as weak, 0·2–0·6 moderate and >0·6 strong based on previous studies(Reference Ashton, Williams and Wood32,Reference McNaughton, Hughes and Marks33) . A sensitivity analysis examined the strength of correlations between total urinary polyphenols and polyphenol intakes recorded from the recall collected the day of the urine sample. Intra-class correlation coefficients (ICC) were also used to examine the intra-variability between urine sample metabolites from the same individual. The same cut-offs were used to define ICC as weak, moderate or strong as those used to define the Spearman’s correlations.
Linear mixed models were used to determine the relationship between polyphenol intakes and urinary polyphenols accounting for within- and between-individual differences. These models were run unadjusted and adjusted accounting for sex, energy intake and BMI. Time was included in both models. All statistical analysis were undertaken using Stata version 14.2, and results were classed as statistically significant if P < 0·05. No adjustments were made for multiple comparisons, as the study was exploratory and not powered to detect significant effects for over 200 tests. As such, any ‘significant’ findings, using the nominal P-value of 0·05, need to be interpreted with caution and do not constitute rigorous evidence for the alternative hypotheses – for this, further confirmatory analysis, appropriately powered, would be required.
Results
Thirty participants completed baseline and 3-month sub-study sessions. The median age was 21(Reference Jenab, Slimani and Bictash4) years, with equal numbers of males and females (n 15).
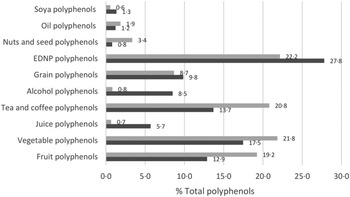
Median intakes of TDP were 265 mg/d and 288 mg/d at baseline and 3 months, respectively; differences in TDP was non-significant (P = 0·63) (online Supplementary Table 1). Polyphenol intakes between groups were non-significant at baseline and 3 months. The majority of TDP came from energy-dense nutrient-poor foods (mean 22% and 28% of TDP intake at baseline and 3 months, respectively) (Fig. 1). Other major sources of polyphenols came from vegetable (18% and 22%), tea/coffee (14% and 21%) and fruit (13% and 19%) polyphenols.

Fig. 1. Average percentage contributions of key food groups to total polyphenol intakes. ![]() 3 months;
3 months; ![]() Baseline.
Baseline.
HA was the most prominent urinary metabolite (Table 1, Fig. 2(a) and (b)). Individual differences were observed in concentrations, but differences were non-significant in the concentrations of total urinary polyphenols (P = 0·88) and HA (P = 0·61) at baseline and 3 months.
Table 1. Urinary polyphenol metabolite concentrations
(Mean values and standard deviations)


Fig. 2. Concentrations of urinary total polyphenols and hippuric acid at baseline and 3 months by individual. (a) Total urinary polyphenol concentration at baseline and 3 months by individual. (b) Urinary hippuric acid concentration at baseline and 3 months by individual.  Baseline;
  3-Months.
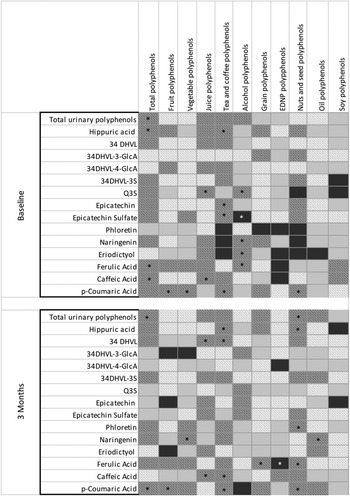
Significant, moderate correlations were identified between total urinary polyphenols and TDP at baseline (r s = 0·47) and 3 months (r s = 0·39). Total urinary polyphenols were also significantly, moderately correlated with polyphenols from nuts/seeds at 3 months (r s = 0·46) (Fig. 3 and online Supplementary Table 2).

Fig. 3. Heat correlations between urinary polyphenol metabolites and polyphenol intakes. *P < 0·05; 34DHVL, 5-(3,4-dihydroxyphenyl)-y-valerolactone; 34DHVL-3-GlcA, 5-(3,4-dihydroxyphenyl)-y-valerolactone 3-O-glucuronide; 34DHVL-4-GlcA, 5-(3,4-dihydroxyphenyl)-y-valerolactone 4-O-glucuronide; 34DHVL-3S, 5-(3,4-dihydroxyphenyl)-y-valerolactone 3-sulphate; Q3S, quercetin-3-O-sulphate. Based on data from Supplementary Tables 2 and 3.  ≥ 0·6;
  > 0·2–0·6;
  < 0·2–0·0;
  ≤ –0·0 to –0·2;
  < –0·2 to –0·6;
  ≤ –0·6.
HA had a significant, moderate correlation with TDP (r s = 0·44), fruit polyphenols (r s = 0·42) at baseline, tea/coffee polyphenols at baseline (r s = 0·46) and 3 months (r s = 0·44) and nuts/seed polyphenols at 3 months (r s = 0·39) (Fig. 3 and online Supplementary Table 2).
Relationships with individual urinary polyphenol metabolites were also explored (Fig. 3 and online Supplementary Table 3). Significant, moderate correlations were identified between dietary polyphenol intakes and individual metabolites at baseline (n 15) and 3 months (n 14). The strongest correlations were identified for epicatechin sulphate and tea/coffee polyphenols (r s = 0·53), ferulic acid and alcohol polyphenols (r s = 0·55) and p-coumaric acid and vegetable polyphenols (r s = 0·53).
The sensitivity analysis (online Supplementary Table 2) identified stronger correlations between total urinary polyphenols and TDP (3 months only), vegetable and fruit polyphenols from 24-h recalls collected the day of the urine samples. Weaker correlations were identified with nuts/seed (3 months only), juice and tea/coffee polyphenols. HA correlations were mostly similar. Stronger correlations were identified between HA and fruit and alcohol polyphenols, and weaker for juice polyphenols (baseline only).
ICC are reported in Table 2. A moderate ICC showing a moderate agreement between the two urine samples was identified for the following urinary metabolites: TUP, HA, 5-(3,4-dihydroxyphenyl)-y-valerolactone, 5-(3,4-dihydroxyphenyl)-y-valerolactone 3-sulphate, epicatechin sulphate, ferulic acid, caffeic acid and p-coumaric acid. The remaining ICC were weak.
Table 2. Intra-class correlation coefficients (ICC) between urinary metabolites from the same individual
(Intra-class correlation coefficients and 95 % confidence intervals)

* ICC and 95% CI results were both <0·000.
Linear mixed model findings are expressed in Table 3. Sex was the only significant confounder, with other potential confounders non-significant (P > 0·05). Significant relationships were observed for HA and intakes of TDP, tea/coffee, oil and soya polyphenols (negative), only.
Table 3. Linear mixed models exploring the relationship between polyphenol intake and spot urine polyphenol metabolite concentrations
(Coefficient values and 95% confidence intervals)

EDNP, energy-dense nutrient-poor.
* Adjusted for sex, energy intake and BMI.
Discussion
The current study aimed to explore the relationship between dietary intakes of polyphenol from polyphenol-rich food sources and polyphenol concentrations in spot urine samples, in a group of young adults. Consistent, significant relationships were identified between urinary polyphenol metabolites and polyphenol intakes from a variety of polyphenol-rich food sources, particularly TDP and tea/coffee polyphenols.
Polyphenol intakes in the current study (median about 280 mg/d) were lower than intakes reported previously from 24-h recalls which are estimated to be approximately 890 mg/d(Reference Del Bo, Bernardi and Marino34). However, intakes from other countries such as USA and Spain have been found to be closer to 300 mg/d(Reference Del Bo, Bernardi and Marino34). The lower intake of polyphenols observed in the current study is expected as young adults diet quality is poorer than older adults(Reference Haslam, Pezdirc and Truby24), as young adults consume lower intakes of vegetables and fruits and higher intakes of energy-dense nutrient-poor foods(Reference Haslam, Pezdirc and Truby24,35) . This is reflected in the current study where majority (22–28 %) of polyphenol intakes came from energy-dense nutrient-poor foods. Additionally, tea and coffee are usually reported as major contributors to total polyphenol intakes in other studies(Reference Del Bo, Bernardi and Marino34). However, this was not the case in the current study, with approximately only one-third of participants consuming tea and coffee. Similarly, alcohol intake which has also been reported as a major contributor to total polyphenol intakes(Reference Del Bo, Bernardi and Marino34) was low in the current study. Of those who did report consuming alcohol, majority reported drinking beer and approximately 20 % from (white) wine (unpublished results). Both of these options were providing less polyphenols per 100 g compared with red wine(Reference Neveu, Perez-Jiménez and Vos27), which is commonly reported as a major contributor to total polyphenol intakes(Reference Del Bo, Bernardi and Marino34). These differences in intake may also have contributed to the lower total polyphenol intakes compared with other populations.
Few studies have explored the application of spot urinary polyphenol measurement in intervention studies(Reference Mennen, Sapinho and Ito17,Reference Medina-Remon, Alez and Zamora-Ros22,Reference Guo, Tresserra-Rimbau and Estruch36) . Medina-Remon et al. found similar correlations between total urinary polyphenols and TDP(Reference Medina-Remon, Alez and Zamora-Ros22,Reference Saura-Calixto and Goñi37) , but weaker correlations with vegetable, fruit and grain/cereal polyphenols(Reference Medina-Remon, Alez and Zamora-Ros22). The differences in the strength of correlations observed may be explained by the different dietary assessment method (FFQ) and polyphenol database (Spanish-specific) used. Comparisons between studies are limited due to the variation in urine sampling techniques (e.g. spot v. 24 h), urinary polyphenol analysis techniques (e.g. LC-MS v. Folin-Ciocalteu), dietary assessment methods (e.g. 24 h v. FFQ) and food composition databases (e.g. Phenol-Explorer v. USDA Flavonoid database). Additionally, the population groups explored in other studies have been older (24–80 years) and from different countries with different dietary patterns to the current sample (e.g. Spain or France) which may also explain some of the differences observed between studies.
Similar to other studies, the current study found HA to be the most abundant polyphenol metabolite identified in urine(Reference González-Domínguez, Urpi-Sarda and Jáuregui16,Reference Alkhaldy, Edwards and Combet38) . Correlations between excretion of urinary HA and dietary polyphenol intakes were significant for TDP, fruit, tea/coffee and nuts/seed polyphenols. Other studies have identified urinary HA as a biomarker of tea(Reference Clifford, Copeland and Bloxsidge21,Reference Daykin, Van Duynhoven and Groenewegen39,Reference Rothwell, Madrid-Gambin and Garcia-Aloy40) , coffee(Reference González-Domínguez, Urpi-Sarda and Jáuregui16,Reference Rothwell, Madrid-Gambin and Garcia-Aloy40) , cocoa(Reference Rios, Gonthier and Rémésy41), wine(Reference González-Domínguez, Urpi-Sarda and Jáuregui16), vegetables and fruits(Reference González-Domínguez, Urpi-Sarda and Jáuregui16,Reference Krupp, Doberstein and Shi42,Reference Garcia-Perez, Posma and Gibson43) . Few studies have explored correlations between HA excretion and dietary polyphenols. Moderate-to-strong correlations have been observed in studies which used 24-h urine samples and assessed intakes using 3-d food records in children and adolescents(Reference Krupp, Doberstein and Shi42,Reference Penczynski, Krupp and Bring44) . Weaker correlations have been reported when spot urine samples are used compared with 24-h urine samples(Reference Mennen, Sapinho and Ito17,Reference Garcia-Perez, Posma and Gibson43) ; this may explain the weaker correlations observed between the current study and previous findings. Further research is still required to determine the strength of HA from spot urine samples in reflecting intakes of polyphenol-rich food sources.
Similar numbers of individual urinary polyphenol metabolites were statistically significantly correlated with intakes of various dietary polyphenols at baseline and 3 months. Few studies have explored the relationships between-individual urinary polyphenol metabolites and intakes of polyphenol-rich foods(Reference Mennen, Sapinho and Ito17,Reference Krogholm, Bredsdorff and Alinia20,Reference Noh, Freisling and Assi45–Reference Edmands, Ferrari and Rothwell47) . Each of these studies used 24-h urine samples but a different dietary assessment method with four using 24-h recalls(Reference Krogholm, Bredsdorff and Alinia20,Reference Noh, Freisling and Assi45–Reference Edmands, Ferrari and Rothwell47) , three FFQ(Reference Noh, Freisling and Assi45–Reference Edmands, Ferrari and Rothwell47) and one a 2-d food record(Reference Mennen, Sapinho and Ito17). All studies were conducted in older adults (>24 years) and in European countries, where differences in dietary intake between younger and older adults and different countries may also explain to an extent the differing strengths of these correlations. Each of these studies used a different combination of urinary metabolites compared with those used in the current study. Unlike the current study, moderate correlations between fruit intake and urinary metabolites hesperetin, naringenin and phloretin were identified(Reference Mennen, Sapinho and Ito17,Reference Krogholm, Bredsdorff and Alinia20) . Potentially, weaker correlations were observed in the current study due to the use of spot urinary polyphenols, the use of a retrospective dietary assessment method or the low intakes of polyphenols from fruits (median intakes < 50 mg/d). Vegetable polyphenols were moderately correlated with urinary naringenin in the current study. This relationship has also been identified previously using 24-h urine samples(Reference Krogholm, Bredsdorff and Alinia20). Unlike the previous studies, statistically significant, moderate correlations were identified between vegetable polyphenols and p-coumaric acid.
Wine is rich in polyphenols and has previously been identified to be statistically significantly correlated with urinary p-coumaric acid, epicatechin, caffeic acid and gallic acid(Reference Mennen, Sapinho and Ito17,Reference Noh, Freisling and Assi45,Reference Zamora-Ros, Achaintre and Rothwell46) . These findings were not reflected in the current study. Caffeic acid has been observed to be moderately-to-strongly correlated with coffee intake (r = 0·29–0·65), previously(Reference Mennen, Sapinho and Ito17,Reference Noh, Freisling and Assi45–Reference Takechi, Alfonso and Harrison48) . Similar to previous studies, a moderate correlation was identified between caffeic acid and tea/coffee polyphenols. This relationship is expected based on previous reviews which reported a peak in caffeic excretion post coffee intake(Reference Clarke, Rollo and Pezdirc15,Reference Rothwell, Madrid-Gambin and Garcia-Aloy40) . Ferulic acid has been identified in the urine after the consumption of wholegrains in a randomised controlled trial and cohort study (24-h recall)(Reference Zamora-Ros, Achaintre and Rothwell46,Reference Harder, Tetens and Let49) . Moderate correlations were identified in this study between ferulic acid and grain polyphenols (3 months only). Further research is required to determine the potential application as a biomarker of wholegrain intakes.
Stronger correlations were identified between total urinary polyphenols and intakes of some polyphenols from 24-h recalls collected the same day as the urine sample compared with the average of both recalls. HA correlations were mostly similar between average reported intakes and intakes from the day of the urine sample collection. This may be explained by the longer time to maximum urinary concentration of HA (up to 15 h) compared with individual polyphenol metabolites (<12 h)(Reference Toromanović, Kovac-Besović and Sapcanin50–Reference Pereira-Caro, Borges and van der Hooft52). The short half-life of urinary polyphenols may also explain why stronger correlations were identified for TDP and polyphenols from major food sources in the 24 h prior to sample collection as polyphenol intakes from foods consumed outside this period may have been missed.
Linear mixed models identified significant relationships between HA and intakes of TDP, tea/coffee, oil and soya polyphenols. These relationships suggest that increased intakes of TDP or polyphenols from tea/coffee or oil result in a greater excretion of HA, whereas a negative relationship was observed between HA and soya polyphenols, suggesting that participants who had higher intakes of polyphenols from soya foods had a lower excretion of HA. Although total urinary polyphenols were not statistically significantly related to TDP intakes in these models, the 95 % CI were small, which suggests that these estimates are relatively precise. The relationship between increased TDP, and tea/coffee polyphenol intakes and increased HA excretion follows previous findings in the literature which have identified increased amount of HA in the urine following intake of a polyphenol-rich foods and a high polyphenol diet(Reference Clarke, Rollo and Pezdirc15,Reference González-Domínguez, Urpi-Sarda and Jáuregui16,Reference Alkhaldy, Edwards and Combet38,Reference Rothwell, Madrid-Gambin and Garcia-Aloy40,Reference Penczynski, Krupp and Bring44) . Unlike the other findings, the relationship between HA and oil and soya polyphenols is not expected and has not been identified previously in the literature. However, this relationship may be explained by the moderate correlations between soya polyphenols and other polyphenol-rich foods including fruits, vegetable and oil polyphenols (unpublished results).
There is limited research on the application of spot urinary polyphenols in intervention studies. The majority of research to date has used 24-h urine samples or has been undertaken in controlled feeding studies(Reference Krogholm, Bredsdorff and Alinia20,Reference Krupp, Doberstein and Shi42–Reference Penczynski, Krupp and Bring44) , which are not always feasible. Spot urinary polyphenols and HA show promise as a biomarker of polyphenol intakes. If spot urinary polyphenols can be validated through rigorous testing, such as that proposed by Dragsted et al. (Reference Dragsted, Gao and Scalbert53), then spot urinary polyphenols may be applied in studies to evaluate measurement error. The application of concentration biomarkers to assess measurement error may require more flexible assumptions and the need for a calibration feeding study, but will reduce bias compared with if no correction for measurement error is made(Reference Keogh, White and Rodwell54). If validated, spot urinary polyphenols will allow for the correction of measurement error to improve understanding of diet–disease relationships.
There are several limitations to the current study. Urinary polyphenol metabolites were quantified using a targeted metabolomics approach of specific urinary polyphenol metabolites. This increases sensitivity to detect metabolites but may have resulted in other polyphenol metabolites, which may have been present in the urine, being missed. Second, a European database (Phenol-Explorer) was used to determine polyphenol intakes of young adults in Australia. Geographical location has been shown to potentially influence the polyphenol content of foods(Reference Manach, Scalbert and Morand5); however, there is no complete polyphenol database specific to Australian foods, which is why the Phenol-Explorer database was used. Further in some circumstances, matching of foods consumed to food database food items was limited when inadequate detail was provided for mixed or packaged foods. Urinary polyphenol metabolite concentrations are likely affected by gut microbiota which were not assessed in the current study. Comparisons between studies are also limited due to different studies using different urine collection methods, analysis techniques, dietary assessment methods and food composition databases. These differences may explain why findings in the current study are somewhat different to those reported elsewhere. The major strength of this study is that a detailed exploration of the relationships between urinary polyphenol metabolites and polyphenol intakes at food groups level has been explored. Future studies could consider further exploring the application of spot urinary polyphenols in intervention studies to understand the strength of their application in different populations and settings. Future studies using larger sample sizes could consider stratifying by key characteristics, not just adjust for them in models like what was done in the current study, to provide further insight into the relationship between dietary intake and urinary metabolites. Last, further research is required to determine ideal timing of the collection of spot urine samples due to the variation in polyphenol metabolite half-lives and the reproducibility of findings in young adults and other populations.
The current study has identified potential polyphenol biomarkers that correlate significantly with TDP and tea/coffee polyphenols. Total urinary polyphenols were identified to have consistent, moderate correlations with TDP intakes suggesting future use as a biomarker of TDP. HA was shown to be a promising biomarker of TDP and tea/coffee polyphenols. Caffeic acid was also shown to be a promising biomarker of tea/coffee polyphenols. Overall, further research is still required to understand the strength of the relationship between intake, individual metabolism and urinary excretion of polyphenols.
Acknowledgements
The Aim4me study was funded by a National Health and Medical Research Council (NHMRC) targeted research grant, grant number G-1500349. E. D. C. is supported by an Australian Government Research Training Program (RTP) Scholarship. C. E. C. is supported by an NHMRC Senior Research Fellowship and a University of Newcastle, Faculty of Health and Medicine, Gladys M Brawn, Senior Research Fellowship. P. A. K. and M. H. gratefully acknowledge the support of the Biotechnology and Biological Sciences Research Council (BBSRC) which contributed to funding of the polyphenol assays via the Institute Strategic Programme Food Innovation and Health Grant BB/R012512/1 (and its constituent projects BBS/E/F/000PR10343 and BBS/E/F/000PR10346) and a Core Capability Grant BB/CCG1860/1.
The authors have no conflicts of interest to declare.
E. D. C. contributed to the methodological design of the sub-study, data collection, analysis and drafting of the paper. C. E. C., M. E. R. and R. L. H. contributed to the design, analysis and drafting of the paper. M. P. and P. A. K. analysed the urine samples and helped with the interpretation of results.
Supplementary material
To view supplementary material for this article, please visit https://doi.org/10.1017/S0007114521001343