


Phytic acid (1,2,3,4,5,6 myo-inositol hexakis dihydrogen phosphate) is the principal storage form of phosphate in plant seeds and is found at concentrations of 5–50 g/kg in cereals, grain legumes and oilseed meals( Reference Eeckhout and De Paepe 1 ). Phytic acid is strongly electro-negative and readily forms chelates with cations such as Ca, Zn, Fe and Cu( Reference Maenz, Engele-Schaan and Newkirk 2 ), rendering both phytic acid and the associated mineral(s) poorly soluble and so recalcitrant to digestion. In addition, phytic acid has been shown to increase endogenous amino acid flow in the ileum of broilers( Reference Cowieson and Ravindran 3 ), putatively via a mechanism involving hyper-secretion of pepsin, mucin, HCl and NaHCO3 ( Reference Cowieson, Bedford and Selle 4 ). The capacity to form insoluble precipitates with nutritionally-relevant minerals, and the antagonistic effect on N cycling (through detrimental changes to mucin integrity, endogenous enzyme secretion and amino acid absorption) in the intestine have been nutritional obstacles that have attracted substantial research interest, especially in the area of phytase (the exogenous enzyme responsible for the hydrolysis of phytic acid). However, the relevance of myo-inositol in phytase-mediated effects remains largely unexplored. For example, it is not clear how quickly myo-inositol is absorbed, what effect this has on various metabolic indicators and, crucially, whether there are differences in response when myo-inositol is delivered orally compared with indirect genesis through the action of exogenous phytase in the gut.
The beneficial effects of exogenous phytase in the diets of non-ruminants are unequivocal and oriented strongly around improvements in the solubility and digestibility of P and the consequences of the use of phytase in animal agriculture on improving sustainability has been considerable( Reference Selle and Ravindran 5 , Reference Selle and Ravindran 6 ). However, although displacement of inorganic P in the diets of pigs and poultry has been the primary driver of growth in phytase use since its introduction as a commercially relevant feed additive in the early 1990s, more recently, the so-called ‘extra-phosphoric’ effects have gained importance( Reference Cowieson, Wilcok and Bedford 7 ). These ‘extra-phosphoric’ effects are associated with the strong electro-negative charge carried by phytic acid at intestinal pH that causes chelation between phytic acid and various divalent cations and also interaction between phytic acid and protein( Reference Selle, Cowieson and Ravindran 8 , Reference Selle, Cowieson and Cowieson 9 ). In addition to reducing the bioavailability of dietary cations and protein, these interactions influence endogenous protein and mineral losses, and may reduce the integrity of intestinal mucin and influence the electrolyte balance in the lumen( Reference Cowieson, Bedford and Selle 4 , Reference Cowieson, Acamovic and Bedford 10 , Reference Ravindran, Cowieson and Selle 11 ). Delivery of these extra-phosphoric effects, for example digestible energy, amino acids and various minerals, relies on the rapid and complete dephosphorylation of phytic acid (especially the higher esters) in the cephalic gastrointestinal tract( Reference Cowieson, Ruckebusch and Knap 12 – Reference Cowieson, Ruckebusch and Sorbara 14 ), but are reasonably consistent. This contextual discussion is important because so-called ‘superdosing’ of phytase putatively improves performance of pigs and poultry at a level that is not readily explained by a log-linear response curve for digestible minerals or amino acids. Realisation of these phytase-mediated effects across various enzyme inclusion concentrations and the apparent disconnect with ‘super-dosing’ narratives led to an increase in interest in myo-inositol and the potential role of this moiety in phytase responses. Zyla et al. ( Reference Zyla, Dulinski and Pierzchalska 15 ) and Cowieson et al. ( Reference Cowieson, Ptak and Mackowiak 16 ) noted positive effects of the oral supply of myo-inositol to broilers (at dietary concentrations similar to that which may be expected to be released by phytase). Cowieson et al. ( Reference Cowieson, Aureli and Guggenbuhl 17 ) and Guggenbuhl et al. ( Reference Guggenbuhl, Perez Calvo and Fru 18 ) observed that supplementation of a broiler or swine diet with exogenous phytase resulted in a significant increase in myo-inositol in plasma, suggesting that phytase effects may be similar to those of direct addition of myo-inositol to diets. Walk et al. ( Reference Walk, Santos and Bedford 19 ) also noted that the addition of exogenous phytase to the diets of broilers resulted in an increase in the concentration of myo-insotiol in the gizzard and that these effects were correlated with bird performance. However, the absorption of myo-inositol, when fed directly, or myo-inositol, when generated in situ by phytase, is not well understood and how (or if) myo-inositol concentration in plasma is regulated is unclear. The hypothesis of the study presented herein was that addition of myo-inositol to the diet would result in a rapid appearance of the same in plasma and that similar responses would be noted by the addition of an exogenous microbial phytase. Some differences in response of alternative blood parameters to supplementation of diets with either phytase or myo-inositol were anticipated.
Methodology
All procedures were approved by Purdue University Animal Care and Use Committee.
Pigs and diets
Barrows (Duroc×Yorkshire×Landrace terminal crosses from equal parity sows) with an average initial body weight 28·7 (sd 1·0) kg, fitted with indwelling jugular catheters, were used in this study. Pigs received a daily allowance of the basal diet at 11·6 % of the metabolic BW of the lightest pig before experiment started at 08.30 and 14.30 with free access to water. Barrows were randomly assigned to four diets, on the day they were moved into the PigTurn (BASi) based on their body weights. The four diets were: (1) control diet (CD) that was formulated to meet nutrient requirements of 20–30 kg pigs; (2) CD + 2 g myo-inositol/kg; (3) CD + phytase at 1000 phytase units (FYT)/kg; (4) CD + phytase at 3000 FYT/kg (Table 1). The experimental diets were offered, to eight pigs per diet, only on the day blood samples were collected. Prior to introduction of the experimental diets all pigs received the CD. At time 0 (08.30 hours), pigs were offered half of the total daily feed allowance, and simultaneously bled for the time 0 bleeding (the −30 bleeding was at 08.00 hours). A period of 15 min later, which is 15 min after feeding, they were bled again. And then bled 30, 45, 60, 90, 120, 150, 180, 240, 300 and 360 min after feeding. After the last bleeding (16.30 hours), they were fed the second installment of the total daily feed allocation. They were not bled again after the second feeding. The process was repeated eight times for each treatment because there were only four PigTurn devices, so only one replicate per treatment could be handled consecutively.
Table 1 Ingredient composition of experimental diets on an as-fed (unless otherwise indicated) basis
CD, control diet; GE, gross energy; FYT, phytase units.
* Supplied the following per kg of diet: vitamin A, 1089 μg; vitamin D3, 9·1 μg; vitamin E, 23·7 mg; menadione,1·32 mg; riboflavin, 5·28 mg; d-pantothenic acid, 13·1 mg; niacin, 19·8 mg; choline chloride, 771 mg; vitamin B12, 23·1 ug.
† Supplied the following per kg of diet: iodine, 0·46 mg; Mn, 15 mg; Cu, 11·3 mg; Fe, 121·3 mg; Zn, 121·2 mg.
‡ Selenium premix provided 0·3 mg Se/kg diet.
§ Inositol premix made to 0·1 g/kg which when added at 20 g/kg provided 2 g inositol/kg diet.
|| Phytase premix (RONOZYME HiPhos; DSM Nutritional Products) made to 0·01 g/kg which when added at 10 or 30 g/kg provided 0·1 g/kg or 0·3 g/kg diet (1000 or 3000 FYT/kg, respectively).
¶ Total phytate-bound P.
PigTurn blood collection device
The PigTurn consisted of a 1·2-m diameter animal enclosure in an octagonal shape giving 1·12 m2 floor area (see Fig. 1). The floor was plastic-coated perforated steel and the side walls were solid, clear plastic with aluminum supports. A drive system consisting of an electric motor with gear reduction, a belt drive, and an adjustable speed motor controller allowed external control of clockwise and counterclockwise rotation of the enclosure. The feedback control of the drive system consisted of a tether connecting the pig via a harness (see Fig. 2) to an optical sensor array suspended above the enclosure. The sensor array converted the pig movement outside an allowed 270° arc into a signal that triggered the drive system to rotate the enclosure in the opposite direction of the pig movement. This allowed the pig to remain relatively constant in relation to the room while allowing movement in the pen. This system also enabled automatic recording of time, direction and duration of animal movement. The harness was an adjustable H-design with additional strapping to control movement or slippage while on the pig.
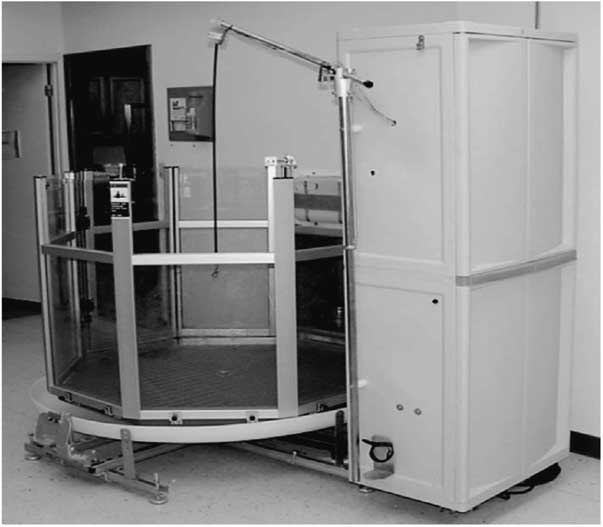
Fig. 1 Digital photograph of the PigTurn.
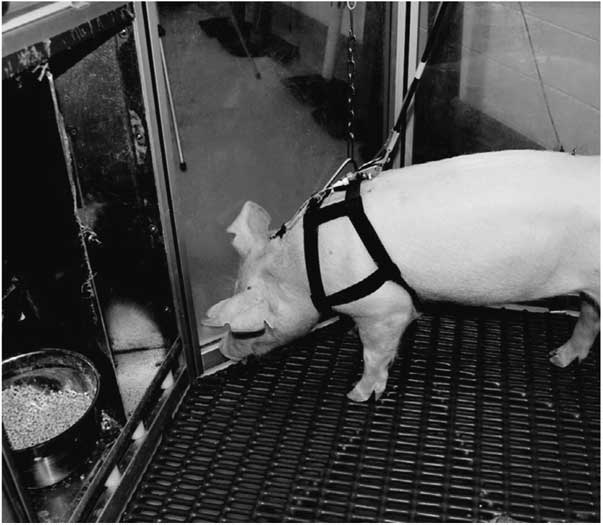
Fig. 2 Digital photograph of a pig in the PigTurn.
Surgery
Surgical placement of jugular catheter and housing in the PigTurn were as described by Marchant-Forde et al. ( Reference Marchant-Forde, Matthews and Poletto 20 ). In brief, feed was withdrawn 12 h before planned surgery and anaesthesia was induced by intramuscular injection of 2·2 mg/kg of a mixture of 50 mg/ml each of tiletamine, zolazepam (combined as Telazol; Fort Dodge Animal Health), ketamine (Ketaset; Fort Dodge Animal Health) and xylazine (Sedazine; Fort Dodge Animal Health). The external jugular vein was isolated and two loose ligatures of 2-0 non-absorbable suture (Ethilon; Ethicon Inc.) were placed. A trocar was passed from the dorsal site to the ventral cervical incision as an assistant protected the vessels. The trocar was withdrawn as the surgeon set the 7-french, double-lumen, central venous catheter (Arrow International) into the dorsal incision. An H-harness was fitted to the pig and the catheter end was attached to the harness using a zip-tie. The catheter was blocked with a heparin lock and the pig was given intramuscular injection of analgesic (flunixin meglumine; Banamine-Merck Animal Health) at 2·2 mg/kg and antibiotic (Cefazolin) at 50 mg/kg. The pig was then transported to a slatted floor pen for recovery after voluntary movement was evident. All surgeries for each pig took approximately 45 min.
Blood collection
Pigs were moved to the PigTurn 24 h post-surgery, the harness was hooked up to the tether, and the pen rotation system was activated (Fig. 1 and 2). The catheter was attached to a 2-m catheter extension fixed to the automatic sampling system (Culex-L; BASi), which was programmed to collect blood at the collection intervals: −30, (30 min before feeding), 0, 15, 30, 45, 60, 90, 120, 150, 180, 240, 300 and 360 min post-feeding. Feed and water were provided ad libitum. Heparinised saline was used to maintain catheter patency. Blood was collected into heparinised tubes. Catheter lines were flushed with heparinised saline in between collections to prevent coagulation and line blockage. Blood was held at 4oC for 7 h before being centrifuged at 2000 g at 4oC for 10 min to separate the plasma and then aliquoted into 1·5-ml centrifuge tubes and stored at −80oC until subsequent analyses.
Chemical analyses
Plasma myo-inositol samples were prepared in duplicate as described by Frieler et al. ( Reference Frieler, Mitteness and Golovko 21 ) and analysed by ultra-performance liquid chromatography/MS according to the method of Leung et al. ( Reference Leung, Mills and Burren 22 ). P, Ca, alkaline phosphatase (ALP), glucose, TAG and urea in plasma were determined in duplicate with a biomedical automate Cobas 6000 (Roche Diagnostics).
In-feed phytase activity was determined by Biopract GmbH. One FYT of phytase (EC 3.1.3.2) is defined as the quantity of enzyme which sets free 1 µmol of inorganic phosphate/min from 5·0 µmol/l sodium phytate at pH 5·5 and at 37°C.
Statistical analysis
All statistical analyses were performed in the statistical software R, version 3.2.2 (2015; R Core Team), running on Windows 7. Statistical differences at time 0 were tested by ANOVA followed by a Tukey's post hoc test. For the ANCOVA analyses, the outcome at 360 min was predicted using the dietary treatment as the main factor and the baseline level at 0 min as covariate, to adjust for initial (immediately prior to receiving the experimental diets) differences among individual animals. The intermediate time points between 0 and 360 min were not included. A Tukey's post hoc test was applied after the ANCOVA. For the linear regression model over time, a mixed model was applied using the function lme() in the library nlme. All time points from 0 to 360 min were included in this model, to increase statistical power. Time, dietary treatment and their interaction were included as fixed factors, and the individual animal was included as a random factor, which adjusted for initial differences. The gradual divergence between the dietary treatments over time, that is the difference among their slopes, was clearly reflected in the time–treatment interaction coefficients, as expected for such a response pattern. The dietary treatment term by itself did not contribute significant effects as the treatment groups did not yet differ at baseline. As baseline differences were also captured in the random effect of the individual animal, the dietary treatment term by itself was ultimately omitted in the final analyses. For the dose–response regression, the myo-inositol group was excluded and the dose was coded as 0, 1000 and 3000 FYT/kg, resulting in a single coefficient for this continuous dose variable. In the dose–response regression, the continuous dose variable was kept as a predictor in the model as that was just a single coefficient. The regression analyses were not adjusted post hoc.
Results
Plasma metabolite concentrations across the four dietary treatments at time zero are presented in Table 2 and after 360 min of feeding are presented in Table 3. No significant differences among treatment groups were observed at time 0, but the values at time 0 were included as a covariate or random factor in the statistical models nevertheless to adjust for any initial differences among individuals. However, 360 min after receiving the experimental diets there was an increase (ANCOVA, P<0·05 each) in plasma myo-inositol for pigs that were fed the diets containing either myo-inositol or phytase compared v. control. In a linear mixed model regression over time, the concentration in the 1000 and 3000 FYT/kg groups gradually increased v. the control group (P<0·001 each). Including the intermediated time points in the regression model seemed to enhance the statistical power. When dose was coded as a continuous variable, there was a linear (P<0·001) effect of phytase dose, that is plasma myo-inositol concentration was positively correlated with phytase dose. The concentration in the 3000 FYT/kg group increased more than the 1000 FYT/kg group (regression, P=0·026, unadjusted), in line with that correlation. There were no effects of diet on plasma ALP, Ca, glucose, TAG or urea. However, plasma P concentration at 360 min was increased v. control (ANCOVA, P<0·001; regression over time, P<0·001; Fig. 4) by the addition of both 1000 and 3000 FYT/kg phytase, but not by addition of myo-inositol, which was not significantly different from control. When dose was coded as a continuous variable in the regression, there was a linear (P<0·001) effect of phytase dose, that is plasma P concentration was positively correlated with phytase dose. The addition of 3000 FYT/kg increased P concentration more than the addition of 1000 FYT/kg (ANCOVA, P=0·012; regression over time, P<0·001). Figs 3–9 present the effects of the various dietary interventions on plasma metabolites in pigs from 30 min before feeding to 360 min after feeding (−30, 0, 15, 30, 45, 60, 90, 120, 150, 180, 240, 300 and 360 min). There was a significant effect of time on plasma myo-inositol concentration for diets containing myo-inositol or either 1000 or 3000 FYT/kg phytase, but not for the control group, that is elapsed time had no effect on myo-inositol concentration in the animals that received the control diet. Urea concentration increased over time (regression over time, P<0·01), but without significant differences among dietary treatments. There was no effect of time on plasma ALP, Ca, glucose, TAG (Fig. 9).
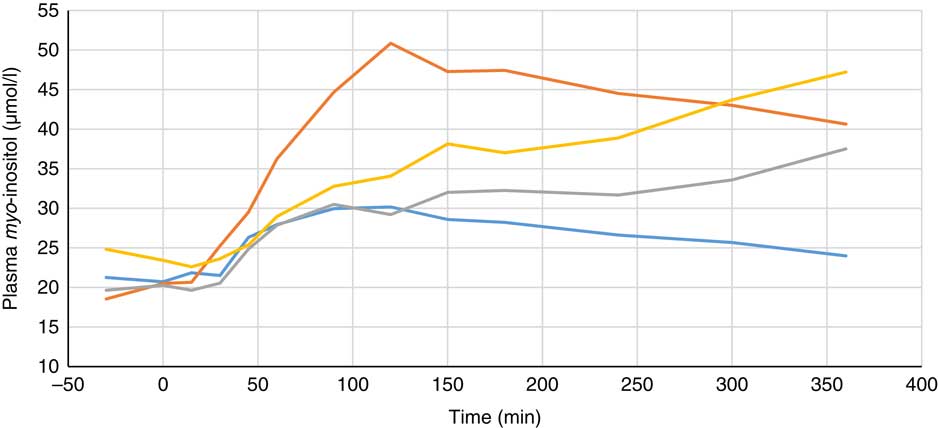
Fig. 3 Effect of feeding myo-inositol or phytase (1000 or 3000 phytase units (FYT)/kg) on plasma myo-inositol concentration in pigs (n 8). ![]() , Control;
, Control; ![]() , myo-inositol;
, myo-inositol; ![]() , 1000 FYT/kg;
, 1000 FYT/kg; ![]() , 3000 FYT/kg. All three dietary treatments were higher than control at 360 min (ANCOVA, P<0·05 each).
, 3000 FYT/kg. All three dietary treatments were higher than control at 360 min (ANCOVA, P<0·05 each).
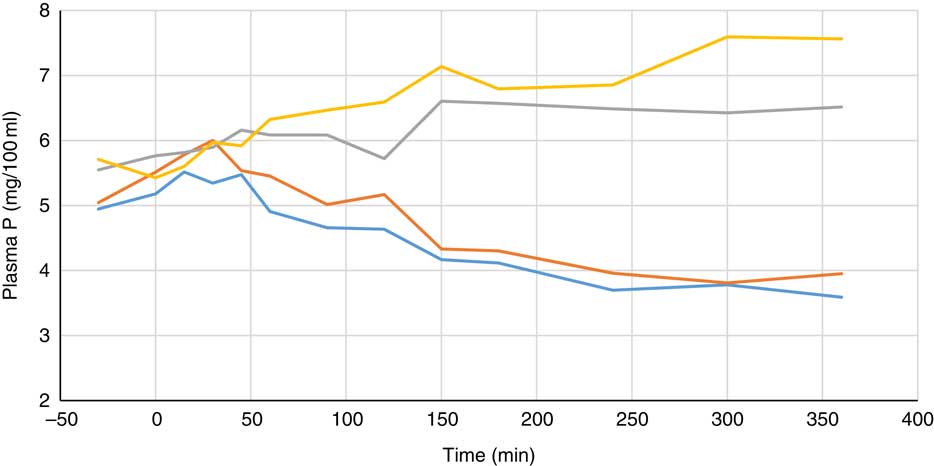
Fig. 4 Effect of feeding myo-inositol or phytase (1000 or 3000 phytase units (FYT)/kg) on plasma phosphorus concentration (mg/100 ml) in pigs (n 8). ![]() , Control;
, Control; ![]() , myo-inositol;
, myo-inositol; ![]() , 1000 FYT/kg;
, 1000 FYT/kg; ![]() , 3000 FYT/kg. The concentrations in the 1000 and 3000 FYT/kg were higher at 360 min than those in the control group and the myo-inositol group (ANCOVA, P<0·001 for each comparison).
, 3000 FYT/kg. The concentrations in the 1000 and 3000 FYT/kg were higher at 360 min than those in the control group and the myo-inositol group (ANCOVA, P<0·001 for each comparison).
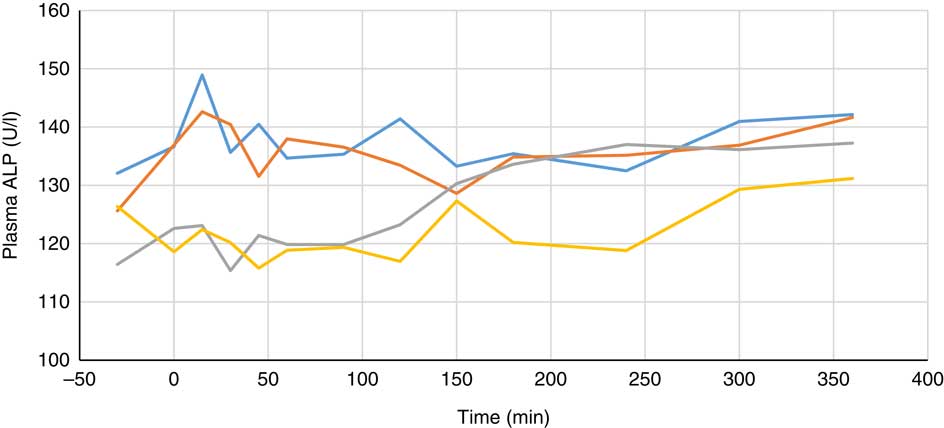
Fig. 5 Effect of feeding myo-inositol or phytase (1000 or 3000 phytase units (FYT)/kg) on plasma alkaline phosphatase (ALP) activity in pigs (n 8). ![]() , Control;
, Control; ![]() , myo-inositol;
, myo-inositol; ![]() , 1000 FYT/kg;
, 1000 FYT/kg; ![]() , 3000 FYT/kg. No differences among any groups were observed at 360 min (ANCOVA, P>0·05).
, 3000 FYT/kg. No differences among any groups were observed at 360 min (ANCOVA, P>0·05).
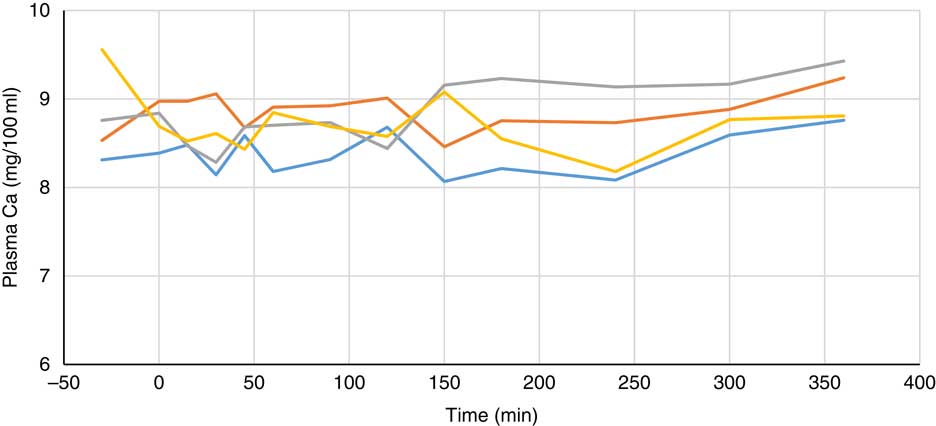
Fig. 6 Effect of feeding myo-inositol or phytase (1000 or 3000 phytase units (FYT)/kg) on plasma calcium concentration (mg/100 ml) in pigs (n 8). ![]() , Control;
, Control; ![]() , myo-inositol;
, myo-inositol; ![]() , 1000 FYT/kg;
, 1000 FYT/kg; ![]() , 3000 FYT/kg. No differences among any groups were observed at 360 min (ANCOVA, P>0·05).
, 3000 FYT/kg. No differences among any groups were observed at 360 min (ANCOVA, P>0·05).
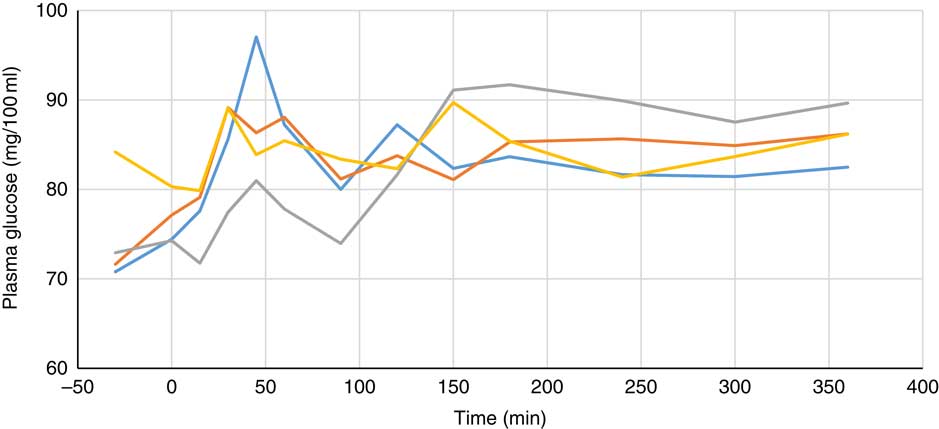
Fig. 7 Effect of feeding myo-inositol or phytase (1000 or 3000 phytase units (FYT)/kg) on plasma glucose concentration (mg/100 ml) in pigs (n 8). ![]() , Control;
, Control; ![]() , myo-inositol;
, myo-inositol; ![]() , 1000 FYT/kg;
, 1000 FYT/kg; ![]() , 3000 FYT/kg. No differences among any groups were observed at 360 min (ANCOVA, P>0·05).
, 3000 FYT/kg. No differences among any groups were observed at 360 min (ANCOVA, P>0·05).
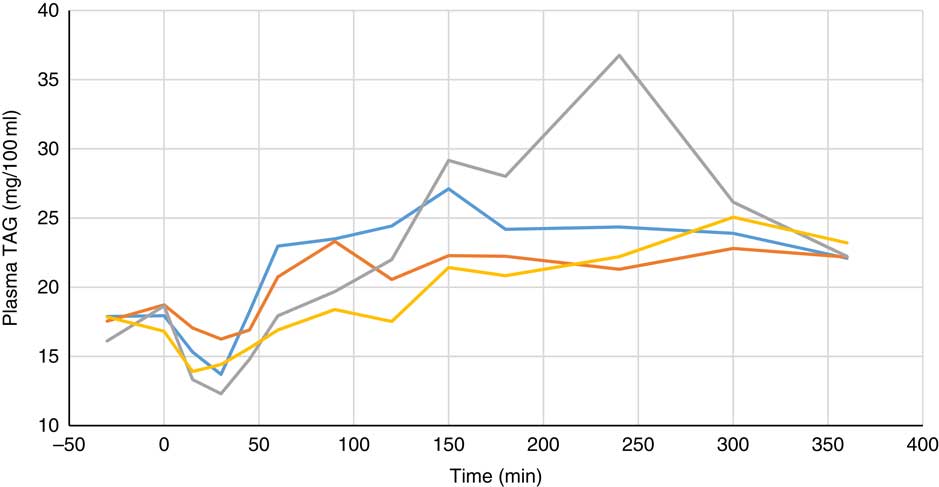
Fig. 8 Effect of feeding myo-inositol or phytase (1000 or 3000 phytase units (FYT)/kg) on plasma TAG concentration (mg/100 ml) in pigs (n 8). ![]() , Control;
, Control; ![]() , myo-inositol;
, myo-inositol; ![]() , 1000 FYT/kg;
, 1000 FYT/kg; ![]() , 3000 FYT/kg. No differences among any groups were observed at 360 min (ANCOVA, P>0·05).
, 3000 FYT/kg. No differences among any groups were observed at 360 min (ANCOVA, P>0·05).
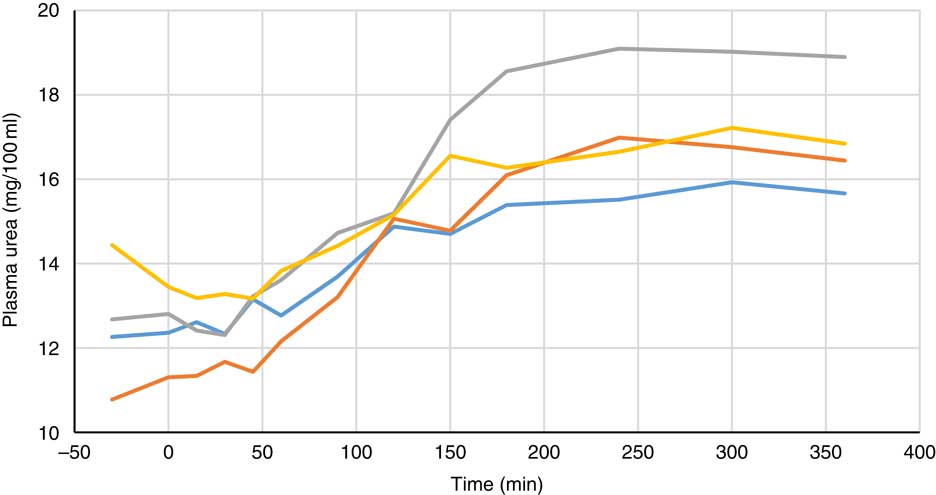
Fig. 9 Effect of feeding myo-inositol or phytase (1000 or 3000 FYT/kg) on plasma urea concentration (mg/100 ml) in pigs (n 8). ![]() , Control;
, Control; ![]() , myo-inositol;
, myo-inositol; ![]() , 1000 FYT/kg;
, 1000 FYT/kg; ![]() , 3000 FYT/kg. Although urea concentration increased over time (P<0·01), no differences among any groups were observed at 360 min (ANCOVA and regression, P>0·05).
, 3000 FYT/kg. Although urea concentration increased over time (P<0·01), no differences among any groups were observed at 360 min (ANCOVA and regression, P>0·05).
Table 2 Plasma metabolites from pigs (n 8) fed a control diet, myo-inositol or phytase (1000 or 3000 phytase units (FYT)/kg) at time 0 (0 min) (Mean values and standard deviations)
ALP, alkaline phosphatase.
Table 3 Plasma metabolites from pigs (n 8) fed a control diet, myo-inositol or phytase (1000 or 3000 phytase units (FYT)/kg) after 360 min (Mean values and standard deviations)
ALP, alkaline phosphatase.
a,bMean values in columns with unlike superscript letters were significantly different at the level indicated in the probability column.
Discussion
Results presented herein show clear and significant responses to plasma myo-inositol when myo-inositol is fed directly or if exogenous phytase is added to the diet. The net result (after 360 min of feeding) on plasma myo-inositol concentration was similar for the oral supply of myo-inositol or exogenous phytase (either 1000 or 3000 FYT/kg). However, the rate of appearance of myo-inositol in plasma was greater when myo-inositol was added directly to the diet compared with exogenous phytase. For example, 120 min post-feeding, plasma myo-inositol concentration was significantly higher in the pigs that received myo-inositol than in pigs that received phytase. This suggests that exogenous phytase generates a slow release of myo-inositol that accumulates more slowly in plasma than is the case for a dietary supply of myo-inositol. Whether this influences the biological response to myo-inositol is not clear. However, data presented herein imply a regulation of plasma myo-inositol (increasing till approximately 120 min after feeding and a subsequent decrease), perhaps via insulin-like mechanisms. Myo-inositol is rapidly metabolised into glucuronate by myo-inositol oxygenase (EC 1.13.99.1) in the kidneys followed by urinary excretion( Reference Clements and Diethelm 23 ). Thus, the concentration of myo-inositol is expected to fall following initial peak concentration due to this excretion. The time frame for the maximal peak of serum myo-inositol concentration observed in this study (120 min) is similar to the range of 90–180 min observed in humans who were orally administered myo-inositol( Reference Groenen, Merkus and Sweep 24 ). Furthermore, myo-inositol has recently been found to be an insulin mimetic( Reference Dang, Mukai and Yoshida 25 ), stimulating the translocation of GLUT4 (the primary insulin-sensitive GLUT in mammals) to the plasma membrane( Reference Dang, Mukai and Yoshida 25 , Reference Yamashita, Yamaoka and Hasunuma 26 ). Thus, myo-inositol may have ‘pronutrient’ effects or have involvement in aspects of gluconeogenesis or protein accretion, with obvious implications for animal agriculture. Indeed, effects of phytase and myo-inositol on pathways downstream of IGF-1, for example phosphatidylinositol-3-kinase have recently been reported in poultry( Reference Schmeisser, Seon and Aureli 27 ).
It is possible that the slower release of myo-inositol generated by phytase results in a less acute insulin-like response and may allow a higher plasma concentration to be sustained. This hypothesis requires further elucidation and may require sampling for a longer duration (up to 6–8 h or more). Nonetheless, the addition of 1000 FYT/kg and particularly 3000 FYT/kg of phytase resulted in plasma myo-inositol concentrations similar to that achieved by addition of 2 g/kg myo-inositol directly to the diet. As phytic acid contains approximately 30 % myo-inositol( Reference Yamashita, Yamaoka and Hasunuma 26 ), this equates to the complete dephosphorylation of about 6 g/kg phytic acid to myo-inositol and free phosphate within 4 h after introduction of phytase.
Most of the measured plasma metabolites in the present experiment were not influenced by dietary treatment and did not vary significantly over time. The lack of effect of phytase and myo-inositol on plasma glucose and TAG is in agreement with previous observations( Reference Zyla, Dulinski and Pierzchalska 15 , Reference Cowieson, Ptak and Mackowiak 16 ). However, plasma P concentrations were increased by the supplementation of the diet with both 1000 and 3000 FYT/kg phytase and this increase was sustained over the duration of the sampling process compared with the control diet or the diet supplemented with myo-inositol (Table 3, Fig. 6). The change in plasma P associated with phytase is perhaps a little unexpected given the close regulation of plasma P by the parathyroid hormone and associated mechanisms( Reference Proszkowiec-Weglarz and Angel 28 ). However, it is possible that these homoeostatic mechanisms take longer than 6 h to establish equilibrium given the complex interplay between vitamin D, plasma Ca and P, skeletal P and Ca, etc., and so a longer duration of sampling may be required to identify whether these phytase-mediated effects on plasma P are of long-term significance. The lack of response of plasma Ca concentration is also notable and it may be that plasma Ca is more tightly regulated than plasma P given that phytase effects on Ca absorption are consistent and significant( Reference Selle, Cowieson and Ravindran 8 ).
It is concluded that the oral delivery of myo-inositol or phytase supplementation are effective at increasing plasma myo-inositol concentrations in pigs. Direct addition of myo-inositol to the diet results in a more rapid appearance of myo-inositol in plasma and this may be regulated via homoeostatic mechanisms, putatively involving insulin-like mechanisms( Reference Zyla, Dulinski and Pierzchalska 15 , Reference Cowieson, Ptak and Mackowiak 16 , Reference Schmeisser, Seon and Aureli 27 ). Exogenous phytase addition at either 1000 or 3000 FYT/kg results in similar plasma myo-inositol concentration changes in plasma to the addition of 2 g/kg myo-inositol although the rate of appearance of myo-inositol (and perhaps regulatory responses) is slower. Plasma P concentration is plastic, at least in the short-term (within 6 h post-feeding) and reacts to dietary phytase supplementation but not to oral delivery of myo-inositol. Given that P and myo-inositol are the final end-products of phytic acid hydrolysis, the dynamic appearance of these metabolites in the plasma of pigs (and potentially poultry) may prove useful biomarkers of phytase bioefficacy and other strategies to enhance the degradation of phytic acid in the intestine.
Acknowledgements
This work was financially supported by DSM Nutritional Products, Kaiseraugst, Switzerland.
A. J. C., O. A., J.-P. R., P. G. and J. W. W. designed the experiment and set the experimental question. F. F. R. conducted the statistical analysis with input from A. J. C.. H. L., O. A. and K. M. A. conducted the animal experimental work. P. G. conducted the laboratory analysis. A. J. C. wrote the first draft of the manuscript to which all other authors then contributed edits and interpretative remarks.
The authors declare that there are no conflicts of interest.


