


INTRODUCTION
With ~100,000 affected individuals, Canada has one of the highest rates of multiple sclerosis (MS) in the world. 1 Despite the high prevalence, precise estimates of epidemiology are missing for some Canadian regions. The etiology of MS remains elusive but evidence suggests geographic and environmental factors, including genetic heterogeneity, may play an important role.Reference Ebers 2 Establishing incidence and prevalence in specific regions can contribute to the understanding of etiologic factors and inform decisions related to resource allocation and access to MS care and supports.Reference Poppe, Wolfson and Zhu 3
Several methods exist for determining the incidence and prevalence of a disease, including the use of health administrative data. In Canada, two well-recognized definitions for identifying cases of MS from administrative data exist, with differing potential strengths and limitations, and have been used to estimate the incidence and prevalence in several provinces.Reference Marrie, Yu and Blanchard 4 , 5
The province of Saskatchewan is often cited as having one of the highest rates of MS in Canada,Reference Hader and Yee 6 , Reference Beck, Metz and Svenson 7 yet population-wide estimates have never been reported from this region. The purpose of this study was twofold: to test two case definitions of MS using health administrative databases; and to establish valid estimates of the incidence and prevalence of MS in Saskatchewan.
METHODS
Data Source
Saskatchewan has a stable population of just over one million people. 8 Almost all (99%) residents of Saskatchewan are entitled to publicly funded provincial health care benefits apart from those covered federally, including members of the Canadian Forces, Royal Canadian Mounted Police, and federal inmates. 9 The Saskatchewan government maintains several databases that record health services delivered to provincial beneficiaries including physician claims, hospital visits, prescription drugs, vital statistics, and population registry information. 9 Diagnoses are recorded using International Classification of Disease (ICD) codes. In the hospital discharge database, diagnoses were reported using the ninth revision (ICD-9) until 2002, and currently use ICD-10-CA. Diagnoses in physician claims data are recorded using three-digit ICD-9 codes. 9 The prescription drug database records medication dispensations for medications. All demographic information was obtained from the population registry. 9
Identification of Cases and Controls for Validation
A random sample of 200 patients with clinically definite MS were identified from the provincial MS clinic in Saskatchewan. Patients received their diagnosis from specialists providing clinical services according to prevailing diagnostic criteria.Reference Poser, Paty and Scheinberg 10 - Reference Polman, Reingold and Banwell 13 In addition, 200 individuals without an MS diagnosis (“controls”) were randomly selected from the Inpatient Rehabilitation Center database. This database captures diagnostic information (via tick boxes) on numerous chronic diseases, one of which is MS. 14 Health region employees not involved with the study randomly selected cases and controls from these databases, and only de-identified information was released to researchers.
Case Definitions and Validation
Two case definitions for MS were applied to cases and controls between January 1, 1996 and December 31, 2015. The first definition required ≥3 hospital, physician, or drug claims, and has been previously validated by Marrie et al., and used in other Canadian provinces and observational research.Reference Marrie, Blanchard, Leung and Elliot 15 - Reference Marrie, Stadnyk and Yu 21 The second definition, released by the Canadian Chronic Disease Surveillance System (CCDSS), required ≥1 hospitalization or ≥5 physician claims within 2 years. 5 Hospital transfers and re-admissions within 1 day of a discharge date were considered as one hospitalization episode and collapsed into a single hospital claim. We selected these definitions because they have been previously validated or used in other Canadian studies.Reference Marrie, Blanchard, Leung and Elliot 15 , Reference Kingwell, Marrie and Fisk 20 - Reference Widdifield, Ivers and Young 22 As a complementary analysis, we also tested several other case definitions (Table S1) to allow for comparability with other Canadian studies or for situations where a potentially more sensitive or more specific definition may be warranted.
For each administrative case definition, the sensitivity (proportion of true positives correctly identified), specificity (proportion of true negative correctly identified), positive predictive value (PPV), and negative predictive value (NPV) (with a 95% confidence interval [CI]) were calculated as compared with the reference standard. A κ statistic was used to estimate the agreement between the administrative case definition and the medical records identification for each case definition where neither was considered the gold standard. We estimated that a sample of 200 MS cases and 200 non-MS controls would allow us to detect a sensitivity of 90% and specificity of 85%.
Incidence
As MS is a diagnosis of exclusion, patients may present with symptoms suggesting the disease before a confirmed diagnosis. Thus, for all patients meeting the case definition of MS, the date of diagnosis (“index date”) was identified as the earlier of: the first date of medical contact for MS (ICD-9: 340/ICD-10: G35), or a diagnosis of a related demyelinating conditions (acute disseminated demyelination [ICD-10: G36], neuromyelitis optica [ICD-9: 341.0/ICD-10: G36.0], demyelinating disease of central nervous system (CNS) unspecified [ICD-9: 341.9/ICD-10: G37.9], acute disseminated encephalomyelitis [ICD-9: 323/ICD-10: G36.9], optic neuritis [ICD-9: 377.3/ICD-10: H46], and acute transverse myelitis [ICD-9: 323.82/ICD-10: G37]).Reference Marrie, Blanchard, Leung and Elliot 15 This allowed for a more accurate date of incidence based on disease onset rather than disease diagnosis, which may be delayed.Reference Marrie, Blanchard, Leung and Elliot 15
The incident MS population consisted of those meeting the case definition with an index date in the given calendar year. Population figures on January 1 for the respective year were used as the denominator, with prevalent MS cases from previous years removed. Results were standardized to the 2001 Canadian Census to allow for comparability with previous studies. A 5-year run-in period with no other claims for MS or demyelinating conditions was used to ensure that the identified cases were indeed incident. However, because the CCDSS recommended an 8-year run-in period to detect incidence in MS, 5 a sensitivity analysis using an 8-year run-in period was also conducted to evaluate the effect of different run-in periods on incidence estimates.
Prevalence
Prevalent MS cases were identified for each calendar year from 2001 to 2013 using both case definitions. Cases of MS were considered prevalent until their death or loss of health coverage (emigration). Population figures from January 1 for each year were used as the denominator. Prevalence was estimated annually and adjusted for sex and age via the direct methodReference Dohoo, Martin and Stryhn 23 to the 2001 Canadian census.
This study was approved by the University of Saskatchewan’s Biomedical Research Ethics Board. Data access were approved by the Saskatchewan Ministry of Health and the Saskatchewan Health Quality Council.
RESULTS
Validation of definitions
A total of 400 cases and controls were identified from the Saskatoon MS Clinic (n=200) and the Inpatient Rehabilitation Centre database (n=200). There were more females in the MS case group (66.5%) compared with the non-MS control group (35.0%), and the control group was older, with a mean age of 65.0 (SD 19.2) years compared with 53.8 (SD 12.6) years. The Marrie definition (≥3 hospital, physician, or drug claims) had a sensitivity of 99.5% (95% CI 92.3-99.2), specificity of 98.5% (95% CI 97.3-100.0), PPV of 99.5 % (95% CI 97.2-100.0) and NPV of 97.5% (95% CI 94.4-99.2). The CCDSS definition (≥1 hospitalization or ≥5 physician claims within 2 years) had a sensitivity of 91.0% (95% CI 81.2-94.6), specificity of 99.0% (95% CI 96.4-99.9), PPV of 98.9% (95% CI 96.1-99.9), and NPV of 91.7% (95% CI 87.2-95.0). Agreement between the clinical and administrative cohorts was high with a κ of 0.97 (95% CI 0.95-0.99) for the Marrie definition and 0.90 (95% CI 0.85-0.94) for the CCDSS definition. The complementary analyses revealed that, in general, sensitivity was higher for those definitions requiring fewer claims and those with a longer, or unlimited timeframe (Table S2).
Incidence
Between 2001 and 2013, 2226 incident cases of MS were identified with the Marrie definition and 1903 were identified with the CCDSS definition. Approximately 70% of identified cases were women, with a mean age of 43 years during the year of “diagnosis”. Other characteristics of identified cases were similar between the definitions (Table 1). In 2013, the age- and sex-standardized incidence of MS per 100,000 was 16.3 (95% CI 13.8-18.8) for the Marrie definition and 12.1 (95% CI 9.9-14.2) for the CCDSS definition (Table 2). Between 2001 and 2013, the average annual adjusted incidence per 100,000 was 16.5 (95% CI 15.8-17.2) using the Marrie definition, and 14.1 (95% CI 13.5-14.8) with the CCDSS definition (Tables 3A and 3B). For both definitions, incidence was highest in 2001, and became relatively stable after 2005 (Figure 1). Peak incidence occurred between the ages of 35-39 for both sexes and was similar between definitions with 24.2 (95% CI 21.1-27.4) per 100,000 for Marrie and 22.1 (95% CI 19.1-25.1) per 100,000 for CCDSS (Tables 2, 3A and 3B). The incidence of MS in females was higher than in males with an overall rate ratio of 2.21 (95% CI 2.02-2.42) for the Marrie definition, and 2.13 (95% CI 1.94-2.35) for the CCDSS definition (Tables 3A and 3B).
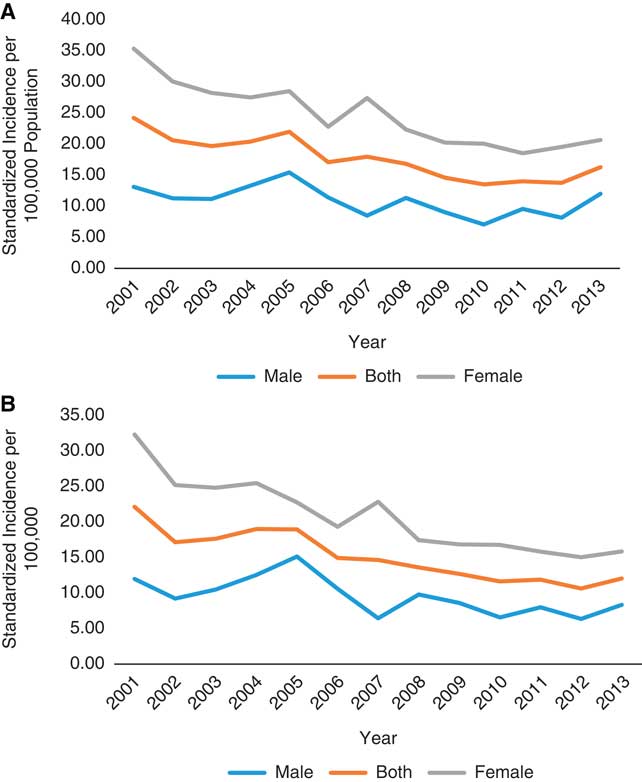
Figure 1 Age-standardized incidence of multiple sclerosis per 100,000 in Saskatchewan, 2001-2013. (A) Marrie definition: ≥3 hospital, physician, or drug claims. (B) Canadian Chronic Disease Surveillance System definition: ≥1 hospitalization or ≥5 physician claims within 2 years.
Table 1 Characteristics of incident (2001-2013) and prevalent multiple sclerosis (MS) cases (2013) for Marrie and Canadian Chronic Disease Surveillance System (CCDSS) definitions
DMT=disease-modifying therapy; SES=socioeconomic status.
Marrie definition: ≥ hospital, physician, or drug claims. CDSS definition: ≥1 hospital or ≥5 physician claims in 2 years.
* Time between first MS claim and satisfying the case definition.
** Sum of percentages may not add up to 100 as the figures were rounded. χ 2 test for homogeneity was used to test for equal distribution between SES quintiles (missing cases were excluded), p-value≤0.0001.
Table 2 Age- and sex-standardized incidence of multiple sclerosis (MS) in Saskatchewan per 100,000, 2001-2013
CCDSS=Canadian Chronic Disease Surveillance System; CI=confidence interval.
Table 3A Average annual incidence of multiple sclerosis (MS) in Saskatchewan by age and sex per 100,000, 2001-2013 (Marrie definition)
AAI=average annual incidence; CI=confidence interval.
Marrie definition: ≥3 hospital, physician, or drug claims.
Table 3B Average annual incidence of multiple sclerosis (MS) in Saskatchewan by age and sex per 100,000, 2001-2013 (CCDSS definition)
AAI=average annual incidence; CI=confidence interval.
Canadian Chronic Disease Surveillance System (CCDSS) definition: ≥1 hospitalization or ≥5 physician claims within 2 years.
The annual change in incidence rate over time was similar regardless of whether a 5- or 8-year run-in period was applied for the Marrie (−0.0503 [SE 0.0176] vs. −0.0569 [SE 0.0270]) and CCDSS definitions (−0.0622 [SE 0.0192] vs. −0.0745 [SE 0.0296]).
Prevalence
As of July 1, 2013, 3456 individuals with MS resided in Saskatchewan according to the Marrie definition, versus 2998 based on the CCDSS definition. In 2013, the age- and sex-standardized prevalence of MS per 100,000 was 313.6 (95% CI 303.0-324.3) using the Marrie definition, and 248.7 (95% CI 239.2-258.2) using the CCDSS definition (Table 4). The prevalence was higher in females than in males, with a female to male ratio of 2.42 (95% CI 2.37-2.48) with the Marrie definition and 2.36 (95% CI 2.30-2.42) with the CCDSS definition (Tables S4a and S4b). Irrespective of the definition used, the prevalence increased gradually between 2001 and 2010 but stabilized thereafter (Figure 2). For both definitions, the age at which prevalence peaked increased over time (Figure 3).
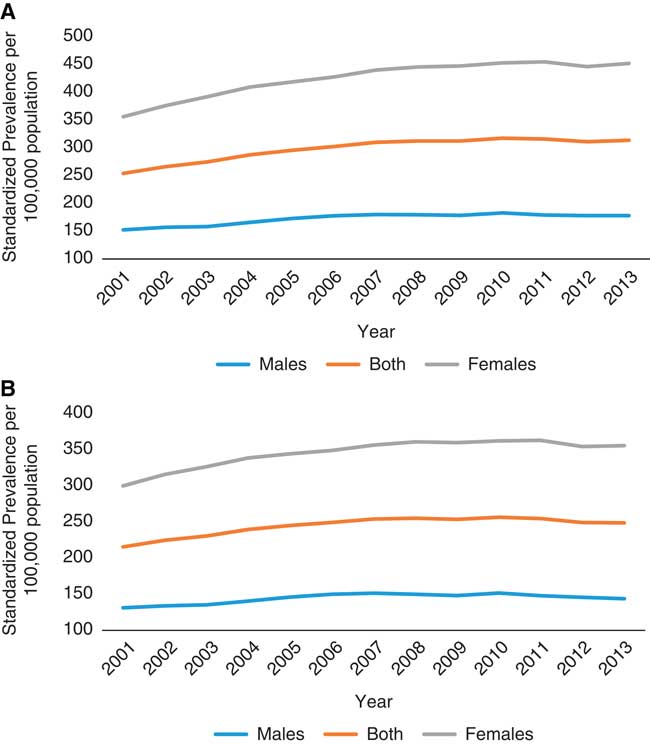
Figure 2 Age-standardized prevalence for multiple sclerosis in Saskatchewan per 100,000 between 2001 and 2013. (A) Marrie definition: ≥3 hospital, physician, or drug claims. Change in prevalence over time=4.84. (B) Canadian Chronic Disease Surveillance System definition: ≥1 hospitalization or ≥5 physician claims within 2 years.
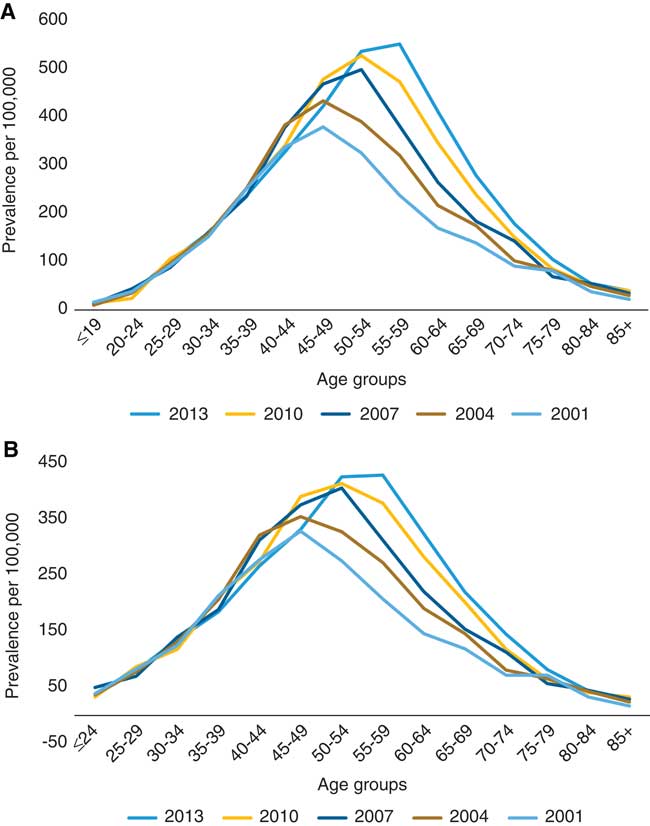
Figure 3 Age-specific prevalence of multiple sclerosis in Saskatchewan per 100,000, 2001-2013. (A) Marrie definition: ≥3 hospital, physician, or drug claims. (B) Canadian Chronic Disease Surveillance System definition: ≥1 hospitalization or ≥5 physician claims within 2 years.
Table 4 Age-standardized prevalence of multiple sclerosis (MS) in Saskatchewan per 100,000 by sex, 2001-2013

CCDSS=Canadian Chronic Disease Surveillance System; CI=confidence interval.
DISCUSSION
The results of this first-ever province-wide examination of incidence and prevalence confirm that Saskatchewan has one of the highest rates of MS in Canada, and worldwide. We found that the Marrie definition (≥3 claims for MS) had a higher sensitivity, PPV, and NPV when compared with the CCDSS definition (≥1 hospitalization or ≥5 physician claims within 2 years); specificity was similar between the two definitions. The estimated incidence and prevalence of MS in Saskatchewan were higher using the more sensitive Marrie definition compared with the CCDSS definition. Although differences in the rates appear small, the Marrie definition identifies an additional 450 prevalent cases in 2013 out of a provincial population of 1.1 million. As a result, the Marrie definition may be preferred from a health policy perspective considering the high costs associated with MS will have a significant impact on health system resources.Reference Amankwah, Marrie and Bancej 24 , 25
In 2013, 314 individuals per 100,000 in Saskatchewan were identified as having MS. A previous study estimated a prevalence of 340 per 100,000 but examined the prairie region, combining data from the 2000/2001 Canadian Community Health Survey for Alberta, Saskatchewan, and Manitoba, and relied on a very small number of cases (n<80).Reference Beck, Metz and Svenson 7 Hader et al.Reference Hader and Yee 6 used medical records to estimate a prevalence of 298 per 100,000 but only included the Saskatoon area, not the entire province.
The prevalence of MS has been determined in several Canadian provinces, but methodological differences in disease surveillance can make comparisons difficult. Therefore, we utilized two case definitions that have been previously applied to health administrative data in Canada—to allow for comparability across provinces. The first definition by Marrie et al.Reference Marrie, Blanchard, Leung and Elliot 15 , was initially validated in Manitoba, has been used in other provinces, and is regularly used.Reference Wijnands, Kingwell and Zhu 16 - Reference Marrie, Stadnyk and Yu 21 The age-adjusted prevalence of MS in Manitoba in 2006 was 262 per 100,000 and the average age-adjusted annual incidence was 13.4 per 100,000 between 1998 and 2006.Reference Marrie, Blanchard, Leung and Elliot 15 The estimates observed in Saskatchewan using this same definition were higher: the standardized prevalence of MS was 302 per 100,000 in 2006, and the standardized annual incidence was 16.5 per 100,000 between 2001 and 2013.
The second definition has been validated in Ontario,Reference Widdifield, Ivers and Young 22 and is the definition that has been recently recommended by the CCDSS in part because it does not require prescription claims, which are not universally available across Canada. 5 The age- and sex-standardized prevalence of MS in Ontario in 2010 was 207 per 100,000, compared with 256 per 100,000 in Saskatchewan for the same year.Reference Widdifield, Ivers and Young 22
In British Columbia and Nova Scotia, MS cases were defined as having ≥7 claims for MS for individuals with >3 years of residency or ≥3 claims if ≤3 years of residency. In Nova Scotia, the age-standardized prevalence of MS in 2010 was estimated to be 267 per 100,000 with an average annual incidence was 9.77 per 100,000 from 1995 to 2010. When a three claim definition (regardless of residency time) was tested, the crude prevalence in 2010 was 326.3 per 100,000.Reference Marrie, Stadnyk and Yu 21 In British Columbia, the age-standardized prevalence of MS in 2008 was 180 per 100,000 with an average annual incidence of 7.8 per 100,000 from 1996 to 2008.Reference Kingwell, Marrie and Fisk 20 Similar to Nova Scotia, the more sensitive ≥3 claim definition revealed a higher standardized annual incidence (10.9 per 100,000) and prevalence (235.8 per 100,000).Reference Kingwell, Marrie and Fisk 20
Regional variation in the prevalence of MS across Canada has been demonstrated previously, and may be due to environmental differences and variations in the ethnic makeup (i.e., inherited risk of developing MS) of the populations.Reference Poppe, Wolfson and Zhu 3 , Reference Beck, Metz and Svenson 7 , Reference Widdifield, Ivers and Young 22 This may help to explain the differences seen between the prevalence in British Columbia and Nova Scotia, both of which are coastal provinces compared with landlocked Saskatchewan. Interestingly, the incidence and prevalence of MS was higher in Saskatchewan than Manitoba – two provinces of similar location, size, and population demographics. However, variations in genetic and environmental risks could still play a role, as has been noted in other countries over small geographic distances.Reference McGuigan, Dunne and Crowley 26 Another possible explanation for this inconsistency may be differences in health care policies and practice patterns between provinces.
Similar to other provinces, we observed a relatively stable incidence, but a gradual increase in prevalence. This increase in prevalence may be attributed to earlier diagnosisReference Marrie, Cutter and Tyry 27 due to improved access to neurologistsReference Poppe, Wolfson and Zhu 3 and the emergence of more accurate diagnostic techniques (i.e., MRI),Reference Warren, Svenson and Warren 28 and longer survival, rather than an actual increased risk of disease.Reference Koch-Henriksen and Sorensen 29 Duration of observation may also affect the prevalence estimate; a longer observation period may capture milder or inactive cases of MS.Reference Ng, Bernatsky and Rahme 30 A shifting in peak prevalence to older ages over time (representing an aging population) is also consistent with findings from Manitoba, Nova Scotia, and British Columbia,Reference Marrie, Blanchard, Leung and Elliot 15 , Reference Kingwell, Marrie and Fisk 20 , Reference Marrie, Stadnyk and Yu 21 and studies of mortality rates, which suggest an improved survival in individuals with MS.Reference Kingwell, van der Kop and Zhao 31 , Reference Warren, Janzen and Warren 32 We observed a “peak” in incidence in 2001, the same year new diagnostic criteria introduced the use of MRI to facilitate the diagnosis of MS, which may have contributed to the increase in MS cases rather an actual increase in disease risk during that period. However, as this was the first year that incidence was measured, it is also likely that prevalent cases were incorrectly identified as incident during this year.
Although health administrative data are considered a reliable method for estimating incidence and prevalence, individuals who do not have frequent contact with the health care system may be missed, resulting in an underestimation of the disease. Indeed, a previous study in Quebec found that the prevalence of systematic lupus erythematosus, another relapsing remitting disease where contacts with the health system varied, was underestimated when using an observation period of 5 years versus 15 years.Reference Ng, Bernatsky and Rahme 30 This is more likely to have happened in our study with the CCDSS definition which required claims occur within a 2-year period, compared with the Marrie definition which had no time limit, and was able to utilize almost two decades of data. This may also have been augmented due to billing practices in Saskatchewan; although many physicians who receive alternate payments (i.e. non-fee-for-service) submit shadow (dummy) claims which are captured in health administrative data, the physicians at the provincial MS clinic did not shadow bill during the study period. Therefore, not all encounters for MS may have been captured reliably. This is more likely to have impacted the CCDSS definition which may result in estimates that could possibly underestimate of the true burden of MS. The two reference data sources captured diagnoses differently which could introduce ascertainment bias. However, clinicians prospectively recorded the diagnoses in both cases which would be expected to limit the bias. A further limitation is the potential for misclassifying prevalent cases as incident. However, in a sensitivity analysis, we used an 8-year run-in period to identify incident cases, and found the change in incidence rates over time estimated with the 5-year run-in period to be very similar.
We confirmed that Saskatchewan has one of the highest rates of MS in Canada, and worldwide. The Public Health Agency of Canada estimated the annual per capita health care cost (excluding out-of-pocket expenses) for adults in 2011 was ~$16,800 for individuals with MS, compared with $2500 for those without a neurological condition. 25 This, combined with a high prevalence and longer survival means MS will continue to place a significant burden on society and the health care system.Reference Amankwah, Marrie and Bancej 24 A more complete understanding of the burden of MS in Saskatchewan will not only help with future health care planning and resource allocation, but will also contribute toward research attempting to better understand the etiology of MS.
Acknowledgment
Funding for this study was provided by the Saskatchewan Health Research Foundation (SHRF). The results and conclusions are those of the authors and no official endorsement by SHRF, the Saskatchewan Ministry of Health, or the Saskatchewan Health Quality Council should be inferred.
Statement of Authorship
CDE obtained funding for the project. LHA and CDE drafted the manuscript. RAM, DRB, and KBK were involved with the interpretation of the study results, and critically reviewed the manuscript. All authors approved the final version of the manuscript.
Conflicts of Interest
LHA declares no conflicts. RAM receives research funding from: Canadian Institutes of Health Research, Research Manitoba, Multiple Sclerosis Society of Canada, Multiple Sclerosis Scientific Foundation, National Multiple Sclerosis Society, Crohn’s and Colitis Canada, the Waugh Family Chair in Multiple Sclerosis and the CMSC. DFB is the Chair in Patient Adherence to Drug Therapy within the College of Pharmacy and Nutrition, University of Saskatchewan. This position was created through unrestricted financial support from AstraZeneca Canada, Merck Canada, Pfizer Canada, and the Province of Saskatchewan’s Ministry of Health. KBK has received grant funding from the Saskatoon City Hospital Foundation and the Multiple Sclerosis Society of Canada. CDE receives research funding from: Canadian Institutes of Health Research, the Saskatchewan Health Research Foundation, and the Multiple Sclerosis Society of Canada.
Supplementary Material
To view supplementary material for this article, please visit https://doi.org/10.1017/cjn.2017.301


 Open access