Introduction
Primary health care (PHC) is the first point of contact to formal health care for the majority of the world’s populace and also a key strategy for achieving health in most countries of the world (World Health Organization, Reference Polit and Beck1978; Starfield, Reference Udonwa, Gyuse, Etokidem and Ogaji1998; Starfield et al., Reference Van Lerberghe2005). In Nigeria, PHC centres constitute about 90% of formal health facilities and is the source of health care services to the majority of the populace, especially in rural areas (FMOH, Nigeria, 2012a). PHC provides promotive, preventive, curative and rehabilitative services through community health practitioners (community health extension workers and community health officers), nurses, midwives or doctors who work in the different structural and functional grades of health centres (FMOH, Nigeria, 2012b). The development of PHC is a key strategy in strengthening Nigeria’s health system. In this regard, stakeholders recognise the need to improve community participation and ownership as one of its eight priority goals under the national strategic health development plan (FMOH, Nigeria, Reference Mead, Bower and Roland2010). While this would ensure that health services are more patient friendly and socially relevant to the population (Van Lerberghe, Reference Webster, Mantopoulos, Jackson, Cole-Lewis, Kidane, Kebede, Abebe, Lawson and Bradley2008), the involvement of patients and the community in the planning, development and management of PHC services is known to result in improving responsiveness, utilisation, quality, health outcomes and sustainability of PHC (Crawford et al., Reference Fitzpatric, Davey, Buxton and Jones2002; FMOH, Nigeria, Reference Meakin and Weinman2005; Reference Mead, Bower and Roland2010).
Essentially, patients’ participation in health care can be achieved through voluntary set-ups such as health consumers’ groups or by giving special attention to patients’ views during quality improvement (World Health Organization, Reference Ramsay, Campbell, Schroter, Green and Roland2006). For the latter, self or interviewer-administered questionnaires are commonly used to elicit feedback from patients after an encounter with PHC services (Wensing and Elwyn, 2002). These questionnaires are either developed through more extensive processes that are heavily dependent on patients or shorter processes that rely on subject experts (Fitzpatric et al., 1998; Wensing and Elwyn, 2002; Streiner and Norman, Reference Vukovic, Gvozdenovic, Gajic, Gajic, Jakovljevic and Mccormick2008). Irrespective of the above, draft items can be generated through inductive, deductive or a rational combination of both approaches (Hinkin, Reference Harmsen, Bernsen, Meeuwesen, Pinto and Bruijnzeels1998; Streiner and Norman, Reference Vukovic, Gvozdenovic, Gajic, Gajic, Jakovljevic and Mccormick2008). These are subjected to further refinement, and possible psychometric validation to determine important measurement properties such as the internal structures, reliability and validity of these questionnaires (Hinkin, Reference Harmsen, Bernsen, Meeuwesen, Pinto and Bruijnzeels1998; Streiner and Norman, Reference Vukovic, Gvozdenovic, Gajic, Gajic, Jakovljevic and Mccormick2008).
Despite progress in the development and use of valid and reliable questionnaires for assessing patient experiences of PHC in many settings, only a few have reference to settings in Sub-Saharan Africa (Haddad et al., Reference Grogan, Conner, Norman, Willits and Porter1998; Baltussen et al., Reference Baltussen, Ye, Haddad and Sauerborn2002; Webster et al., 2011). Regrettable, no questionnaire had been developed or validated for patient evaluation of PHC in Nigeria. Furthermore, there are difficulties associated with the wholesome transfer of questionnaires across sociocultural and practice settings. These could arise from faulty translations, irrelevant contents or poor resolution of semantic issues across cultures. Fielding a battery of contextually relevant items in a questionnaire intended for use by patients is necessary to drive patient-focussed quality improvement, and ultimately ensure that PHC services produce better outcomes (Van Lerberghe, Reference Webster, Mantopoulos, Jackson, Cole-Lewis, Kidane, Kebede, Abebe, Lawson and Bradley2008). These arguments reinforce the need to develop an appropriate measure for assessing the performance and also drive reforms in service delivery in the Nigerian PHC setting. Patient involvement in all phases of this questionnaire development would enhance its potential utility in making PHC services more socially relevant to present needs of the patients and responsive to local practice context within a rapidly changing world.
This research is thus aimed at using established guidelines to develop a valid and reliable measure for patient evaluation of PHC in the Nigerian setting.
Methods
Setting
Nigeria is constitutionally subdivided into States, Local Government Areas, and Wards. Nonetheless, the six geopolitical zones (three each in the north and south of Nigeria) have become major divisions in modern Nigeria as they reflect greater homogeneity in culture, religion and ethnolinguistic groups (Figure 1). The population has an equal male to female ratio, an annual growth rate of 3.2% and life expectancy at birth of 52 years (National Population Commission, Reference Comrey and Lee2006; National Planning Commission/ICF International, Reference Crawford, Rutter, Manley, Weaver, Bhui, Fulop and Tyrer2014). The provision of formal health care to Nigeria’s diverse geographic, linguistic, ethnic and religious constituents are through primary, secondary and tertiary facilities that are operated as public or private institutions. Primary health centres are located in a wide spectrum of developmental setting including hard-to-reach, rural, semi-urban and urban. Care recipients make the decision on particular health facility to attend and undertake initial visits often without prior appointment. Payment for these services is predominantly out-of-pocket at the point of access as only 3% of the population, including <2% of women aged 15–49 years enrolled in pre-payment plan (World Health Organization, Reference Roland, Roberts, Rhenius and Campbell2012; Lagomarsino et al., Reference Hinkin2012; National Planning Commission/ICF International, Reference Crawford, Rutter, Manley, Weaver, Bhui, Fulop and Tyrer2014).

Figure 1 Map of Nigeria showing its 36 states, the federal capital territory and the geographical zones
Development
A multi-phase, mixed methods research was used in the development of the full and shortened forms of patient evaluation scale (PES). The iterative development involving series of independent research and subsequent revisions were used in the generation of items, further refinement and validation of the questionnaire (Figure 2) as summarised below.

Figure 2 Phases in the development of the patient evaluation scale (PES). SF=short form.
Phase 1: item generation
Items were generated from the review of relevant literature and content analysis of 47 semi-structured interviews with PHC patients. We undertook a systematic review of studies on patients’ views of PHC in Sub-Saharan African (Ogaji et al., Reference Ogaji, Giles, Daker-White and Bower2015) and a second review of measures developed for patient evaluation of PHC globally. Studies were identified through systematic searches of Medline, CINAHL Plus, EMBASE and PsycINFO databases.
The appropriateness, acceptability and measurement properties of identified measures were evaluated based on recommended criteria (Fitzpatric et al., 1998; Bowling, Reference Bowling2014). The adapted checklist used in the assessment of these measures include the following:
-
(a) Are contents relevant to Nigeria cultural and practice setting?
-
(b) Are contents truly patient-based?
-
(c) Will the use of the instrument cause a high burden to patients and administrators?
-
(d) Has the instrument been validated for use in Nigeria?
-
(e) Has the instrument been validated for use in Sub-Saharan Africa?
-
(f) Can the instrument measure the structure–process–outcome dimensions of quality?
-
(g) Are reports on reliabilities of all scales adequate?
-
(h) Are reports on indices for assessing validity adequate?
The qualitative interviews explored the expectations of PHC patients and uncover items that could be used as scales in a questionnaire to assess patient experience of PHC in Nigeria. Maximum variation technique was used to purposefully recruit 47 patients based on the region of the country they live in (north or south), their gender, age (young, middle age and elderly) and health needs (curative or preventative services). Interview participants were visitors to four PHCs in Rivers State and the Federal Capital Territory in the southern and northern regions of Nigeria, respectively (Figure 1). Eligible interviewees were recruited from the stream of patients that visit these health centres. The sampling technique was not intended to achieve representativeness through equal probabilities but to ensure that the views of a wide range of PHC visitors are captured during the interviews. The verbatim transcripts of voice recordings and researcher’s annotations were analysed by content analysis and the coded responses from this analysis were grouped into concepts and categories.
Phase 2: face and content validity
Subject experts and patients are often involved during the face and content validation of questionnaires (Fitzpatric et al., 1998; Streiner and Norman, Reference Vukovic, Gvozdenovic, Gajic, Gajic, Jakovljevic and Mccormick2008). While face validity ensures that items measure what they were supposed to, content validity assures that the new questionnaire contains sufficient sample of items that are needed to measure the construct of interest (Polit and Beck, Reference Rosnow and Rosenthal2006; Streiner and Norman, Reference Vukovic, Gvozdenovic, Gajic, Gajic, Jakovljevic and Mccormick2008).
Face and content validation by experts. The involvement of experts in the quantitative and qualitative review of the content, style and clarity of items in a questionnaire is a common practice (Grant and Davis, 1997; Polit and Beck, Reference Rosnow and Rosenthal2006; Campbell et al., Reference Campbell, Smith, Nissen, Bower, Elliott and Roland2009; Hernan et al., Reference Halcomb, Caldwell, Salamonson and Davidson2015). The content validation of this questionnaire by local experts was through a modified Delphi technique. The process involved an initial quantitative rating and estimation of some agreement indices among six PHC experts with academic (two), practice (two) and policy (two) backgrounds, and then a qualitative examination of the remaining items.
The tasks of these experts were
-
(i) To rate each of the included items in the draft questionnaire on a four-point relevance scale (1 – not relevant, 2 – somewhat relevant, 3 – quite relevant, 4 – very relevant). Two forms of agreement were then calculated from this process:
-
(a) The inter-rater proportional agreement was calculated as the item-level content validity index (i-CVI) which gave the proportion of convergence rating of 3 or 4 on any item. The scale-level content validity index (s-CVI) represented the average proportion of all items rated 3 or 4 by these experts (Polit and Beck, Reference Rosnow and Rosenthal2006). Items with i-CVI⩾0.78 were considered quantitatively valid and relevant in the questionnaire and so were retained. An s-CVI⩾0.8 shows that the questionnaire contains an adequate sample of items needed to measure the latent construct (Lynn, Reference Lagomarsino, Garabrant, Adyas, Muga and Otoo1986; Polit and Beck, Reference Rosnow and Rosenthal2006; Yaghmale, Reference Yaghmale2003).
-
(b) The intra-class correlation coefficient (ICC) for absolute agreement among multiple raters was used to confirm that the calculated inter-rater proportional agreement was higher than what should be expected by chance (Streiner and Norman, Reference Vukovic, Gvozdenovic, Gajic, Gajic, Jakovljevic and Mccormick2008). The ICC is a more accurate measure of agreement than the generalised κ coefficients where observations are beyond the simple 2×2 agreement (Streiner and Norman, Reference Vukovic, Gvozdenovic, Gajic, Gajic, Jakovljevic and Mccormick2008).
In addition to the quantitative assessment of the content validity of the items, experts also ensured that items were clear, comprehensive and feasible for patients’ use. The conclusion of the activities of these experts made it easy to operationalise the final set of items in the questionnaire for patients’ use.
Think-aloud session with patients. The ‘think-aloud’ approach with PHC patients was found suitable to ‘road test’ and further revise the questionnaire. In all, 20 adult patients visiting the Aluu Health Centre in Rivers State were consecutively given copies of the questionnaire while they were with the researcher. They were instructed to verbalise their thoughts on the clarity, appropriateness and comprehensibility of all the items and instructions in the questionnaire.
Phase 3: quantitative pilot surveys
Two consecutive waves of cross-sectional surveys were used to determine the questionnaire’s acceptability across population groups and a more appropriate item response format as described below.
Testing questionnaire’s acceptability. Survey involved 200 consecutive regular patients recruited from the four centres in the north and south of Nigeria where the qualitative interviews were earlier conducted. Acceptability was assessed across groups using indices such as
-
∙ response rate (proportion of sampled respondents that returned the questionnaire)
-
∙ item non-response rate (proportion of individual items in the questionnaire omitted by respondents)
-
∙ endorsement frequencies (distribution of responses across the various response options)
-
∙ distribution characteristics of the scores (items mean scores, standard deviation, skewness, kurtosis and range)
-
∙ floor effect (proportion of respondents that endorsed the lowest response option) and
-
∙ ceiling effects (proportion of respondents that endorsed the highest response option) (Streiner and Norman, Reference Vukovic, Gvozdenovic, Gajic, Gajic, Jakovljevic and Mccormick2008).
Items with >10% missing data or an uneven distribution of responses across the various response categories were further revised.
Testing response formats. The performance of two response formats was tested during the administration of questionnaire variants in sequence to 322 patients attending Aluu Primary Health Centre, Rivers State. Response formats were either five-point Likert-type response format (‘strongly disagree’, ‘disagree’, ‘neither agree nor disagree’, ‘agree’ and ‘strongly agree’) or five-point adjectival response format (‘poor’, ‘fair’, ‘good’, ‘very good’ and ‘excellent’). The outcomes were response rate, missing items, questionnaire scores, time of completion and ease of patients’ completion of the questionnaire (graded on 1–7 scale). The performance of these response formats was compared using the
-
∙ The standardised mean difference (SMD) of continuous measures such as item scores, time of completion and patient grading of the questionnaire.
-
∙ The odds ratios (OR) of proportions such as items’ response rates and proportionate endorsement of floor and ceiling options.
Phase 4: psychometric validation
Although a minimum of 300 subjects are recommended for either exploratory or confirmatory factor analysis (Comrey and Lee, Reference Field2013), using larger sample size improves the chances of the estimates of the standard errors and factor loading being a true reflection of the actual population values (Hinkin, Reference Harmsen, Bernsen, Meeuwesen, Pinto and Bruijnzeels1998). A multistage sampling technique was used to recruit 1680 regular visitors to 24 primary health centres located in 12 local governments across six states for this cross-sectional validation study. This involved the selection of a state from each geopolitical zone by simple random sampling. Stratified random sampling technique was also used to select a predominant rural and urban local government area (LGA) from selected States on the basis of remoteness, population and provision of essential services. The process which was assisted by staff of the ministry of health in these States saw the selection of 12 LGAs. Two PHCs were selected from each of these LGAs using a list of all PHC facilities obtained from the Federal Ministry of Health (FMOH, Nigeria, 2012a). Four of the 24 selected PHC centres were later replaced by others closest to them as they were not functioning at the time of the survey. Eventually, the 70 patients allocated per facility were recruited through convenience sampling.
Quantitative field data were analysed using SPSS version 20 (SPSS, Reference Streiner and Norman2011) with statistical significance interpreted with P<0.05. Statistical techniques were used to determine the internal structure of the questionnaire (exploratory factor analysis); the internal consistency reliability (Cronbach’s α); the construct and criterion validities (findings of the Pearson’s correlation coefficient and structural equation modelling); and the acceptability (entire questionnaire and item response pattern). These procedures are explained below.
Internal structure. Principal component extraction method with varimax rotation identified linear components within the scale and reduced items into possible underlying dimensions. The Kaiser–Meyer–Oilkin (KMO) normalisation and Bartlett’s test of sphericity where indices that confirmed if the sample size was adequate for factor analysis. A re-analysis which included only items that had eigenvalues ⩾1, factor loading ⩾0.50 and a difference of 0.15 between factors was done (Streiner and Norman, Reference Vukovic, Gvozdenovic, Gajic, Gajic, Jakovljevic and Mccormick2008; Field, 2013).
Acceptability. The various indices for assessing acceptability (as defined and used in the earlier quantitative survey) were reported for final items in the questionnaire.
Reliability. Internal consistency which estimates the degree of relatedness of all items in the questionnaire was determined by the Cronbach’s α. Acceptable α should be >0.7 for the questionnaire and its domains (Streiner and Norman, Reference Vukovic, Gvozdenovic, Gajic, Gajic, Jakovljevic and Mccormick2008).
Validity. Demonstrating latent or hypothetical constructs can be problematic where there are no clear ‘gold standards’ or referents. A series of converging statistical tests used to demonstrate the construct validity of this multi-dimensional questionnaire as explained below:
-
∙ The convergent and discriminant validities of items and domains in this multi-dimensional questionnaire were demonstrated from their partial correlation coefficients (Campbell and Fiske, Reference Campbell and Fiske1959; Streiner and Norman, Reference Vukovic, Gvozdenovic, Gajic, Gajic, Jakovljevic and Mccormick2008). We examined if items within the domains (set of items) in this multi-dimensional questionnaire measure same or different constructs (domains) and subsequently explored the relationships between these domains and the entire questionnaire. Items defining latent or hypothetical constructs are expected to correlate significantly more with a domain they are theoretically associated with, than with other domains in the scale. Convergent validity is supported if (a) Cronbach’s α for each domain or entire questionnaire is >0.7, (b) there is moderate to high correlation between entire questionnaire and its domains (>0.4), (c) there is moderate to high correlation between item and entire questionnaire (>0.4), (d) the item–item correlation within domain is >0.2, (e) the Cronbach’s α of a particular domain is substantially higher than its correlation coefficients with other domains.
-
∙ The Discriminant validity is similarly supported with the moderate correlation between domains. This indicates that they measure distinct aspects of the same constructs (Campbell and Fiske, Reference Campbell and Fiske1959; Ware and Gandek, Reference Wolf, Putnam, James and Stiles1998; Streiner and Norman, Reference Vukovic, Gvozdenovic, Gajic, Gajic, Jakovljevic and Mccormick2008).
The construct was further demonstrated by the questionnaire’s ability to discriminate scores between the group. Construct validity is supported, if in line with a priori hypothesis, female patients or those with better self-rated health status, are associated with significantly higher evaluation scores (Al-Mandhari et al., Reference Al-Mandhari, Hassan and Haran2004; Baltaci et al., Reference Baltaci, Eroz, Ankarali, Erdem, Celer and Korkut2013). The relationship between evaluation scores and these explanatory variables were examined using structural equation modelling from regression analyses.
The correlation between the short-form (PES-SF) and full PES (PES before psychometric validation survey), patients’ general satisfaction, willingness to return or recommend the centre to friends, was conducted to demonstrate the concurrent validity of PES-SF (Fitzpatric et al., 1998; Ramsay et al., Reference Safran, Kosinski, Tarlov, Rogers, Taira, Lieberman and Ware2000; Webster et al., 2011).
Ethics and permission
The ethics committee at the University of Manchester (ref no. 14280) granted approval for this study. Permissions were obtained from the local ministries or PHC boards in Rivers, Benue, Lagos, Adamawa, Bayelsa States and from participating local government councils in Anambra, Kaduna and the Federal Capital Territory. Eligible participants in all phases of the research were outpatients; aged ⩾18 years; attended selected health centres at least once in the preceding six months; and gave consent to participate. Patients participation in all phases of the research was voluntary, potential participants received detailed information on the research and assurance of confidentiality before giving signed consent. Each participant later received 250 naira (c. £1) in appreciation for the time they spent being involved in the research.
Field assistants
Eight field assistants were trained at the commencement of the research and these continued with the team through the various phases of the research. During the training, narrative accuracy checks using health workers with dual linguistic skills in specific locations were used in validating translated data by team’s assistants who served as interpreters during the qualitative interviews and also assisted in the administration of questionnaires to less literary-skilled participants during the various quantitative studies.
Results
Item generation
Most of the 23 identified measures had limitations in their appropriateness for use in the Nigerian PHC setting. In all, 27 of the 47 qualitative interviews were conducted in the north, 25 were with female patients, and the English language was the medium of communication in 25 interviews. Most of the items (36 of the 39 items) in the draft questionnaire were generated from content analyses of interview transcripts. The remaining items–patient general satisfaction, the likelihood of return and recommending friends and family members to the centre, as well as patient sociodemographic variables were extracted from available studies.
Face and content validity
In all, 25 out of the 39 items were rated relevant by all experts; a further 12 by five of the six experts while two were rated relevant by only four experts. The calculated i-CVI ranged from 0.67 to 1.00 while the s-CVI was 0.93. The ICC for absolute agreement among experts of 0.93 [F(5, 190)=15.1, P<0.001] shows that the level of agreement among experts was too substantial to have been due to chance. Two items evaluating telephone access and staff punctuality with i-CVI⩽0.78 were deleted. In the subsequent round, 12 items were considered not feasible for accurate assessments by patients leaving the questionnaire with 27 items under eight domains. The instruction permitted patients to omit items they consider not applicable to them as the do not know/doesn’t apply response option was not accommodated.
Further revisions were made after the ‘think-aloud’ sessions and these included the addition of timeframe to the first two items; reference made to particular staff consulted in the facility in item 14; making the style and clarity of the independent variables clearer.
Quantitative pre-test
Respondents in the first quantitative pilot survey were mostly female (87.4%), married (91.9%), had consultations with nurses (54.8%) and did not pay for the services they received (63.7%). The mean response rate was 95% while the item non-response rates were higher in the last three items that had 11-point response format (7.4, 15.8 and 6.7%, respectively) as well as response to the question on age which was open-ended (16.8%). The acceptability of items was comparable across population groups in this survey but there was a general aversion for endorsing lowest points on the multipoint response formats (mean=2.0%, range 0–14.4) and a tendency for endorsing the highest point (mean=48.7%, range 32.2–71.1). Mid options in the 11-point response format were also mostly redundant. Subsequent revisions which were tested in the subsequent experiments included the adoption of five-point response format for all items and creating age ranges.
The result of the research done to compare the performance of two commonly used response formats revealed that patients were 50% more likely (OR=1.54, 95% confidence interval (CI): 1.27–1.89, P<0.001) to respond to items with adjectival response format than Likert-type format. By contrast, mean item score was significantly higher in the Likert-type variant (SMD=0.12, 95% CI: 0.08–0.17, P=0.02). The decision to trade higher item score for validity from these evidence formed the basis for adopting the adjectival response format for PES.
The full version of PES had 27 items which were grouped into eight domains (facility, geographic access, organisation, financial access, staff, waiting time, consultation and benefits). In all, 25 items had five-point adjective response format while the remaining indicated duration in time spent coming to the centre and waiting in the centre before being attended to by the health providers. PES can be completed in a mean time of 12.7 (±5.5) min while patients’ grading of the ease of completing the questionnaire on a 1–7 scale was 5.5 (SD=1.4).
Psychometric validation
From Table 1, more of the 1649 respondents that returned the questionnaire were aged 20–29 years (40%), female (73%), married (73%), perceived their health status as at least good (78%).
Table 1 Respondents’ characteristics in validation survey (n=1649)

CHP=Community Health Practitioner.
Dimensionality
From Table 2, the principal component extraction method with varimax rotation and Kaiser’s normalisation produced three domains (with five items each). These were codenamed facility, organisation and health care. The KMO of 0.88 and the Bartlett’s test of sphericity (χ 2=7691.8, df=105, P<0.001) confirmed sample adequacy for factor analysis. Scree plot (Appendix 1) shows that this three-component solution explains 56.6% of the common variance of perceived quality of PHC in Nigeria.
Table 2 Item loading during exploratory factor analysisFootnote a

a Principal component analysis with varimax rotation and Kaiser normalisation after excluding items that did not meet recommended psychometric criteria on acceptability, factor loading, internal consistency and homogeneity. The Kaiser–Meyer–Oilkin measure for sampling adequacy was 0.88 and the Bartlett’s test of sphericity (χ 2=7691.8, df=105 and P-value<0.001). Bold item load >0.5 and the three subscales explained a total of 56.6% of the total variance of the construct.
Acceptability
Acceptability measures across population groups presented in Tables 3 and 4 show that a response rate of 98.2% ranged from 84 to 100% across facilities. There are minimal skewness and kurtosis observed in the distribution characteristics of item and domain scores. The charts of the score distributions of items in the domains and entire questionnaire show near Normal distribution (Appendix 2). The floor and ceiling effects of items in the questionnaire presented in Table 4 show a mean floor effect of 4.8% with a range of 0.9–14.2%. In addition, the mean ceiling effect was 13.0% with a range of 4.9–19.1%. The chart of the floor and ceiling effects of the various items in the questionnaire are presented in Appendix 3.
Table 3 Response pattern across population groups

INRR=item non-response rate.
a Reported by health centre.
Table 4 Descriptive statistics and measurement properties of patient evaluation scale short form (PES-SF)

a Domain-total correlation coefficient (0.46–0.60), inter-domain correlation coefficient (0.36–0.54).
b Range of item loading, only items with eigenvalue >1 and factor loading value (FLV) >0.5 were included in the final questionnaire.
c Range of corrected item and hypothesised domain correlation with relevant items removed from scale for correlation.
d Range of corrected correlation between item and other domains with relevant items removed from scale for correlation.
e Range of correlation between individual items in the domains and the total PES-SF questionnaire with relevant items removed from questionnaire for correlation.
f Cronbach’s α is the overall reliability of items in their hypothesised scales.
g Values in parenthesis are the FLV of individual item in the questionnaire.
h Values asterisked are the various item correlations with their hypothesised domains.
Reliability
The Cronbach’s α coefficient for the entire questionnaire was 0.87 and for the facility, organisation and health care domains were 0.81, 0.79 and 0.78, respectively (Table 4).
Validity
Items correlated more significantly with their hypothesised domain (asterisked) than with other domains (Table 4). Convergent validity is supported by (a) the high internal consistencies of the domains and entire questionnaire; (b) moderate to high correlation between domains and total scores, item-domain (and domain-total) correlation >0.4; (d) item-total correlation of >0.4; (e) domain’s reliability coefficient (Cronbach’s α) being substantially higher than their correlation with other domains. Similarly, discriminant validity was supported by (a) moderate correlation between domains indicating their measurement of distinct aspects of same constructs; (b) significantly higher correlation between items and their hypothesised domain than with other domains. The shortened version of the questionnaire resulted from the removal of nine items which did not attain ‘a priori’ criteria for factor loading and discriminant validity.
PES-SF questionnaire and domain scores could differentiate population groups on the basis of gender and self-rated health status. There was also moderate to large correlation with PES, patients’ general satisfaction/likelihoods of returning/recommending close friends and relatives to the health centre (Table 5). The detailed contents of PES and PES-SF are presented in Appendix 4, respectively.
Table 5 Patient evaluation scale (PES) short form scores compared between patients’ groups and other scales

a Referent group in this univariate linear regression were males.
b B coefficient from univariate linear regression analysis.
c Referent group were those with poor/fair self-rated health status.
d Pearson’s correlation coefficient [95% confidence interval (CI)], P-value: *<0.05, ***<0.001.
Discussion
Article summarised the development and validation of the patient evaluation scale developed for use in the Nigerian PHC setting. The mixed method iterative development involving literature reviews, patient interviews, expert reviews, think-aloud sessions and waves of quantitative cross-sectional surveys with PHC patients resulted in the full form of the questionnaire. This full PES was trimmed following psychometric validation to provide three domains (with five items each) that had acceptable good Cronbach’s α and showed adequate convergent and discriminant validity. This shortened version also showed significant positive correlation with the full PES and other single-item measures.
Comparing findings
Face and content validation ensured that questionnaire’s items and instructions were clear, comprehensive and comprehensible to the patients and this could potentially help to reduce measurement errors (Nunnally et al., Reference Nunnally, Bernstein and Berge1967). The process of content validation permitted the deletion of items that were conceptually irrelevant and this also helps to ensure the content adequacy of the questionnaire. From this initial process, items evaluating telephone access and staff punctuality were deleted. This is surprising as telephone access would have been accorded high relevance in most other settings. For example, two of the 23 items in the EUROPEP instrument, developed for patient evaluation of PHC in European setting are meant to evaluate telephone access (Grol et al., Reference Greco, Powell and Sweeney2000). However, despite mobile telephone revolution in Nigeria, fixed business lines still remain a rarity, expensive and fraught with inefficiency (Adeoti and Adeoti, Reference Adeoti and Adeoti2008). Furthermore, currently organisation of PHC has no provision for receptionists to manage telephone calls to health centres.
During the initial quantitative survey, there were more missing items, redundancies in the midpoints of the response scale and ceiling effects in relation to the use of 11-point responses response format when compared with the five-point response format. This finding which supports earlier reports of higher variance and reliability along with reduced bias with the use of five-point response format (Streiner and Norman, Reference Vukovic, Gvozdenovic, Gajic, Gajic, Jakovljevic and Mccormick2008) offered another opportunity to uniformly adopt the five-point response format for PES.
Similarly, there was a reduction from 16.8 to 1.3% in non-response when age was changed from open-ended to closed response format. This situation which either demonstrates patients’ unwillingness to divulge information on actual age or poor awareness on this by a large proportion of respondents led to the creation of age strata in the PES questionnaire.
In comparing two different response formats, there was about a 50% higher chance of item responses with the adjectival response format. The adjectival response format is less commonly used in questionnaires for patient evaluation of PHC (Grol et al., Reference Greco, Powell and Sweeney2000; Harmsen et al., Reference Haddad, Fournier and Potvin2005) than the Likert-type response (Baker, Reference Baker1990; Laerum et al., Reference Hernan, Giles, O’Hara, Fuller, Johnson and Dunbar2004; Bjertnaes et al., Reference Bjertnaes, Lyngstad, Malterud and Garratt2011; Webster et al., 2011; Yang et al., Reference Yang, Shi, Lebrun, Zhou, Liu and Wang2013). There is no report of any previous comparison of the performance of these response formats along criteria used in this study. Nonetheless, our finding coupled with the fact that PES is more of an evaluative than a discriminative measure, justified the use of adjectival response format.
The validity of patient survey is enhanced by the low level of item non-response and high response rates to the questionnaire (Streiner and Norman, Reference Vukovic, Gvozdenovic, Gajic, Gajic, Jakovljevic and Mccormick2008). Both PES and PES-SF had mean item non-response rate much lower than target limit of 10% recommended for item deletion and questionnaire response rate from the various quantitative surveys were also very high (Streiner and Norman, Reference Vukovic, Gvozdenovic, Gajic, Gajic, Jakovljevic and Mccormick2008). High response rates are also commonly reported with patients’ surveys in PHC across Sub-Saharan Africa (Baltussen et al., Reference Baltussen, Ye, Haddad and Sauerborn2002; Oladapo et al., Reference Oladapo, Iyaniwura and Sule-Odu2008; Oladapo and Osiberu, Reference Oladapo and Osiberu2009; Udonwa et al., Reference Ware and Gandek2010; Ogaji and Etokidem, Reference Ogaji and Etokidem2012) when compared with other settings (Grogan et al., Reference Grant and Davis2000; Ramsay et al., Reference Safran, Kosinski, Tarlov, Rogers, Taira, Lieberman and Ware2000; Campbell et al., Reference Campbell, Dickens, Richards, Pound, Greco and Bower2007; Reference Campbell, Smith, Nissen, Bower, Elliott and Roland2009; Bjertnaes et al., Reference Bjertnaes, Lyngstad, Malterud and Garratt2011; Bova et al., Reference Bova, Route, Fennie, Ettinger, Manchester and Weinstein2012; Yang et al., Reference Yang, Shi, Lebrun, Zhou, Liu and Wang2013). While the impact of financial incentives or mode of questionnaire administration on the response rate remains unclear, high response to a questionnaire is indicative of the extent respondents are willing and able to complete a survey. The high level of acceptability observed in the general population was also demonstrated across population groups in the series of quantitative surveys. This in part shows that the questionnaire is suitable for use among different groups and constituents in Nigeria’s diverse population.
Questionnaires’ dimensions, reliability and validity are often derived from psychometric analyses (Rosnow and Rosenthal, Reference Starfield1996; Safran et al., Reference Starfield, Shi and Macinko1998; Campbell et al., Reference Campbell, Dickens, Richards, Pound, Greco and Bower2007; Streiner and Norman, Reference Vukovic, Gvozdenovic, Gajic, Gajic, Jakovljevic and Mccormick2008; Webster et al., 2011). The validity of PES was assured by the process of content validation using experts and patients; factor analysis and determination of domains (set of items); high internal consistency of scale/domains; the result of the convergent/discriminant as well as the criterion-related validity testing.
We reported details of the measurement properties of this questionnaire following the validation study. Previous measures have reported indices such as internal consistency (Wolf et al., 1978; Baker, Reference Baker1991; Haddad et al., Reference Grogan, Conner, Norman, Willits and Porter1998; Safran et al., Reference Starfield, Shi and Macinko1998; Grogan et al., Reference Grant and Davis2000; Ramsay et al., Reference Safran, Kosinski, Tarlov, Rogers, Taira, Lieberman and Ware2000; Meakin and Weinman, Reference Lynn2002; Laerum et al., Reference Hernan, Giles, O’Hara, Fuller, Johnson and Dunbar2004; Mead et al., Reference Lee, Choi, Sung, Kim, Chung, Kim, Jeon and Park2008; Lee et al., Reference Laerum, Steine and Finset2009; Bjertnaes et al., Reference Bjertnaes, Lyngstad, Malterud and Garratt2011; Halcomb et al., Reference Grol, Wensing and Olesem2011; Webster et al., 2011; Bova et al., Reference Bova, Route, Fennie, Ettinger, Manchester and Weinstein2012; Vukovic et al., Reference Wensing and Elwyn2012; Roland et al., 2013; Yang et al., Reference Yang, Shi, Lebrun, Zhou, Liu and Wang2013), questionnaire’s response rate (Baker, Reference Baker1991; Safran et al., Reference Starfield, Shi and Macinko1998; Grogan et al., Reference Grant and Davis2000; Ramsay et al., Reference Safran, Kosinski, Tarlov, Rogers, Taira, Lieberman and Ware2000; Meakin and Weinman, Reference Lynn2002; Greco et al., 2003; Campbell et al., Reference Campbell, Dickens, Richards, Pound, Greco and Bower2007; Bjertnaes et al., Reference Bjertnaes, Lyngstad, Malterud and Garratt2011; Bova et al., Reference Bova, Route, Fennie, Ettinger, Manchester and Weinstein2012; Yang et al., Reference Yang, Shi, Lebrun, Zhou, Liu and Wang2013) and divergent properties (Baker, Reference Baker1991; Grogan et al., Reference Grant and Davis2000; Ramsay et al., Reference Safran, Kosinski, Tarlov, Rogers, Taira, Lieberman and Ware2000; Harmsen et al., Reference Haddad, Fournier and Potvin2005; Lee et al., Reference Laerum, Steine and Finset2009; Halcomb et al., Reference Grol, Wensing and Olesem2011). Less frequently reported measures are floor and ceiling effects (Safran et al., Reference Starfield, Shi and Macinko1998; Campbell et al., Reference Campbell, Dickens, Richards, Pound, Greco and Bower2007; Bjertnaes et al., Reference Bjertnaes, Lyngstad, Malterud and Garratt2011), inter-item correlation (Haddad et al., Reference Grogan, Conner, Norman, Willits and Porter1998; Meakin and Weinman, Reference Lynn2002; Campbell et al., Reference Campbell, Dickens, Richards, Pound, Greco and Bower2007), item-total correlation (Haddad et al., Reference Grogan, Conner, Norman, Willits and Porter1998; Safran et al., Reference Starfield, Shi and Macinko1998; Campbell et al., Reference Campbell, Dickens, Richards, Pound, Greco and Bower2007), inter-scale correlation (Wolf et al., 1978; Safran et al., Reference Starfield, Shi and Macinko1998; Lee et al., Reference Laerum, Steine and Finset2009), questionnaire’s correlation with general satisfaction (Haddad et al., Reference Grogan, Conner, Norman, Willits and Porter1998; Ramsay et al., Reference Safran, Kosinski, Tarlov, Rogers, Taira, Lieberman and Ware2000; Webster et al., 2011), items’ response rate (Bjertnaes et al., Reference Bjertnaes, Lyngstad, Malterud and Garratt2011; Yang et al., Reference Yang, Shi, Lebrun, Zhou, Liu and Wang2013), completion time (Safran et al., Reference Starfield, Shi and Macinko1998), inter-rater reliability (Harmsen et al., Reference Haddad, Fournier and Potvin2005) and questionnaire’s correlation with existing measure (Meakin and Weinman, Reference Lynn2002).
The 18 and 27-item versions of PES are easy to administer and will be useful for evaluating the structure, process and outcome quality dimensions of PHC in the Nigerian setting. We anticipate that practitioners and researchers would use these tools to identify strengths and weaknesses along aspects of PHC and to initiate patient-focussed quality improvement. The PES-SF scores correlate highly with those of the full PES and using the PES-SF may increase respondents’ willingness and ease of participation with attendant reduction in administrator’s stress in collecting and processing of data.
Strengths and limitations
The study strengths are underpinned by the empirical approaches used to generate items, the iterative design, consistent good measurement performance of PES from the series of cross-sectional surveys, multi-centre testing across Nigeria, converging statistical proof of construct validity, and the involvement of PHC patients in all phases of development.
There are limitations from the various research methods applied in this study. For example, the opinions of subject experts and patients involved in various phases of PES development could vary from others in the general population. Although we found no report of the sociodemographic characteristics of PHC users in Nigeria, the study population varied markedly from the general Nigerian population. Another threat to external validity is the unavoidable use of non-probability sampling techniques in the final recruitment of subjects. The questionnaire is in English and some were administered by bilingual research assistants to patients who are not fluent in English. Despite the training and validation of interpreted data from these assistants, the use of interpreters in multiple response questionnaire surveys can still be problematic. Unfortunately, the responses from the self-administered and interviewer-administered questionnaires were not compared to ascertain if there are bias arising from the use of interpreters in multiple response questionnaires like the PES. A common observation with the PES is that though the wording of some items appear unconventional to international subjects, they are familiar to the Nigerian population.
The inclusion of empirically generated items in a questionnaire could enhance the suitability of both PES and PES-SF for patient-focussed quality improvement. However, PES may also be suitable for measuring some objectives of universal health coverage (equity, quality and financial protection) and also assessing some defining characteristics of PHC such as accessibility (geographic, financial, organisational); comprehensiveness, preventive focus, and effectiveness.
Conclusion
These multi-scale questionnaires were developed through a multi-phase process that involved primary care patients. PES fields a battery of items that covers important aspects of patients’ experiences of PHC, has good measurement properties and consistently high acceptability across different population groups from the serial quantitative surveys. The shortened form is quite reliable and showed adequate convergent and discriminant validity. The PES and PES-SF may be useful in practice and research aimed at patient evaluation, comparing performance, understanding trends and testing patient-focussed improvements in PHC in Nigeria.
Future research will include investigating the sociodemographic characteristics of local users of PHC, translation of PES into major Nigerian languages and subsequent validation of these versions and further validation of PES against external quality criteria.
Acknowledgements
The authors are grateful to all the patients who took part in this study and PHC staff for all their support during data collection in all the phases of this research. We appreciate the cooperation of the National Primary Health Care Development Agency and the various ministries of health/primary health care boards in the states study was conducted. The authors would like to thank Steve Abah, Abisoye Oyeyemi, Wisdom Sawyer, Omosivie Maduka, Margaret Mezie-Okoye and Queen Eke, Andrew Abue, Uchenna Ugwoke, Lawrence Izang, Chimdi Nworgu, John Owoicho and Daniel Iyah who provided various assistance during this research work.
Authors’ contributions: All authors were involved in conceptualising and planning of the study. Data collection was done by a team headed by D.S.O. D.S.O. also drafted the manuscript which was critically reviewed by others. All authors contributed to the interpretation of the results and also read and approved the final manuscript.
Financial Support
This work was supported by a grant from the Niger Delta Development Commission (NDDC/DEHSS/2013PGFS/RV/5).
Appendix 1

Figure A1 Total variance explained by three factors on Scree plot.
Appendix 2

Figure A2 Score distribution for the domains and entire patient evaluation scale (PES) short form scale
Appendix 3

Figure A3 Floor and ceiling effects in patient evaluation scale short form
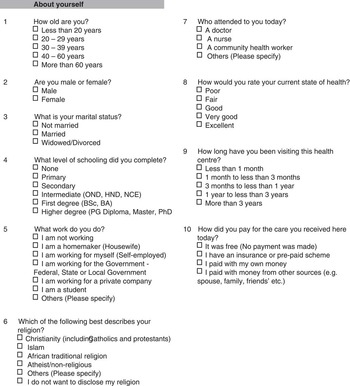
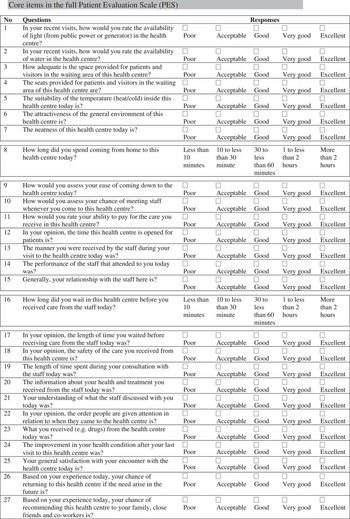
Appendix 4
THE PATIENTS’ EVALUATION SCALE (PES) FOR PRIMARY HEALTH CARE IN NIGERIA